EFFECT OF ALTERNATIVE muLTINuTRIENT sOuRCEs ON
sOIL CHEmICAL PROPERTIEs
Vanessa martins(1), Douglas Ramos Guelfi Silva(2), Giuliano marchi(3), maurício Cunha
Almeida Leite(2), Éder de souza martins(3), Ana stella Freire Gonçalves(2) and Luiz Roberto
Guimarães Guilherme(2)*
(1) Universidade Federal do Piauí, Colégio Técnico de Bom Jesus. Bom Jesus, Piauí, Brasil.
(2) Universidade Federal de Lavras, Departamento de Ciência do Solo, Lavras, Minas Gerais, Brasil. (3) Empresa Brasileira de Pesquisa Agropecuária, Planaltina, Distrito Federal, Brasil.
* Corresponding author. E-mail: guilherme@dcs.ufla.br
ABsTRACT
The current high price of potassium chloride and the dependence of Brazil on imported materials to supply the domestic demand call for studies evaluating the efficiency of alternative sources of nutrients. The aim of this work was to evaluate the effect of silicate rock powder and a manganese mining by-product, and secondary materials originated from these two materials, on soil chemical properties and on brachiaria production. This greenhouse experiment was conducted in pots with 5 kg of soil (Latossolo Vermelho-Amarelo distrófico - Oxisol). The alternative nutrient sources were: verdete, verdete treated with NH4OH, phonolite, ultramafic rock, mining waste and the proportion of 75 % of these K
fertilizers and 25 % lime. Mixtures containing 25 % of lime were heated at 800 ºC for 1 h. These sources were applied at rates of 0, 150, 300, 450 and 600 kg ha-1 K
2O, and incubated
for 45 days. The mixtures of heated silicate rocks with lime promoted higher increases in soil pH in decreasing order: ultramafic rock>verdete>phonolite>mining waste. Applying the mining waste-lime mixture increased soil exchangeable K, and available P when ultramafic rock was incorporated. When ultramafic rock was applied, the release of Ca2+ increased
significantly. Mining subproduct released the highest amount of Zn2+ and mn2+ to the soil.
The application of alternative sources of K, with variable chemical composition, altered the nutrient availability and soil chemical properties, improving mainly plant development and K plant uptake, and are important nutrient sources.
Keywords: soil acidity, nutrient availability, rock powder, multi-nutrient fertilizer.
INTRODuCTION
Since Brazil has a large area of crop production, and the nutrient availability of the soils is low, the country has become a major consumer of highly soluble mineral fertilizers such as potassium chloride (KCl), most of which is imported (DNPM, 2011).
In Brazil, there are K-rich rocks (Resende et al., 2006), but with lower solubility than KCl. Alkaline feldspars, feldspathoids and micas are alternative sources of K for fertilizer production in form of salts, thermophosphates, or for direct application to the soil (Nascimento and Loureiro, 2004). Among the rocks studied earlier by Resende et al. (2006), biotite schist, alkaline breccia, carbonatite, phlogopite, and alkaline ultramafic rock had the greatest capacity to release K. These rocks are composed of several chemical elements that play a role as plant nutrients.
Silicate rocks and mining or steel industry mining wastes represent alternatives, because they contain plant nutrients in appreciable amounts and availability, depending on the minerals in their composition. These rock components contribute to increase soil fertility in the medium to long-term, according to their solubility and reaction with soil. They contribute to increase soil fertility and, aside from P, K, Ca, and Mg, also include essential micronutrients, such as Zn, and Mn (van Straaten, 2007). Additionally, the nutrient release from rocks is slow and gradual, which reduces losses by leaching and favors a long-term release. Some materials have an alkalizing effect, acting as soil conditioners (Resende et al., 2006). Thus, it is essential to know the soil mineralogy and forms of K, among other
proprieties, which may contribute to the prediction of supply, fixation and availability of this nutrient for crops.
This study aimed to evaluate the application of alternative potassium sources on some soil chemical properties, and Marandu grass (Brachiaria brizantha cv. Marandu) production, analyzing their efficiency after 45 days of incubation of the rocks and mining waste in the soil.
mATERIAL AND mETHODs
Samples from the 0-20 cm layer of a dystrophic Red-Yellow Latosol (Oxisol) were collected in Itutinga, State of Minas Gerais. The soil analysis showed the following results: pH(H2O) 4.6;
0.06 cmolc dm-3 K+; 5.83 mg dm-3 Si; 10.3 mg dm-3 S;
0.42 mg dm-3 P; 0.2 cmol
c dm-3 Ca2+; 0.1 cmolc dm-3 Mg2+;
0.35 cmolc dm-3 Al3+; 3.43 cmol
c dm-3 H+Al;
3.78 cmolc dm-3 CEC at pH 7.0 (T); 18.1 mg dm-3 Fe;
2.52 mg dm-3 Zn; 0.71 mg dm-3 Cu; 0.1 mg dm-3 B;
0.1 mg dm-3 Mn; 692 g kg-1 sand; 25 g kg-1 silt;
283 g kg-1 clay; 1.0 mg dm-3 P-resin, and 18.95 mg L-1
of remaining-P. For Ca2+, Mg2+ and Al3+, the chemical
extractant was 1 mol L-1 KCl, and for K, P, Fe, Zn,
Mn, Cu, Si, and Na we used Mehlich-1.
The rock powders and a mining by-product were originated by different processes in different regions: phonolite (Plateau of Poços de Caldas, MG) originally from alkaline volcanic rock (with high Na2O + K2O
contents) are frequently vitreous to sub-vitreous; ultramafic alkaline rock (Lages, SC), formed by an igneous intrusion composed of ferromagnesian REsumO: AlterAções nos AtriButos químicos do solo PelA Adição de
Fontes AlternAtiVAs multinutrientes
o custo atual do cloreto de potássio relacionado à grande dependência de sua importação para suprir a
demanda nacional sugere a necessidade de estudos que procurem avaliar a eficiência de fontes alternativas de nutrientes. O objetivo deste trabalho foi avaliar o efeito de rochas silicáticas e de um subproduto de
mineração de manganês e suas alterações nos atributos químicos do solo e na produção da braquiária. o
experimento foi realizado em casa de vegetação, em vasos com 5 kg de um Latossolo Vermelho-Amarelo
distrófico. As fontes alternativas de nutrientes foram: verdete, verdete calcinado e tratado com NH4OH,
fonolito, ultramáfica, rejeito e a proporção de 75 % dessas fontes com 25 % de calcário calcítico. As misturas que apresentaram 25 % de calcário foram calcinadas a 800 ºC por 1 h. As fontes foram aplicadas nas
doses de 0; 150; 300; 450; e 600 kg ha-1 de K2O e permaneceram incubadas por um período de 45 dias. As
misturas de rochas silicáticas calcinadas com calcário que promoveram maior aumento nos valores de pH do solo foram: ultramáfica, verdete, fonolito e rejeito. Com a aplicação da mistura de rejeito, elevaram-se
o K+ do solo e o P disponível, quando da incorporação da ultramáfica, Quando foi aplicada ultramáfica,
o teor de ca2+ no solo aumentou significantemente. O rejeito liberou a maior quantidade de Zn2+ e mn2+
minerals, plagioclase and carbonate, was collected in a disused quarry, formerly used for construction material; waste from metallurgical processing of Mn mining from (Sete Lagoas, MG), in which K is removed from Fe ore and concentrated in the mining by-product; verdete (Cedro de Abaeté, MG) is a light greenish slate with a clayey matrix with Fe oxide in glauconite.
The rock powders and their mixtures (sieved through 200 mesh) were incorporated into the soil of each pot (5 kg soil per pot) and incubated for 45 days at 70 % field capacity. The experiment was arranged in a completely randomized design with a factorial scheme of nine treatments with three replications, with the following treatments: phonolite; lime and phonolite mixture (25:75 P); verdete; lime and verdete (25:75 V); verdete treated with NH4OH and calcined (Verdete NH4);
ultramafic rock; lime: ultramafic rock (25:75 U); Mn mining waste; and mixture lime and mining waste (25:75 T). Mixtures were made with 25 % calcitic lime with low Mg content (52.84 % CaO, 2.87 % MgO), with 93.21 % relative neutralizing value (RNV), neutralization power (NP) and relative efficiency (RE) of 102.17 and 91.23 respectively, 93.21 %. Then they were calcined at 800 °C for 1 h in a muffle furnace. The treatments consisted of rates of 0, 150, 300, 450, and 600 kg ha-1 K
2O, corresponding to 0.31,
0.62, 0.94, and 1.25 g/pot of K. The amount of rock powder and mining waste mixed with the soil was defined based on the total K2O content,
i.e., 5.10 % verdete, 3.9 % NH4OH verdete, 3.10 %
ultramafic rock, 5.45 % phonolite, 10.3 % mining waste, 30.9 % 25:75 V, 2.36 % 25:75 U, 4.12 % 25:75 P and 7.76 % 25:75 T, measured by method 3052 (USEPA, 1998).
After 45 days of incubation, soil samples were collected for analysis. The soil water pH was determined at a soil:water ratio of 1:2.5. Potential acidity content (H+Al) was determined by 0.5 mol L-1 Ca(OAc)
2; Ca2+, Mg2+, Al3+, P, K+, Zn2+,
and Mn2+ contents were extracted by Mehlich-1,
which were analyzed by colorimetry (P), titration (Ca2+, Mg2+ and Al3+), flame photometry (K+),
and atomic absorption spectrophotometry (Zn2+
and Mn2+). Base saturation (V %), CEC at pH 7.0
(T) and aluminum saturation (m) were obtained indirectly, by using exchangeable bases, potential acidity, and exchangeable aluminum values (CFSEMG, 1999).
Potassium fractionation was performed by a specific method for each form. Total K was extracted by microwave digestion, EPA3052 method (USEPA, 1998), exchangeable K by Mehlich-1 (Embrapa, 1997), and non-exchangeable K by 1 mol L-1 boiling
nitric acid solution (Pratt, 1973). Finally, soluble K+
was extracted by boiling water (Brasil, 2006) and determined by flame photometry.
After the incubation period, soil samples were collected to determine the complementary nutrient requirements of brachiaria plants. Macro (N and P 300, Mg 30 and S 50 mg dm-3) and micronutrients
(B 0.5, Mn 5.0, Zn 5.0, Mo 0.1 and Cu 1.5 mg dm-3)
were mixed to the soil in form of pure chemical solutions (Malavolta, 1980). Nitrogen and KCl were split in three applications. Liming was applied only to the control and KCl was used to raise base saturation to 50 %, as recommended by CFSEMG (1999) at a Ca:Mg ratio of 3:1.
Thirty seeds per pot were sown, which sprouted after seven days. Ten days after emergence, plants were thinned to five per pot, when ⅓ of the KCl of each rate was applied. Sixty days after thinning, the plants were harvested for analysis.
Plants were divided in leaves, and stem + sheath. All collected material was washed in distilled water and dried to constant weight in an oven with forced air circulation at 65 °C. Subsequently, the material was weighed and ground in a Willey mill. After grinding, samples of each shoot part were sent to a laboratory for determination of K contents (Malavolta et al., 1997). Potassium was determined by flame photometry after nitric-perchloric digestion.
The relative agronomic efficiency (RAE) of each treatment was calculated based on the K accumulation in brachiaria shoots, according to the following expression:
RAE (%) =
accumulation K2O rate
(SDM × shoot content) (fertilizer)
[
]
-
[
(SDM x shoot content) (control)]
For statistical analysis, the results were subjected to the mean test and regression analysis by statistical software SISVAR® version 5.3 (Ferreira, 2008), using mathematical models to optimize the equation and correlation analysis by software SigmaPlot 11.0.
REsuLTs AND DIsCussION
Rates of potassium, rock types, and rock-lime interactions significantly influenced nutrient availability and altered chemical properties of the incubated soil (p<0.05).
In general, pH values increased proportionally to the increase of applied K and according to the source (Figure 1).
verdete, which did not cause changes in soil pH as a function of K rates (Figure 1). The CEC of the soil used in this study was low (T) (3.78 cmolc dm-3);
thus, the buffering capacity is small and tends to re-equilibrate when mixed with neutralizing or acidic materials.
Alterations in soil pH may be explained by the variation in total carbonate content of each rock type (mg kg-1 of CaO and MgO, respectively):
ultramafic rock (13.1 and 18.5), verdete (4.83 and 3.68), phonolite (1.52 and 0.27), and mining waste (3.58, 0.79).
Calcium availability and sum of bases (SB) increased with increasing K2O rates for most
treatments (Figure 2a,b) with the exception of phonolite, verdete, verdete treated with NH4OH,
and mining waste. After incubation, fertilizers promoted increases in Ca2+ from 0.2, natural
soil, to 2.90 cmolc dm-3). Ultramafic rock + lime
(75 U: 25 L) passed (based on criteria of CFSEMG, 1999) from a “very low” to an “ideal” class (from 2.41 to 4.00 cmolc dm-3). Among the non-calcined
treatments, only ultramafic rock contributed to increase Ca2+ in the soil.
Magnesium availability increased in soil incubated with ultramafic rock, verdete and the
mixture 75 % ultramafic rock with 25 % lime. (Figure 2c).
Diversity in rock mineralogy explains the trends in nutrient release among treatments. Release rates of K+ increased after 45-day
incubation with multi-nutrient sources, except for ground verdete, mixed with lime, and treated with NH4OH (Figure 2d). Although this silicate
is rich in K, mineral solubility is low, since their structures are not easily disrupted by natural means, being required a more energetic treatment for K extraction.
Results showed higher K release from the mining by-product (229 mg dm-3) and its mixture 25:75 T
(233 mg dm-3) than from the other treatments, due
to the physic-chemical treatments of this material originated from manganese mining in a metallurgical process. The K release in decreasing order in treated soil was mining waste>25:75T>25:75P>ultramafic rock>phonolite>25:75U.
Exchangeable K content in soil was 22.17 mg dm-3
before treatments were applied (Figure 2d). This value is near the minimum required for plant growth and is considered “low” (16-40 mg dm-3) K content by
CFSEMG (1999). After the treatments, even at the lowest K rates applied, materials such as ultramafic rock, mining waste, 25:75 P and 25:75 T, reached the “medium” level (41-70 mg dm-3), and with increasing
K rates reached “high” levels of K (71-120 mg dm-3)
(Figure 2d).
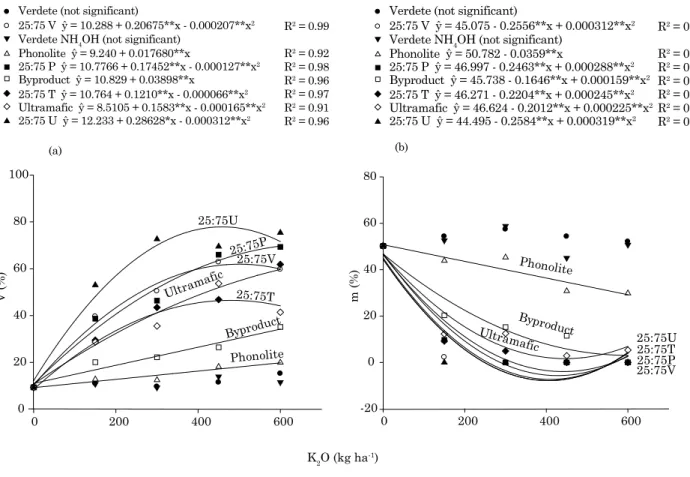
The increased availability of Ca2+, Mg2+ and
K+ with increasing K rates, altered soil base
saturation (V) (Figure 3). Highest values were obtained by lime mixture application, confirming the acidity-correction effect of these treatments, as indicated by the RNV for each treatment.
The mixture 25:75U (RNV = 29 %) induced highest base saturation (75 %). Ribeiro et al. (2010) reported that alkaline ultramafic rock has proved promising for acidic soils, releasing K+, Ca2+, and
Mg2+. This rock powder can also influence the uptake
of other nutrients, such as Fe, Mn and Zn, promoting plant growth and development, and play a role as soil conditioner.
Contrarily, Al saturation decreased substantially when treatments were applied (Figure 3b). Ground verdete and verdete treated with NH4OH did not
change soil pH and Al saturation significantly (Figure 1).
Aside from providing nutrients and improving soil physical-chemical properties, silicate rocks also provide silicon (Si), which is essential for the crop development (Figure 4a). Additionally, other positive effects of silicates are also related to Si-P interactions, enhancing P use (Carvalho et al., 2001). Ultramafic rock addition resulted in highest Si content in soil. Phosphate competes with silicate for the same adsorption sites, so that the latter can Figure 1. Effect of the different treatments and
K rates on soil pH, after a 45-day incubation. *significant at 5 % by the Scott Knott test. Non-significant for verdete and verdete mixed with NH4OH.
0 150 300 450 600
So
il pH
0.0 4.5 5.0 5.5 6.0 6.5 7.0
Verdete (not significant)
25:75 V ŷ = 4.65 + 0.0065**x - 0.000006**x2 Verdete NH4OH (not significant)
Phonolite ŷ = 4.73 + 0.0024**x
25:75 P ŷ = 4.72 + 0.00547**x - 0.000004**x2 Byproduct ŷ = 4.77 + 0.0017**x
25:75 T ŷ = 4.64 + 0.0053**x - 0.000004**x2 Ultramafic ŷ = 4.8 + 0.0021**x
25:75 U ŷ = 4.8 + 0.0084**x - 0.000009**x2
Ultram afic
Byprod uct Phonol
it
25:75 T 25:75P 25:75V
25:75U
K2O (kg ha-1)
R2 = 0.98
Ca
2+
(cmol
c
dm
-3)
0.0 0.5 1.0 1.5 2.0 2.5 3.0 3.5
25:75V
25:75V
25:75T
25:75
T
Ultramafic
Ultramafic
Byproduct
25:75
P
25:75
P 25:75U
25:75U
BS
(cmol
c
dm
-3)
25:75U
0 200 400 600
Mg
2+
(cmol
c
dm
-3)
0.05 0.10 0.15 0.20 0.25 0.30 0.35
(c) (d)
(a) (b)
25:75V Ultramafic
0 200 400 600
K (mg dm
-3)
0 50 100 150 200 250
Phonolite 25:75P Bypr
oduc t
25:7 5T
Ultrama fic
25:75U Verdete (not significant)
25:75 V ŷ = 0.207 + 0.006743**x - 0.000006**x2 Verdete NH4OH (not significant)
Phonolite (not significant) 25:75 P ŷ = 0.3066 + 0.003778**x Byproduct (not significant) 25:75 T ŷ = 0.2733 + 0.002156**x
Ultramafic ŷ = 0.1685 + 0.003841**x - 0.000004**x2 25:75 U ŷ = 0.2428 + 0.011117**x - 0.000012**x2
K2O (kg ha-1) R2 = 0.98
R2 = 0.99
R2 = 0.98 R2 = 0.83 R2 = 0.92
Verdete (not significant)
25:75 V ŷ = 0.36019 + 0.0071**x - 0.000007**x2 Verdete NH4OH (not significant)
Ultramafic ŷ = 0.3098 + 0.00531**x - 0.000005**x2 25:75 U ŷ = 0.4168 + 0.01188**x - 0.000012**x2 Phonolite (not significant)
25:75 P ŷ = 0.472 + 0.00423**x Byproduct ŷ = 0.452 + 0.00098**x 25:75 T ŷ = 0.462 + 0.00293**x
R2 = 0.99 R2 = 0.83 R2 = 0.92
R2 = 0.99 R2 = 0.82 R2 = 0.97
Verdete (not significant) 25:75 V ŷ = 0.1 + 0.000089**x Verdete NH4OH (not significant) Phonolite (not significant) 25:75 P (not significant) Byproduct (not significant) 25:75 T (not significant)
Ultramafic ŷ = 0.0943 + 0.000898**x - 0.000001**x2 25:75 U ŷ = 0.1114 + 0.000514**x - 0.000001**x2
R2 = 0.57
R2 = 0.89 R2 = 0.90
Verdete (not significant) 25:75 V (not significant) Verdete NH4OH (not significant) Phonolite ŷ = 23.392 + 0.0866**x 25:75 P ŷ = 24.536 + 0.1736**x Byproduct ŷ = 30.638 + 0.3258**x 25:75 T ŷ = 33.48 + 0.3057**x Ultramafic ŷ = 26.824 + 0.1098**x 25:75 U ŷ = 25.472 + 0.064**x
R2 = 0.99 R2 = 0.98 R2 = 0.97 R2 = 0.91 R2 = 0.72 R2 = 0.74
Figure 2. Regression equations for content of: a) calcium; (b) sum of bases (SB); (c) magnesium; and (d) potassium in soil as a function of K2O rates after a 45-day incubation. * Significant at 5 % by Scott
move (desorb) the first, and vice versa, from the solid to liquid phase. According to Prado and Fernandes (2001), Si occupies P adsorption sites and, thus, increases P availability in soil solution.
Available P (Mehlich-1) (Figure 4b) in soil treated with ultramafic rock and its mixture with lime increased from 0.47 mg dm-3 (zero-rate) to
7.9 mg dm-3 (450 kg ha-1 K
2O) and 4.5 mg dm-3
(600 kg ha-1). This is due to several factors; the pH,
for instance, influences P availability, and in this soil type, characterized by variable charges, increases in pH raise the P availability.
Ribeiro et al. (2010) observed that ultramafic rocks also contributed to an increase in exchangeable K, as well as P, Na, pH and base saturation in a Latossolo Amarelo (Oxisol).
Phosphorus extraction by resin in the soil treated with ultramafic rock, and its mixture, increased with increasing soil pH (Figure 1c). Release of P may be a result of Al and Fe precipitation, reduced adsorption of phosphate ions, as well as displacement of P from soil due to greater silicic acid activity.
When 25:75P and 25:75U were applied, there was a decrease in remaining-P levels with increasing
K2O rates (Figure 4d). This reduction may have
resulted from the increased concentration of Ca in soil (Figure 2a), which can complex with P.
Manganese mining waste, and its mixture (25:75T), were the treatments that released the highest amount of micronutrients, such as Zn2+
and Mn2+ (Figure 5). Extracted Zn2+ and Mn2+ from
soil raised, respectively, from 2.6 and 1 mg kg-1
(untreated soil), with the treatments mining waste and its mixture, respectively, to 61 and 34, and 396 and 273 (highest applied rates); treatments: mining waste and 25:75T did not exceed permissible limits of Zn for agricultural soils, according to Cetesb (2005). Zinc is present in several basic and acidic rocks, due to isomorphic substitution of Mg2+ by
Zn2+, common in silicate rocks. However, mining
waste is very rich in Zn, as a result of Mn extraction, which concentrates Zn in the mining waste.
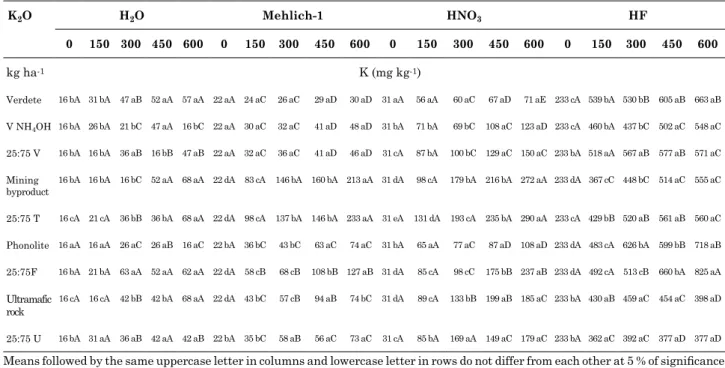
Potassium fractionation in soil
Total soil K content differed significantly among treatments. Higher levels of total K were found in treatments with the highest amounts of applied K, except for treatments 25:75V, ultramafic rock, and 25:75U that differed only from untreated soil
0 200 400 600
V (%)
0 20 40 60 80 100
25:75V
Phonolite 25:75P
25:75T
Byproduc t Ultram
afic 25:75U
0 200 400 600
m (%
)
-20 0 20 40 60 80
25:75P 25:75T 25:75U Phonolite
Byproduct Ultramafic
25:75V Verdete (not significant)
25:75 V ŷ = 10.288 + 0.20675**x - 0.000207**x2 Verdete NH4OH (not significant)
Phonolite ŷ = 9.240 + 0.017680**x
25:75 P ŷ = 10.7766 + 0.17452**x - 0.000127**x2 Byproduct ŷ = 10.829 + 0.03898**x
25:75 T ŷ = 10.764 + 0.1210**x - 0.000066**x2 Ultramafic ŷ = 8.5105 + 0.1583**x - 0.000165**x2 25:75 U ŷ = 12.233 + 0.28628*x - 0.000312**x2
R2= 0.99
R2= 0.92 R2= 0.98 R2= 0.96 R2= 0.97 R2= 0.91 R2= 0.96
Verdete (not significant)
25:75 V ŷ = 45.075 - 0.2556**x + 0.000312**x2
Verdete NH4OH (not significant) Phonolite ŷ = 50.782 - 0.0359**x
25:75 P ŷ = 46.997 - 0.2463**x + 0.000288**x2
Byproduct ŷ = 45.738 - 0.1646**x + 0.000159**x2
25:75 T ŷ = 46.271 - 0.2204**x + 0.000245**x2
Ultramafic ŷ = 46.624 - 0.2012**x + 0.000225**x2
25:75 U ŷ = 44.495 - 0.2584**x + 0.000319**x2
R2 = 0.88
R2 = 0.86
R2 = 0.95
R2 = 0.87
R2 = 0.92
R2 = 0.91
R2 = 0.86
(a) (b)
K2O (kg ha-1)
Si
li
co
n
(mg dm
-3)
4 6 8 10 12 14
Ultramafic
Phonolite
25:75P 25:75T
(a) (b)
0 200 400 600
P
Me
hl
ic
h 1
(mg dm
-3)
-2 0 2 4 6 8 10
Ultrama fic
25:75U
(c) (d)
0 200 400 600
Re
si
n-P
(mg dm
-3)
-10 0 10 20 30 40
Ultramafic
25:75P
25:75T Re
main
in
g-P
(mg
L
-1)
12 14 16 18 20 22 24 Verdete (not significant)
25:75 V (not significant)
Verdete NH4OH ŷ = 5.80 + 0.0056**x Phonolite ŷ = 6.163 + 0.0244**x - 0.00003**x2 25:75 P ŷ = 5.93 + 0.013**x - 0.00002**x2 Byproduct (not significant)
25:75 T ŷ = 6.35 + 0.0045**x
Ultramafic ŷ = 5.79 + 0.027**x - 0.00003**x2 25:75 U (not significant)
Verdete (not significant) 25:75 V (not significant) Verdete NH4OH (not significant Phonolite (not significant) 25:75 P (not significant) Byproduct (not significant)
25:75 T (not significant)
Ultramafic ŷ = -0.2549 + 0.0203**x - 0.000018**x2 25:75 U ŷ = 0.5707 + 0.0066**x
Phonolite (not significant) 25:75 P ŷ = 1.22 + 0.0046*x Verdete (not significant) 25:75 V (not significant) Verdete NH4OH (not significant)
Ultramafic ŷ = -2.09 + 0.097**x - 0.000098**x2 25:75 U ŷ = 0.872 + 0.322**x + 0.00004**x2 Byproduct (not significant)
25:75 T ŷ = 1.55 + 0.0049**x
25:7 5U
Phonolite (not significant) 25C:75P ŷ = 21.533 - 0.0068**x Verdete (not significant) 25:75 V (not significant) Verdete NH4OH (not significant) Ultramafic (not significant) 25:75 U ŷ = -20.343 - 0.011**x Byproduct (not significant) 25:75 T (not significant)
25C:75P
25C :75U R2 = 0.97
R2 = 0.72 R2 = 0.99
R2 = 0.78
R2 = 0.55
R2 = 0.96 R2= 0.76
R2= 0.99 R2 = 0.95
R2 = 0.77
R2 = 0.99 R2 = 0.69
R2 = 0.91
Verdete N H4OH
K2O (kg ha-1)
(Table 1). Total K content among all treatments ranged from 233 to 825 mg dm-3 (Table 1). Total
K contents in soil incubated with rocks and lime-rock mixtures were similar to those found in the clay fraction of Oxisols by Melo et al. (2005) (549, 810 and 960 mg dm-3), which were considered low.
Generally, younger soils have higher K levels (4,220; 4,191; 9,412 mg dm-3), which are significant, mainly,
due to the higher content of primary minerals in the clay fraction.
Several studies have shown high correlations between soil K extracted by nitric acid with K uptake by corn, wheat and eucalyptus (Simard et al., 1992; Melo et al., 2005). In this study, non-exchangeable K forms extracted by nitric acid and exchangeable K values extracted by Mehlich-1 were positively correlated.
Significant differences were observed for exchangeable K among treatments, ranging from 24, 26, 29, and 30 mg dm-3 K for verdete, to 83, 146,
160, and 233 mg dm-3 K for mining waste (Table 1).
Plant response to treatments
Leaf dry matter weight (LDM) increased linearly with increasing rates in treatments, after 60-day cultivation with 25:75P, 25:75T, ultramafic rock, and mining waste. Nonetheless, for 25:75U, rates of 200 kg ha-1 K
2O and higher promoted a decrease in
LDM. The lowest LDM values were obtained in all treatments containing verdete, being non-significant in relation to rates in the treatments 25:75V and phonolite (Figure 6a). Stem and sheath production were not significantly altered by increasing rates in the treatments 25:75 V, calcined verdete, verdete treated with NH4OH, and 25:75P. The LDM was
highest in soil treated with mining waste, phonolite, 25:75U, ultramafic rock, and 25: 75T, respectively with positive linear behavior (Figure 6b).
Leaf, stem and sheath production was lowest in the verdete treatments (pure, mixed with lime, and treated with NH4OH), unlike found by Eichler
and Lopes (1983). These authors tested a fertilizer obtained through calcination at 1,100 °C of verdete and lime (in equal parts), resulting in a shoot dry matter weight of corn equivalent to that obtained with KCl in the first crop cycle and greater in the following. This difference may be related to the heating temperature and time, and the mixture components and their proportions. Calcination with lime reduces mixture melting temperature, which, according to Kirsch (1972), favors structure alterations of the original mineral, and subsequent formation of other compounds, releasing part of the mineral-bound K.
At each stage of forage development, the leaf, stem and dead material ratios of plant dry matter differ.
(a) (b)
Verdete (not significant) 25:75 V (not significant) Verdete NH4OH (not significant) Phonolite (not significant) 25:75 P (not significant) Byproduct ŷ = 2.016 + 0.0937**x 25:75 T ŷ = 2.823 + 0.04877**x Ultramafic (not significant) 25:75 U (not significant)
R2 = 0.98 R2 = 0.97
R2 = 0.95 R2 = 0.99 Verdete (not significant)
25:75 V (not significant) Verdete NH4OH (not significant) Phonolite (not significant) 25:75 P (not significant) Byproduct ŷ = -9.698 + 0.618*x 25:75 T ŷ = -8.601 + 0.463**x Ultramafic (not significant) 25:75 U (not significant)
0 200 400 600
Zn
(m
g
dm
-3)
0 10 20 30 40 50 60 70
Bypr oduc
t
25:75T
0 200 400 600
Mn (m
g
dm
-3)
-100 0 100 200 300 400 500
Bypr oduc
t
25:75T
K2O (kg ha-1)
Figure 5. Availability of: (a) zinc, and (b) manganese in soil according to treatments after 45-day incubation. * Significant at 5 % by Scott Knott test. Non-significant for: verdete, verdete with NH4OH, 25:75V,
K2O (kg ha-1)
R2 = 0.60
R2 = 0.80
R2 = 0.47
R2 = 0.50
R2 = 0.80
R2 = 0.72
R2 = 0.79
R2 = 0.79
R2 = 0.55
R2 = 0.86
R2 = 0.84
R2 = 0.85
R2 = 0.60
0 200 400 600
Leaf dry mater (g)
4 6 8 10 12 14 16
Verdete ŷ = 8.293 - 0.0150**x + 0.000021*x2 25:75 V (not significant)
Verdete NH
4OH ŷ = 8.4947 - 0.0119*x + 0.000018**x 2 Phonolite (not significant)
25:75 P ŷ = 9.714 + 0.004*x Byproduct ŷ = 8.1107 + 0.00498**x
25:75 T ŷ = 8.787 + 0.00909**x Ultramafic ŷ = 9.1005 + 0.00534**x
25:75 U ŷ = 8.4429 + 0.02174**x - 0.000034**x2
Byproduct Ultramafic
Verdete 25:75U
Verdete NH4OH 25:75T
25:75P
0 200 400 600
St
em
+
shea
th
dr
y
(g
)
0 2 4 6 8 10 12
Verdete ŷ = 4.22 - 0.0117**x + 0.000017*x2 25:75 V (not significant)
Verdete NH
4OH (not significant) Phonolite ŷ = 4.6060 + 0.00268*x 25:75 P (not significant)
Byproduct ŷ = 4.4267 + 0.00585**x
25:75 T ŷ = 4.459 + 0.009349**x Ultramafic ŷ = 4.7353 + 0.00472**x 25:75 U ŷ = 5.041 + 0.003618**x
Verdete
Phonolite Byprod
uct
25:75T
Ultramafic 25:75U
(a) (b)
Figure 6. Dry matter of: (a) leaves, and (b) stem + sheath as affected by the treatments 60 days after planting. Table 1. Potassium fractionation in soil after a 45-day incubation, as affected by the different rates and
treatments
K2O H2O mehlich-1 HNO3 HF
0 150 300 450 600 0 150 300 450 600 0 150 300 450 600 0 150 300 450 600
kg ha-1 K (mg kg-1)
Verdete 16 bA 31 bA 47 aB 52 aA 57 aA 22 aA 24 aC 26 aC 29 aD 30 aD 31 aA 56 aA 60 aC 67 aD 71 aE 233 cA 539 bA 530 bB 605 aB 663 aB
V NH4OH 16 bA 26 bA 21 bC 47 aA 16 bC 22 aA 30 aC 32 aC 41 aD 48 aD 31 bA 71 bA 69 bC 108 aC 123 aD 233 cA 460 bA 437 bC 502 aC 548 aC
25:75 V 16 bA 16 bA 36 aB 16 bB 47 aB 22 aA 32 aC 36 aC 41 aD 46 aD 31 cA 87 bA 100 bC 129 aC 150 aC 233 bA 518 aA 567 aB 577 aB 571 aC
Mining
byproduct 16 bA 16 bA 16 bC
52 aA 68 aA 22 dA 83 cA 146 bA 160 bA 213 aA 31 dA 98 cA 179 bA 216 bA 272 aA 233 dA 367 cC 448 bC 514 aC 555 aC
25:75 T 16 cA 21 cA 36 bB 36 bA 68 aA 22 dA 98 cA 137 bA 146 bA 233 aA 31 eA 131 dA 193 cA 235 bA 290 aA 233 cA 429 bB 520 aB 561 aB 560 aC
Phonolite 16 aA 16 aA 26 aC 26 aB 16 aC 22 bA 36 bC 43 bC 63 aC 74 aC 31 bA 65 aA 77 aC 87 aD 108 aD 233 dA 483 cA 626 bA 599 bB 718 aB
25:75F 16 bA 21 bA 63 aA 52 aA 62 aA 22 dA 58 cB 68 cB 108 bB 127 aB 31 dA 85 cA 98 cC 175 bB 237 aB 233 dA 492 cA 513 cB 660 bA 825 aA
Ultramafic rock
16 cA 16 cA 42 bB 42 bA 68 aA 22 dA 43 bC 57 cB 94 aB 74 bC 31 dA 89 cA 133 bB 199 aB 185 aC 233 bA 430 aB 459 aC 454 aC 398 aD
25:75 U 16 bA 31 aA 36 aB 42 aA 42 aB 22 bA 35 bC 58 aB 56 aC 73 aC 31 cA 85 bA 169 aA 149 aC 179 aC 233 bA 362 aC 392 aC 377 aD 377 aD
This means that the plant structure changes over time. Animals have preferences for some plant parts, for example leaves over stems (L’Huillier et al., 1986). According to Pinto et al. (1994), a critical limit for a weight ratio (leaves:stem) of 1.0 has been considered. Lower weight ratio leaves:stem would mean a drop in forage quantity and quality. In this study, we found a mean ratio of 1.71.
Carvalho et al. (1991) evaluated Brachiaria decumbens responses to N and K fertilization in a Latossolo Vermelho-Amarelo (Oxisol) treated with 43.5 mg dm-3 K for two years (three growing cycles).
They found visual deficiency symptoms in leaves in treatments without K, which did not occur in our study, even when the forage was grown in untreated soil (22 mg dm-3 K).
Differences among treatments induced variations in soil-available K and, consequently, variations in forage yield. The treatments that provided more K to the soil (Figure 2d) were also those in which the plants absorbed more, that is, the treatments with mining by-product and 25:75T (Figure 7).
The agronomic efficiency index related to dry matter production was observed in decreasing order in the treatments: 25:75T>mining waste >phonolite>ultramafic rock>25:75U>25:75V.
100 200 300 400 500 600 700
RE
A
(%)
0 50 100 150 200 250 300
25:75T
Byproduct
Phonolite
Ultramafic 25:75U 25:75V
R2 = 0.91
R2 = 0.98
R2 = 0.49 R2 = 0.65 R2 = 0.94 R2 = 0.68 Verdete (not significant)
25:75 V ŷ = -17.841 + 0.1304**x Verdete NH4OH (not significant)
Phonolite ŷ = -109.13 + 0.991**x - 0.001**x2 25:75 P (not significant)
Byproduct ŷ = 92.73 + 0.232**x
25:75 T ŷ = -19.51 + 1.041**x - 0.0011**x2 Ultramafic ŷ = -67.88 + 0.692**x - 0.00067*x2 25:75 U ŷ = 16.836 + 0.089*x
K2O (kg ha-1)
Figure 8. Relative Agronomic Efficiency Index (RAE) of the multi-nutrient sources based on K accumulation in Brachiaria shoots, as affected by the applied rates.
0 200 400 600
K
le
af
(g
kg
-1)
0 2 4 6 8 10
Byproduct 25:75T
Phon
olite
Ultram afic
25:75U
25:75V
Verdete
Verdete NH4OH
0 200 400 600
40 60 80 100 120 140 160 180 200 220 240
Verdete
25:75V
Verdete NH
4OH
Phonolite Byproduct
25:75T
Ultram afic 25:75
U
K2O (kg ha-1) R2 = 0.67
R2 = 0.89 R2 = 0.88 R2 = 0.89
R2 = 0.91 R2 = 0.97 R2 = 0.94 R2 = 0.90
R2 = 0.82 R2 = 0.66 R2 = 0.96 R2 = 0.97
R2 = 0.99 R2 = 0.98 R2 = 0.95 R2 = 0.95 Verdete ŷ = 2.451 + 0.009486**x - 0.000114**x2
25:75 V ŷ = -2.162-0.004353x + 0.000132**x2 Verdete NH4OH ŷ = 2.113 + 0.0018373**x Phonolite ŷ = 1.8812 + 0.008545**x 25:75 P (not significant)
Byproduct ŷ = 2.790 + 0.025353**x - 0.000025**x2 25:75 T ŷ = 2.473 + 0.025117**x - 0.000025**x2 Ultramafic ŷ = 1.747 + 0.007303**x
25:75 U ŷ = 1.848 + 0.00416**x
Verdete ŷ = 105.813 + 0.5849**x - 0.000817**x2 25:75 V ŷ = 87.672 - 0 + 0.0749**x
Verdete NH4OH ŷ = 98.99 + 0.3025**x - 0.000317*x2 Phonolite ŷ = 100.78 + 0.159**x
25:75 P (not significant)
Byproduct ŷ = 90.524 + 1.0526x - 0.00109**x2 25:75 T ŷ = 94.29 + 1.146**x - 0.00138**x2 Ultramafic ŷ = 96.486 + 0.2772**x 25:75 U ŷ = 97.0321 + 0.2914**x
(a) (b)
K stem + sheath (mg kg
-3)
Verdete with NH4OH and verdete, which were not
significant in relation to applied rates (Figure 8).
CONCLusIONs
All treatments, except for verdete (pure, lime-calcined, and mixed with NH4OH), contributed
to soil pH increase, especially the mixtures 25:75U, 25:75P, 25:75P, and 25:75T.
Extracted silicon content increased with extracted P increases.
All mixtures, mainly 25:75U, and pure ultramafic rock, enhanced Ca2+ availability; consequently, they
increase base saturation and sum of bases.
Mining waste raised the Zn and Mn contents in soil and increased exchangeable K in soil.
Extracted exchangeable and non-exchangeable K were in the same order, and the highest values were found in mining waste, 25:75T, 25:75P, and ultramafic rock-treated soils.
Shoot dry matter weight was related to potassium supply.
The efficiency of potassium fertilization for marandu grass was highest in the treatments with 25:75T mixture and mining waste.
ACKNOWLEDGEMENTS
The authors are indebted to the Foundation for Research Support of the State of Minas Gerais (FAPEMIG), the National Council for Scientific and Technological Development (CNPq), and the Coordination for the Improvement of Higher Level Personnel (CAPES) for financial support.
REFERENCEs
Brasil. Ministério da Agricultura, Pecuária e Abastecimento. Manual de métodos analíticos oficiais para fertilizantes minerais, orgânicos, organominerais e corretivos. Brasília, DF: 2006. Companhia Ambiental do Estado de São Paulo - Cetesb. Decisão de diretoria No 195-2005-E, de 23 de novembro de 2005 [accessed Dec 10 2012]. Available at: http://www.cetesb.sp.gov.br/Solo/ relatorios/tabela_valores_2005.pdf.
Carvalho MM, Martins CE, Verneque RS, Siqueira C. Resposta de uma espécie de braquiária à fertilização com nitrogênio e potássio em um solo, ácido. R Bras Ci Solo. 1991;15:195-200.
Carvalho R, Furtini Neto AE, Santos CD, Fernandes LA, Curi N, Rodrigues DC. Interações silício-fósforo em solos cultivados com eucalipto em casa de vegetação. Pesq Agropec Bras. 2001;36:557-65. Comissão de Fertilidade do Solo do Estado de Minas Gerais - CFSEMG. Recomendações para o uso de corretivos e
fertilizantes em Minas Gerais - 5a Aproximação. Viçosa, MG: Folha Viçosa; 1999.
Departamento Nacional da Produção Mineral - DNPM. Potássio [internet]. Brasília, DF: Departamento Nacional da Produção Mineral; 2011 [accessed Mar 02 2013]. Available at: https://sistemas.dnpm.gov.br/publicacao/mostra_imagem. asp?IDBancoArquivo=7404.
Eichler V, Lopes AS. Disponibilidade do potássio do verdete de Abaeté, calcinado com e sem calcário magnesiano, para a cultura do milho (Zea mays L.) em solo de textura argilosa. Ci Prática. 1983;7:136-56. Empresa Brasileira de Pesquisa Agropecuária - Embrapa. Manual de método de análise de solo. 2ª ed. Rio de Janeiro; 1997. Ferreira DF. SISVAR: Um programa para análises e ensino de estatística. Rev Symp. 2008;6:6-41.
Kirsch H. Mineralogia aplicada. São Paulo: Universidade de São Paulo; 1972.
L’Huillier PJ, Poppi DP, Fraser TJ. Influence of structure and composition of ryegrass and prairie grass-white clover swards on the grazed horizon and diet harvested by sheep. Grass For Sci. 1986;41:259-67.
Malavolta E, Vitti GC, Oliveira SA. Avaliação do estado nutricional de plantas. Piracicaba: International Plant Nutrition Institute, 1997.
Malavolta E. Elementos de nutrição mineral de plantas. São Paulo: Agronômica Ceres; 1980.
Melo VF, Corrêa GF, Ribeiro NA, Maschio PA. Cinética de liberação de potássio e magnésio pelos minerais da fração argila de solos do triangulo mineiro. R Bras Ci Solo. 2005;29:533-45. Nascimento M, Loureiro FEL. Fertilizantes e sustentabilidade: O potássio na agricultura brasileira, fontes e rotas alternativas. Rio de Janeiro: Ministério da Ciência e Tecnologia; 2004. (Série Estudos e Documentos, 61).
Pinto JC, Gomide JA, Maestri M, Lopes NF. Crescimento de folhas de gramíneas forrageiras tropicais, cultivadas em vasos, com duas doses de nitrogênio. R Soc Bras Zootec. 1994;23:327-32. Prado RM, Fernandes FM. Efeito da escória de siderurgia e calcário na disponibilidade de fósforo de um Latossolo Vermelho-Amarelo cultivada com cana-de-açúcar. Pesq Agropec Bras. 2001;36:1199-204.
Pratt PF. Potassium. In: Black CA, editor. Methods of soil analysis. Madison: American Society of Agronomy; 1973. Part 1, p.1022-1032. (Agronomy Series, 9).
Resende AV, Martins ES, Oliveira CG, Sena MC, Machado CTT, Kinpara DI, Oliveira Filho EC. Suprimento de potássio e pesquisa de uso de rochas in natura na agricultura brasileira. Espaço Geogr. 2006;9:19-42.
Ribeiro LS, Santos AR, Souza LFS, Souza JS. Rochas silicáticas portadoras de potássio como fontes do nutriente para as plantas solo. R Bras Ci Solo. 2010;34:891-7.
Simard RR, De Kimpe CR, Zizka J. Release of potassium and magnesium from soil fractions and its kinetics. Soil Sci Soc Am J. 1992;56:1421-8.
United States Environmental Protection Agency - Usepa. Test methods for evaluation solid waste physical and chemical methods: Microwave assisted acid digest of sediments, sludges, soils and oils, SW - 846. Washington; 1998.