BROWN ADIPOSE TISSUE THERMOGENESIS HEATS BRAIN AND
BODY AS PART OF THE BRAIN-COORDINATED ULTRADIAN BASIC
REST-ACTIVITY CYCLE
Y. OOTSUKA,aR. C. DE MENEZES,aD. V. ZARETSKY,b A. ALIMORADIAN,aJ. HUNT,bA. STEFANIDIS,c B. J. OLDFIELDcAND W. W. BLESSINGa*
aDepartments of Physiology and Medicine, Centre for Neuroscience, Flinders University, Adelaide 5042, SA, Australia
bDepartment of Pharmacology and Toxicology, Indiana University, IN, USA
cDepartment of Physiology, Monash University, Clayton, Vic, Australia
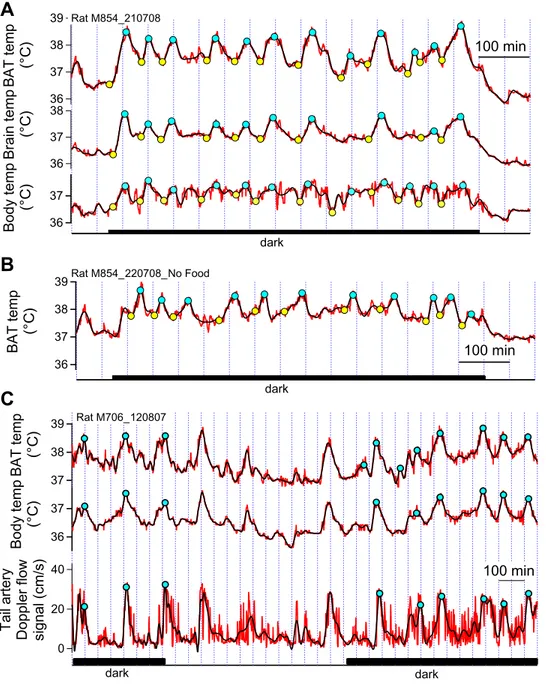
Abstract—Brown adipose tissue (BAT), body and brain tem-peratures, as well as behavioral activity, arterial pressure and heart rate, increase episodically during the waking (dark) phase of the circadian cycle in rats. Phase-linking of combi-nations of these ultradian (<24 h) events has previously been noted, but no synthesis of their overall interrelationships has emerged. We hypothesized that they are coordinated by brain central command, and that BAT thermogenesis, itself con-trolled by the brain, contributes to increases in brain and body temperature. We used chronically implanted instru-ments to measure combinations of bat, brain and body tem-peratures, behavioral activity, tail artery blood flow, and ar-terial pressure and heart rate, in conscious freely moving Sprague–Dawley rats during the 12-h dark active period. Am-bient temperature was kept constant for any particular 24-h day, varying between 22 and 27 °C on different days. Increases in BAT temperature (>0.5 °C) occurred in an irregular episodic manner every 94ⴞ43 min (meanⴞSD). Varying the temperature over a wider range (18 –30 °C) on different days did not change the periodicity, and neither body nor brain temperature fell be-fore BAT temperature episodic increases. These increases are thus unlikely to reflect thermoregulatory homeostasis. Episodic BAT thermogenesis still occurred in food-deprived rats. Behav-ioral activity, arterial pressure (18ⴞ5 mmHg every 98ⴞ49 min) and heart rate (86ⴞ31 beats/min) increased approximately 3 min before each increase in BAT temperature. Increases in BAT temperature (1.1ⴞ0.4 °C) were larger than corresponding in-creases in brain (0.8ⴞ0.4 °C) and body (0.6ⴞ0.3 °C) temperature and the BAT episodes commenced 2–3 min before body and brain episodes, suggesting that BAT thermogenesis warms body and brain. Hippocampal 5– 8 Hz theta rhythm, indicating active engagement with the environment, increased before the behavioral and autonomic events, suggesting coordination by brain central command as part of the 1–2 h ultradian basic rest-activity cycle (BRAC) proposed by Kleitman. © 2009 IBRO. Published by Elsevier Ltd. All rights reserved.
Key words: thermoregulation, temperature, sleep, hippocam-pal theta rhythm, arterial blood pressure, wavelet mathematics.
The amplitude of a number of behavioral and autonomic variables suddenly increases in an irregular episodic man-ner approximately every 1–2 h during the waking phase of the circadian cycle. Since these episodes recur at intervals of less than 24 h they are defined as ultradian events. Although aperiodic in the strictest sense, such events are classified as rhythms, along with circadian (approximately 24 h) and infradian (⬎24 h) rhythms (Aschoff and Pohl, 1970; Lavie, 1985, 1991; Lloyd and Stupfel, 1991). Vari-ables that exhibit ultradian rhythmicity include behavioral activity, arterial pressure (AP) and heart rate (HR), as well as brown adipose tissue (BAT), body and brain tempera-tures and metabolic rate (Aschoff and Pohl, 1970; Honma and Hiroshige, 1978; Shimada and Marsh, 1979; Livnat et al., 1984; Alfödi et al., 1990; Stupfel and Pavely, 1990; Lloyd and Stupfel, 1991; Franken et al., 1992a; Closa et al., 1993; Holstein-Rathlou et al., 1995; Lu et al., 2001; Heldmaier et al., 2004; Baker et al., 2005; Lloyd and Rossi, 2008). The amplitude of the episodic increases in auto-nomic variables is substantial. Brain temperature, for ex-ample, may suddenly increase by as much as 1 °C in rats, with the temperature remaining elevated for approximately 20 –30 min (Franken et al., 1992a,b; Baker et al., 2005). Ultradian variability may therefore be physiologically im-portant. Previous studies have examined the ultradian rhythmicity of sub-combinations of the behavioral and au-tonomic variables, but no synthesis of their overall interre-lationships has emerged, and the origins and biological significance of the episodic increases are presently ob-scure.
BAT thermogenesis is one of the autonomic functions that exhibit ultradian rhythmicity (Closa et al., 1993). BAT, regulated by sympathetic nerves as part of facultative ther-mogenesis, produces heat that contributes substantially to maintenance of body temperature in cold environments in rats (Carey et al., 2003; Cannon and Nedergaard, 2004; Morrison, 2004; Blessing et al., 2006). We hypothesized that ultradian rhythmicity in BAT thermogenesis contrib-utes to similar rhythmicity in body and brain temperatures, independently of the contribution of BAT thermogenesis to thermoregulatory homeostasis. BAT thermogenesis is in-creased during food intake, so that ultradian rhythmicity in BAT temperature could also be related to eating (Rothwell and Stock, 1979; Himms-Hagen, 1995).
Our study was carried out in conscious freely-moving chronically instrumented Sprague–Dawley rats. In the pre-sent paper we report results for the dark active phase of the circadian cycle. By measuring appropriate combina-tions of variables in different experiments, we examined *Corresponding author. Tel:⫹61 8 82044736; fax:⫹61 8 82045931.
E-mail:w.w.blessing@flinders.edu.au(W. W. Blessing).
Abbreviations: AP, arterial pressure; BAT, brown adipose tissue; BRAC, basic rest-activity cycle; DWT, discrete wavelet transforms; EEG, electroencephalograph; HR, heart rate; REM, rapid eye move-ment; SWS, slow wave sleep.
0306-4522/09 $ - see front matter © 2009 IBRO. Published by Elsevier Ltd. All rights reserved. doi:10.1016/j.neuroscience.2009.08.013
phase-relationships between ultradian rhythms in behav-ioral activity, AP and HR, as well as BAT, brain and body temperature. We examined the effect on BAT ultradian rhythmicity of varying the ambient environmental temper-ature (18 –30 °C) on different experimental days, with tem-perature remaining constant for the 24 h of a given exper-imental day. By measuring brain and body temperatures just before the onset of each episodic increase in BAT temperature, we further investigated whether falls in body/ brain temperature could be thermoregulatory triggers for the episodic BAT temperature increases. We measured thermoregulatory blood flow in the tail artery to assess the contribution of heat dissipation to the episodic temperature changes. We also determined whether ultradian rhythmic-ity in BAT temperature depends on food intake.
Finally we tested the hypothesis that brain central com-mand coordinates the ultradian rhythmicity in all these somatic and autonomic variables. We examined the rela-tionship between ultradian rhythmicity in BAT temperature and the power of theta rhythm (5– 8 Hz) in the simultaneously recorded hippocampal electroencephalograph (EEG), an in-dex of vigilance and active engagement with the environment (Sainsbury et al., 1987; Chrobak and Buzsáki, 1996; Vertes et al., 2004). Our studies suggest that BAT thermogenesis, triggered by brain central command, heats the brain and the body during the episodic increases in vigilance and behavioral activity that occur as part of the 1–2 h basic rest-activity cycle (BRAC) proposed byKleitman (1982).
EXPERIMENTAL PROCEDURES
Animals
All experiments (Sprague–Dawley rats, 200 – 450 g) were conducted at Flinders University and the University of Indiana (male rats) and at Monash University (female rats) in accordance with the European Community Council Directive of 24 November, 1986 (86/609/EEC), the Animal Welfare Committee of Flinders University, the Monash University School of Biomedical Science Animal Ethics Committee, and the Institutional Animal Care and Use Committee of the Indiana University School of Medicine. The number of animals and their suffering was minimized. Animals were instrumented under general anesthesia (2% isoflurane in O2, Veterinary Companies of Australia Pty. Ltd., NSW) or with 80 mg/kg ketamine (Parnell Laboratories Aust Pty Ltd, Silverdale, NSW, Australia) and 11.5 mg/kg xylazine (Ilium, Troy Laboratories Pty Ltd, Smithfield, NSW, Australia) i.p., supple-mented as required. Analgesia (Carprofen, Pfizer Pty Ltd, West Ryde, NSW, Australia, 0.1 ml s.c.) and antibiotics (Baytril, Bayer Aust Ltd, Pymble, NSW, Australia, 0.1 ml s.c.) were administered, and animals returned to the animal house for at least 1 week before experiments were carried out.
Ambient temperature and recording conditions
During experiments rats were kept in quiet environments, ually caged away from other rats (Flinders University) or individ-ually caged in the presence of other rats (Indiana University and Monash University), with minimal human intrusions. Standard food and water were availablead libitum, except for one experi-ment (see below) in which rats had access to water but not to food. Ambient temperature was maintained at a constant 24 h daily level, with variation between 18 and 30 °C on different days.
Measurement of BAT, body and brain temperature, HR, and hippocampal EEG (Flinders University)
In the first series of experiments (lights on 0700 h, lights off 1900 h, daily ambient temperature constant over 24 h) BAT tem-perature was measured with a telemetric probe (TA-F40 W/TP, Data Sciences International (DSI) Transoma Medical, St. Paul, MN). The tip of the temperature probe was positioned between and just ventral to interscapular BAT, near Sulzer’s vein. The transmitter body of the telemetry probe was placed in the perito-neal cavity or subcutaneously. The telemetered temperature signal was detected with a PhysioTel Receiver (RLA1020, DSI) and con-verted to an analog voltage signal with a frequency-voltage converter (# 273– 0016, DSI). The converted signals were digitized (1 Hz) with an analog/digital converter (MacLab/8 s, ADInstruments, Bella Vista, NSW, Australia) and recorded with Chart (ADInstruments) data capturing software. Body temperature was measured (1 sample per min) via a SubCue temperature probe (SubCue Dataloggers, Calgary, AB, Canada) positioned in the peritoneal cavity. Insu-lated wires from the two-pin connector on the SubCue probe were connected to a head socket (see below), so that the probe could be reset after downloading the data in each experiment, without removal from the rat. In these rats tail artery blood flow was also measured by a Doppler ultrasonic probe (Iowa Doppler Products, Iowa City, USA) chronically implanted around the base of the tail artery, with wires from the probe passing s.c. to the head piece, and with signal analysis (40 Hz sampling rate) as previously described (Garcia et al., 2001; Rusyniak et al., 2008).
In a second series of rats studied at Flinders University (lights on 1900, lights off 0700, daily ambient temperature constant over 24 h), BAT, body and brain temperatures were simultaneously measured with thermistor probes and recorded with MacLab/8 s (1 Hz sampling rate). In four of these rats we also recorded the electrocardiograph (ECG) via chronically implanted sternal elec-trodes (TA11 CTA-F40, DSI). Temperature probes were made from thermistors (10 k⍀, beta⫽3380 at 25 °C, NTH5G10P, Mu-rata, Kyoto, Japan, size 2⫻1⫻1 mm after silicone cover) and with an integrated-thermo sensor (LM35, National Semiconductor, Santa Clara, CA, USA, 6⫻6⫻4 mm). Probes were sealed with silicone (RTV 3–1744, Dow Corning, Midland, MI, USA), and calibrated with a linear thermometer at multi-points (every 2 °C from 31 to 41 °C) beforehand. In each rat the temperature probes were positioned in BAT (see above), intracranially, via craniotomy, in a dorsal extradural position near the confluence of the sagittal and transverse sinuses, and in the peritoneal cavity. Wires from the temperature probes (and ECG electrodes) were attached to the head socket and the signals were collected with a bridge amplifier (Biomedical Engineering, Flinders University). In five rats from this second series we removed food from the cage for the 12-h lights on period and for the next 12-h lights off period. These rats had continuous access to water.
headpiece through a flexible Teflon-insulated stainless steel wire and fixed with dental cement. EEG signals were fed through a voltage-buffer preamplifier (Biomedical Engineering, Flinders Uni-versity) to a bridge amplifier/filter unit (ML112, ADInstruments) via a swivel cable. The signals were filtered (0.1–100 Hz band pass) with the ML112 bulletin filter and digitalized (200 Hz) with MacLab/8 s. Signals were recorded with Chart software.
Before experimental use, each rat was suddenly transferred to a cold (5–10 °C) environment and only animals showing at least 0.5 °C increase in BAT temperature were used in subsequent experiments. We have previously established that this procedure validates correct position and function of the probe in interscapular BAT (Blessing et al., 2006).
Arterial pressure, heart rate and behavioral activity (Indiana University)
In male rats (reversed light-dark cycle), AP, HR and behavioral activity were measured using a telemetric transmitter (model TA11PA-PXT50; DSI). The flexible catheter of the telemetric transmitter was implanted in the abdominal aorta via the right femoral artery. The transmitter body was placed in the abdominal cavity and sutured to the abdominal wall. Rats were housed in individual cages and allowed to recover from surgery for at least 7 days. Sampling rate was 1 per min. Behavioral activity (arbitrary units) was measured by variations in the amplitude of the teleme-tered signal as the rat moved around the cage. We did not directly monitor specific behaviors such as eating or drinking.
Measurement of BAT temperature and behavioral activity (Monash University)
The tip of a BAT temperature probe was positioned in BAT as for the first series of animals studied at Flinders University. The transmitter body of the telemetry probe was placed subcutane-ously. Activity was measured by variations in the amplitude of the telemetered signal. The telemetered BAT temperature and behav-ioral activity signals were transmitted via a BCM-100 consolidation matrix to a computerized data acquisition system (Dataquest IV, DSI). Sampling rate was 1 per 2.5 min. Rats (female) were housed in single cages next to the cages of other female rats (lights off 1000 h, lights on 2200 h).
Wavelet-based analysis of physiological records containing ultradian variability
Ultradian episodes in different physiological variables often occur irregularly, sometimes with small amplitude changes that make it difficult to identify physiologically meaningful increases (Aschoff and Pohl, 1970; Lavie, 1985, 1991; Lloyd and Stupfel, 1991; Stupfel et al., 1995; Lloyd and Rossi, 2008). Wavelet-based mathematical proce-dures (Graps, 1995) analyse different segments of a signal at appro-priately different temporal resolutions, closely fitting original signals that exhibit substantial variability in peak amplitude and inter-peak intervals. We used wavelet-based procedures to fit and smooth the original signals (see below). For increases in BAT temperature or AP to be counted as episodes, we specified the amplitude increases to be at least 0.5 °C and 10 mmHg, respectively, and intervals between episodes to be at least 35 min. To assess the effect of the threshold amplitude chosen to define an episodic increase in BAT temperature, we repeated the analysis with minimum threshold increasing in 0.05 °C steps from 0.5 to 1.0 °C.
Original ADInstrument Chart files were exported to IgorPro (WaveMetrics, Lake Oswego, OR, USA,http://www.wavemetrics. com). Discrete wavelet transforms (DWT function, IgorPro) were performed on all raw signals. The DWT function performs the forward wavelet transform, and outputs transform-coefficients. It then zeros all transform-coefficients whose magnitude falls below 10% of the maximum magnitude of the transform, and then
per-forms the inverse transform of coefficients. After the DWT func-tion, signals were further processed to remove DC components and slow drift/fluctuations with a cycle longer than 12 h. Positive peaks in smoothed BAT temperature signals were identified by analyzing the first and second derivatives of the signals and detecting inflection points (FindPeaks function in IgorPro). The onset of each BAT temperature increase was specified as the time of the first minimum value preceding the peak. DWT functions of simultaneously recorded body temperature, brain temperature (⬎0.2 °C), and behavioral activity were then searched for peaks occurring within⫾20 min of a given BAT temperature peak.
Peaks in AP were identified using the DWT procedure (as for BAT temperature peaks, see above). Corresponding peaks in HR (derived from the AP trace, minimum rate increase of 20 beats/ min) and in behavioral activity were identified within⫾20 min of a given AP peak. AP and HR signals have a higher frequency response than temperature signals. We calculated duration of AP episodes as the time between the first minimum in the 25 min period before a peak (onset time) and the first minimum in the 25 min after a peak (end time). The time between a given end time and the next onset time was measured as an indication of the time between episodic increases in AP.
Analysis of hippocampal EEG and its relationship to episodic increases in BAT temperature
Epochs (10.24 s) of EEG were smoothed with a Hamming window, and the magnitude of the FFT was obtained. Power in the 5– 8 Hz theta band was expressed as a percentage of total (1–20 Hz) power for each 1 min bin. We selected 60 min segments of BAT tempera-ture records, each commencing 20 min before and concluding 40 min after the onset of each episodic increase in BAT temperature. Corresponding segments of hippocampal EEG were identified. Paired BAT temperature and hippocampal EEG theta power propor-tion signals were cross correlated (IgorPro correlapropor-tion funcpropor-tion). We also examined the time relationship between hippocampal theta proportion and BAT temperature by calculating the mean value of each 1 min time point in each 60 min segment, and determining the time difference between onset of the increase in BAT temperature and onset of the increase in the proportion of theta power.
Statistical analysis
Group results were analysed with Statview (SAS Institute, Carey, NC, USA), with mean⫾SD used for descriptive statistics and mean⫾SE for inferential statistics. Student’st-test, and factorial and repeated measures analysis of variance (ANOVA) were used, with post-hoc comparison with Fisher’s protectedt-test, with the significance level of the primary ANOVA set at the 0.05 level. Linear regression, Pearson correlation, and cross correlation (Igor Pro) were used to quantify relationships between different signals.
RESULTS
We observed animals throughout both the 12-h light and the 12-h dark segments of the 24-h day, but we report only results obtained during the lights-off dark period, the time when the rat, as a nocturnal animal, is more likely to be awake and active. Ambient temperature was kept constant during any individual 24-h period.
Periodicity of variations in BAT temperature
BAT temperature increased episodically in association with increases in body and brain temperature. With the threshold amplitude set at 0.5 °C and the ambient temperature 22– 27 °C (constant over 24 h), episodes of BAT thermogenesis occurred every 94⫾43 min (range 35–272 min), amplitude 1.1⫾0.4 °C and time from onset to peak 34⫾17 min (mean⫾SD of 532 episodes in 40 rats). Varying the ambient temperature between 18 and 30 °C on different days had no effect on BAT temperature peak interval (regression
F1,199⫽1.29, P⬎0.05), a significant but small effect on
BAT temperature peak amplitude (regression F1,221⫽ 47.12,P⬍0.0001,R2
⫽0.18), and no effect on baseline body temperature measured at the onset of episodic increases (regressionF1,187⫽1.15,P⬎0.05).
Frequency distributions of peak intervals and amplitudes for the 0.5 °C threshold definition are shown inFig. 2A, Band the distribution of peak intervals for a 1.0 °C threshold defi-nition are shown inFig. 2C. As the threshold amplitude for definition of an episode is increased in 0.05 °C steps from 0.50 to 1.0 °C, the peak interval gradually increases (Fig. 2D). 39
38
37
36
100 min 39
38
37
36 38
37
36
37
36
100 min
BAT temp
(°C)
Brain temp
(°C)
Rat M854_210708
Body temp
(°C)
Rat M854_220708_No Food
BAT temp
(°C)
39
38
37
40
20
0 37
36
100 min
BAT temp
(°C)
Body temp
(°C)
Tail artery
Doppler flow signal (cm/s)
Rat M706_120807
dark
dark
dark dark
A
B
C
Relationship of brain and body temperature increases to BAT temperature increases
In rats in which BAT, brain and body temperatures were measured simultaneously, all three temperature probes were similarly constructed, and the sampling rate was 1 Hz. Thus the temperature signals could be closely com-pared in these animals. We calculated the mean BAT, brain and body temperatures for each rat for the 10 min periods before and after the onset time of each episodic increase in BAT temperature. Ambient temperature was 22–27 °C, constant on any particular day. Results are shown in Fig. 3A where it is clear that brain and body temperatures were at a stable baseline level preceding the onset of episodic increases in BAT temperature. There were no falls in brain or body temperature just before the increases in BAT temperature. Indeed, analysis of corre-sponding episodic onset times showed that BAT temper-ature started to increase 2.3⫾0.62 min before brain tem-perature (mean⫾SE, paired t191⫽3.71, P⬍0.001), and 3.0⫾0.9 min before body temperature (mean⫾SE, paired t187⫽3.35,P⬍0.001). The increases in BAT temperature were greater than the corresponding increases in brain and body temperatures (1.1⫾0.4 °C, 0.8⫾0.4 and 0.6⫾0.3 respectively mean⫾SE), with significant and substantial linear regression between corresponding increases in BAT and brain temperatures, and BAT and body temperatures (Fig. 3B, C). The mean correlation between dark period BAT and brain temperature signals was 0.9⫾0.1, and
be-tween BAT and body temperature signals the mean corre-lation was 0.7⫾0.2 (mean⫾SD, 18 dark periods in 13 rats).
Tail artery blood flow
During the onset and initial stages of the bursts in BAT thermogenesis the tail artery vascular bed was constricted (Fig. 1C, bottom trace). Tail artery vasodilatation occurred abruptly 15⫾1 min (mean⫾SE) after onset of each BAT temperature increase, with resumption of tail vasoconstric-tion 7⫾1 min (mean⫾SE) after the peak of each BAT temperature increase.
BAT temperature, behavioral activity, AP and HR
The DSI probe (see Methods) measures general behav-ioral activity as a function of variations in the strength of the telemetered signal as the animal moves towards and away from the signal detector. Most episodes of BAT thermo-genesis occurred together with an increase in behavioral activity measured in this manner (Fig. 4A). Comparison of onset times of corresponding episodic increases in activity and BAT temperature in the DWT traces showed that activity commenced 3⫾1 min before BAT temperature increases (mean⫾SE, paired t212⫽3.75,P⬍0.001). The mean maxi-mum correlation between the two signals was 0.8⫾0.02 (mean⫾SE,n⫽25 records in 14 rats).
As shown inFig. 4B, both AP and HR exhibited peri-odic increases in amplitude (18⫾5 mmHg and 86⫾31 beats/min, mean⫾SD, n⫽161 peaks in 10 rats), with a Fig. 2. (A), (B) Frequency distributions of time between peak of episodic increases in BAT temperature at threshold amplitude 0.5 °C, and of amplitudes of the peaks at this threshold. (C) Frequency distributions of peak intervals at threshold amplitude 1.0 °C. (D) BAT peak intervals (mean⫾SD) with threshold amplitudes increasing in 0.05 °C steps from 0.50 to 1.0 °C. Linear regression between threshold amplitude and peak intervals for all dark period peaks in all rats at ambient temperature 22–27 °C was significant (F1,4295⫽161.6,P⬍0.0001), but the relationship was not strong (R2
mean AP peak interval of 98⫾49 min (mean⫾SD,n⫽156 peaks in 10 rats). The distribution of AP peak interval times and amplitudes is shown inFig. 5A, B. Cross correlation
between AP and HR traces for the dark period showed no significant time delays between the signals, with a corre-lation of 0.9⫾0.04 (mean⫾SD, n⫽22 traces in 10 rats). Regression between the amplitudes of corresponding in-creases in AP and HR was also significant (regression
F1,157⫽126.5,P⬍0.0001,R2
⫽0.45).
Peaks in AP and HR occurred in close relationship to peaks in behavioral activity (Fig. 4B). Cross correlation showed no significant time delays in AP and activity sig-nals. The correlation between the signals was 0.6⫾0.13 (mean⫾SD,n⫽22 signal traces in 10 rats). In separate rats (n⫽4) in which HR and body temperature were mea-sured simultaneously (1 Hz), onset of increases in HR occurred approximately 7⫾2 min before the onset of the corresponding increase in body temperature (mean⫾SE, paired t29⫽3.14, P⬍0.001 versus zero delay), and this indicates that the increases in HR (and by implication the increases in AP) occur approximately 4 min before each corresponding increase in BAT temperature.
If the AP signal was oscillatory in the conventional sense, the time between end of one episode and onset of the next episode (off-time) should be close to zero. Zero values did occur (seeFig. 4B), but the mean⫾SD of the off-times was 34⫾42 min (150 episodic increases in AP), documenting that intervals between episodes of increased AP occupy approximately one-third of the total dark period time, and that sudden increases in AP may occur from a reasonably stable baseline.
Effect of lack of access to food on episodic increases in BAT temperature
Episodic increases in BAT temperature also occurred in rats without food for a 24-h period (Fig. 1B). The interpeak interval was reduced (70⫾4 min without food versus 86⫾3 min with food, F1,244⫽7.01, P⬍0.01). The amplitude of episodic increases in BAT temperature was also slightly reduced (0.93⫾0.1 °C without food versus 1.10⫾0.03 °C with food,F1,252⫽5.90,P⬍0.02).
BAT temperature and theta (5– 8 Hz) power in the hippocampal EEG
BAT temperature and hippocampal EEG signals were si-multaneously measured in a series of rats. The proportion of theta rhythm power (5– 8 Hz) in the hippocampal EEG was expressed as 1 min averages as shown inFig. 6A. Episodic increases in BAT temperature, and their onset times, were identified as described in Methods. We se-lected 60 min segments of the BAT record (20 min before onset and 40 min after onset of a BAT temperature in-crease), together with the EEG theta power proportions for the same time periods. An example of a cross correlation of 1 min BAT temperature and EEG theta proportion sig-nals is shown in Fig. 6B. In this example the highest correlation (0.92) occurs when the BAT signal is advanced in time by 5 min. Group results showed that an increase in EEG theta power preceded the episodic increases in BAT temperature by 6.3⫾0.6 min (mean⫾SE, t44⫽11.1, P⬍ Fig. 3. (A) Body and brain temperatures for the 10 min periods before
0.0001 versus zero time difference). After adjustment for the time difference the correlation between the BAT and the EEG theta power signals was 0.6⫾0.2 (mean⫾SD,
n⫽45 segments in eight rats). As can be seen inFig. 6C, the onset of the increase in mean EEG theta power signal preceded the onset of the increase in mean BAT temper-ature by about 4 –5 min, in reasonably close agreement with the delay determined by cross-correlation of individual signals.
The position of hippocampal EEG recording electrodes was confirmed by post-mortem histological analysis in each rat, with appropriate localization as shown inFig. 7.
DISCUSSION
Our study confirms and substantially extends the previous report of an ultradian rhythm in BAT temperature (Closa et al., 1993). Episodic increases in BAT temperature were of greater amplitude than the corresponding increases in
body temperature, even though blood flowing to BAT in-creases during the episodic inin-creases (Closa et al., 1993). In anesthetized rats, changes in BAT temperature are associated with corresponding changes in BAT sympa-thetic nerve discharge (Morrison, 2004; Nakamura and Morrison, 2008; Rusyniak et al., 2008). We thus consider it reasonable to assume that the episodic increases in BAT temperature observed in our study reflect increases in BAT metabolic thermogenesis. BAT can increase its metabolic rate many times, so that, although the tissue constitutes only about 1% of body weight, increases in BAT metabo-lism can substantially increase whole body metabolic rate (Cannon and Nedergaard, 2004). Thus increases in BAT metabolism could contribute substantially to the well-doc-umented ultradian rhythmicity in whole body metabolic rate in rats during the dark active phase of the circadian cycle (Stupfel and Paverly, 1990; Stupfel et al., 1995). Charac-teristics of the ultradian rhythm in BAT thermogenesis are described later in the Discussion section.
39
38
37
36
35
100 min
140
120
100
500
400
300
100 min
BAT temp
(°C)
Activity
HR
(beats/min)
AP
(mm Hg)
Activity
Rat X10_300108
Rat PXT_32322
dark
dark
A
B
The brain initiates and coordinates episodic
increases in behavioral activity, BAT thermogenesis, AP and HR
We demonstrate, for the first time, that episodic increases in BAT, brain and body temperature are phase-linked with episodic increases in behavioral activity, AP and HR. The episodic increases in BAT temperature were preceded by increases in hippocampal theta (5– 8 Hz) power. Hippocam-pal theta rhythm is a recognized marker for vigilance and active engagement with the environment (Bland, 1986; Sainsbury et al., 1987; Chrobak and Buzsáki, 1996; Vertes et al., 2004). After correction for the time difference, hippocam-pal EEG and BAT temperature signals were highly positively correlated during individual episodic increases in BAT tem-perature. Thus our results confirm our hypothesis that brain central command initiates and coordinates all the phase-linked episodic somatic and autonomic processes as part of the animal’s episodic active engagement with the environ-ment. Other investigators have demonstrated episodic occur-rence and phase-linking of different combinations of the pro-cesses we measured, but we believe that our study provides the first experimental evidence that they are all phase-linked by brain central command.
Ultradian rhythms in body and brain temperature are more obvious after lesions of the suprachiasmatic nucleus that abolish circadian rhythms (Baker et al., 2005; Fuller et al., 2008), so that ultradian rhythms must be determined by other brain regions. At present these regions and the
pre-sumed gene-regulated clock mechanisms that generate the phase-linked ultradian rhythmicity are unknown. Hip-pocampal theta rhythm and the sleep/wake cycle reflect complex forebrain events that are influenced by brainstem, hypothalamic and basal forebrain neural circuits (Kapás et al., 1996; Chrobak and Buzsáki, 1996; Vertes et al., 2004; Saper et al., 2005). Perhaps these circuits also control phase-linked ultradian rhythmicity in autonomic and be-havioral variables, including BAT thermogenesis. De-scending neural pathways to the relevant spinal sympa-thetic outflows controlling BAT thermogenesis relay in the hypothalamus and in the raphe/parapyramidal region of the medulla oblongata (Bamshad et al., 1999; Oldfield et al., 2002; Cano et al., 2003; Morrison, 2004).
The precise sequence of brain-coordinated somatic and autonomic events needs further investigation. The exact on-set of episodic behavioral activity is often difficult to specify and in our study the sampling rate for activity was only 1 per 2.5 min. The delay between increase in theta power and onset of the increase in BAT temperature may partially reflect the slow frequency response of the temperature signal. It is unlikely that the delay indicates that episodic BAT thermo-genesis is principally controlled by adrenal catecholamine secretion because there are 80 –90 min ultradian peaks in plasma noradrenaline in rats, without corresponding peaks in plasma adrenaline (Tapp et al., 1981).
Episodic increases in BAT temperature are unlikely to reflect a homeostatic thermoregulatory process
In conscious rats, sudden transfer to a cold environment triggers vigorous BAT thermogenesis within minutes ( Bless-ing et al., 2006). Thus, as part of thermoregulatory homeosta-sis in conscious rats, ultradian increases in BAT thermogen-esis could be triggered by falls in skin/body/brain tempera-ture. However in our study there was no fall in either body or brain temperature just before each episodic increase in BAT temperature. Moreover when we varied the 24 h ambient temperature between 18 and 30 °C (constant during a par-ticular day) there was no change in the periodicity of BAT thermogenesis and no change in the body temperature at the onset of each episode. Although the ambient environmental temperature was varied on different days, it was kept con-stant for the 24 h period on any particular day, so that skin temperature receptors should not have been activated by changes in ambient temperature. Thus episodes of BAT ther-mogenesis are unlikely to be triggered by feedback from thermoreceptors as part of thermoregulatory homeostasis. Similarly, as also noted byShimada and Marsh (1979), epi-sodic coupled increases in AP and HR (with a positive 0.9 correlation in our study) are unlikely to reflect activation of peripheral baroreceptors as part of arterial pressure ho-meostasis. Baroreceptor activation by increases in AP should cause a bradycardia.
Preoptic neurons may have altered thermosensitivity during wakefulness as compared to sleep (Parmeggiani et al., 1986; Baker et al., 2005; Szymusiak and McGinty, 2008), so that BAT thermogenesis could be activated at the beginning of an active wakeful period at the ambient temperature that was previously ineffective in activating Fig. 5.Frequency distributions of peak intervals (A) and amplitudes