Valter Pires Fernandes
Licenciatura em Ciências de Engenharia Biomédica
Development of an equipment to detect
and quantify muscular spasticity
Dissertação para obtenção do Grau de Mestre em
Engenharia Biomédica
Development of an equipment to detect and quantify muscular spasticity
Copyright © Valter Pires Fernandes, Faculdade de Ciências e Tecnologia, Universidade Nova de Lisboa.
i
AKNOWLEDGEMENTSTo my Coordinator, Pedro Vieira, for the amazing patience he showed and for believing in my potential during this project. Also to my second coordinator, Cláudia Quaresma, for the sensitivity that resulted into tremendously valuable inputs to this project. To you both, a respectful thank you.
I’d like to respectfully thank Centro de Medicina de Reabilitação de Alcoitão and all the
personal involved in spastic evaluation and treatments for the time and interest they presented in giving us such a valuable perspective as their perspective as physicians and possible future users of this kind of equipment.
I’d also like to thank NGNS - Ingenious solutions, LDA for all the help, engineering
knowledge, work space and tools provided that made this work possible.
Thanks to all those that can be truly called professors that crossed path with me and shared their knowledge with me.
I thank my family for the thrust and the support during this project, the remaining years on university and my life as a whole. Without them none of this wonderful and exciting life experience would have been possible.
A special “thank you” to a special person that will never be forgotten and that was the main
reason for these years being so remarkably great to me. I’m proud of having shared all this with
you. You’ll always be special to me no matter what.
A big thanks to all my friends that not only lived all the good moments with me but also endured the bad ones by my side.
Finally, I’d like to thank and encourage all the academic spirit supporters like me that every
year work so hard to make out of it not simply an image but a life style and something that we can all be proud of. That work shall never be in vain and maybe one day we will be able to make others see it as the good thing it is.
iii
ABSTRACTSpasticity consists of a muscular tonus alteration caused by a flawed central nervous system which results in a hypertonic phenomenon. The presence of spasticity is normally noticeable by
the appearance of a denoted velocity dependent “rigidity” throughout the passive mobilization of
an affected limb which can be a potential source of constraints in subject independency by negatively affecting the accomplishment of daily basic tasks.
Spasticity treatment usually comprises high cost methods and materials. There is also a strict relation between the spasticity grade and the dose that has to be applied to attain the desired effective result. These two facts justify the need for a more precise equipment to detect and quantify muscular spasticity.
In the present days, three main groups of spasticity quantification methods coexist: the clinical scales, electrophysiological measurements and the biomechanical measurements. The most used ones are the clinical scales, especially the Modified Ashworth Scale. These scales quantify spasticity based on the perception of muscular response sensed by an operator. In a different field of approach, many instruments have been built to quantify biomechanical magnitudes that have shown direct relation with spasticity. Unfortunately, most of these instruments had either inappropriate size for clinical use, weak result correlation both inter and intra-subject, or a noticeable result dependence on the operator.
The objective of this project was to create a reliable method for spasticity detection and quantification that could: be of easy and fast application, have no need for a specialized operator, be portable and present good repeatability and independency from the operator in the produced
results. The resulting prototype, named SpastiMed, is a motorized and electronically controlled
device which through analysis of the produced signal presented irrefutable proof of its capacity to detect and possibly quantify spasticity while gathering the important characteristics mentioned.
Keywords: Biomedical Engineering, Medical device, Biomechanics, Muscular tonus,
v
RESUMOA espasticidade é um fenómeno de hipertonia muscular causada por um funcionamento incorreto do sistema nervoso central. É normalmente percetível, aquando da mobilização passiva do membro afetado, pelo aparecimento de uma “rigidez” dependente da velocidade. A espasticidade pode afetar negativamente a vida do doente, comprometendo a sua independência, ao dificultar ou impossibilitar o desempenho de tarefas básicas.
A necessidade de um aparelho mais preciso na deteção e quantificação da espasticidade é justificada pelo facto de o tratamento da espasticidade compreender tratamentos de elevado custo e pela estreita relação de dependência entre o grau de espasticidade presente no músculo que se pretende tratar e a dose e efetividade resultante do tratamento a aplicar.
Para efeitos de quantificação existem atualmente 3 classes de métodos: escalas clínicas, medições eletrofisiológicas e medições biomecânicas. O método mais utilizado são as escalas clínicas, com especial relevância para a Modified Ashworth Scale, que tem como base a perceção, por parte do operador, da resposta muscular aquando da mobilização passiva do membro. Paralelamente, no plano da quantificação de grandezas biomecânicas como potenciais quantificadores de espasticidade, tem-se verificado o aparecimento de vários instrumentos desenvolvidos. Infelizmente, a maioria, peca pelas dimensões pouco apropriadas ao ambiente clínico, pela fraca correlação de resultados inter ou intra-doente, ou pela dependência dos resultados gerados para com o operador do instrumento.
O objetivo deste projeto era criar um método fiável na deteção e gradação da espasticidade fácil e rápido de aplicar, que não necessite de um operador especializado, seja transportável e que apresente uma boa reprodutibilidade e independência do operador nos resultados produzidos. O protótipo desenvolvido, apelidado de SpastiMed, é um dispositivo motorizado e eletronicamente controlado. Através da análise do sinal por este produzido foram obtidas provas da capacidade para detetar e possivelmente quantificar espasticidade muscular sem abdicar das características chave referidas anteriormente.
Palavras-Chave: Engenharia Biomédica, Dispositivos médicos, Biomecânica, Tónus
vii
TABLE OF CONTENTSAKNOWLEDGEMENTS ……….. i
ABSTRACT ………. iii
RESUMO ……… v
FIGURE INDEX ……….. xi
TABLE INDEX ……… xiii
SYMBOLS AND NOTATIONS ……… xv
INTRODUCTION ………... 1
1. THEORETICAL STUDY AND STATE OF THE ART ………..... 3
1.1 Spasticity ……….… 3
1.1.1 Clinic and etymologic definition ……… 3
1.1.2 Epidemiology and impact ……….. 3
1.1.3 Treatments ……….. 4
1.2 Spasticity assessment methods ……… 5
1.2.1 Clinical Scales ……….. 5
1.2.2 Electrophysiological measurements ………. 7
1.2.3 Biomechanical measurements ……….. 7
1.2.3.1 Spasticity Measurement System …………… 9
1.2.3.2 On-line spasticity measurement system …….………..….. 9
1.2.3.3 Portable system with force transducer ……… 10
1.2.3.4 Portable Spasticity Assessment Device ….……… 10
1.2.3.5 MyotonometerTM ……….………..………. 11
1.2.3.6 Isokinetic Dynamometers (Biodex multi-joint SystemTM and Kincom 500H) ………..………..……….. 11
1.2.3.7 Instrument developed by Inês Clemente–“The Glove” …..……… 13
viii
2. BUILDING AND DEVELOPING SPASTIMED ……… 15
2.1 Mechanical Part ………..……….. 16
2.1.1 Introductory considerations ……… 16
2.1.2 Conic Gears ……….………. 17
2.1.3 Motor ……….……….. 18
2.1.4 Metallic parts ……….. 19
2.2 Electronics ………..……….. 20
2.2.1 Current Sensor ………...……….. 20
2.2.2 Angular position Sensor ……….………. 22
2.2.3 Safety switches ………. 23
2.2.4 Motor Control driver ……….………...………. 23
2.2.4.1 Motor velocity control ………..……….. 24
2.2.4.2 Control of the direction of rotation of the motor ………. 25
2.2.5 Microcontroller ………..………. 26
2.2.5.1 Choosing an appropriate sampling rate for data acquisition ..……. 26
2.2.5.2 Communication with the LabVIEW® interface ……….……. 26
2.2.5.2.1 Communication from the microcontroller to the LabVIEW® interface ……….. 26
2.2.5.2.2 Communication from the LabVIEW® interface to the microcontroller ……… 27
2.2.5.3 Analogic Signal Acquisition ……….……. 29
2.2.5.4 Push buttons actions ………..……….. 30
2.2.5.5 Motor control ……….. 30
2.2.5.6 Microcontroller programming ……….………. 32
2.3 LabVIEW® Interface ……….……… 33
2.3.1 Graphical User Interface ……….………. 33
2.3.2 Communication configuration ……….……… 33
2.3.3 Interpretation of the received data ……….………. 34
2.3.3.1 Angular position value ………..……… 34
ix
3. SPASTIMED ASSESSMENT ROUTINE ……….……… 37
3.1 Pre-Calibration process ……….……….. 37
3.2 R.O.M definition Routine ………..………... 38
3.3 Data Acquisition Routine ………..……… 38
4. RESULTS ……….……… 39
4.1 Obtained signals ……….……….. 39
4.1.1 Unloaded Device ……….………..………... 39
4.1.2 Healthy relaxed subject arm ………...………. 40
4.1.3 Healthy subject arm inducing opposing force ……….……….. 41
4.1.4 Spastic subjects arms ……….………. 42
4.2 Signal analysis ………..……… 43
5. CONCLUSIONS AND FUTURE DEVELOPMENTS ……….………. 45
5.1 Prototype Improvements ……….. 46
5.2 Future Perspectives ……….. 48
6. REFERENCES ……….……… 51
xi
FIGURE INDEXFigure 1.1– Subjects that present spasticity in flexor muscles around the elbow and the
wrist junctions [25,26]. ………..… 3
Figure 1.2 – SMS – Spasticity Measurement System – Explanatory scheme of the
measuring equipment [17]. ……… 9
Figure 1.3– Mechanical structure of the On-line spasticity measurement system. The
arrows indicate the possible adjustments that can be made to the motor position [15]. …. 9
Figure 1.4– Scheme of the portable system with a force transducer [7]. ………. 10 Figure 1.5– Portable Spasticity Assessment Device scheme [18]. ……….….. 11
Figure 1.6 – BIODEX MULTI-JOINT SYSTEM–PRO [21] used in the study made by
Supraja e Singh [10]. ……….. 12
Figure 1.7 – KinCom 500H [13, 22-24]. ………...……… 12 Figure 1.8–Spasticity measurement device developed by Inês Clemente[16]. A) Inside view of the glove (plastic water sac inserted between the glove and the yellow tissue). B) Outside view ( (1) back of the hand (2) and palm of the hand) of the Glove when
correctly strapped on an examiner’s hand [16]. ……….. 13 Figure 2.1– Block Diagram representation of the SpastiMed device. …………..……….. 15
Figure 2.2 –Final state of the mechanical part of the SpastiMed device. A) Top View
when attached to a subject arm. B) Side View when attached to a subject arm. C) View of the device without the plastic protective caps. a) DC motor. b) arm metallic part. c) forearm metallic part. d) bigger conic gear. e) smaller conic gear. f) splint parts to help
locking the device in position on top of an arm. ……… 16
Figure 2.3 –Schematic drawing of a cut view of the gears used in the mechanical part
of the SpastiMed. All the specifications, lengths and sizes of the used set of gears can
be found in Table 2.2. ………...………..………. 17
Figure 2.4– Schematic of all the electronics integrated in the SpastiMed device. ….….. 20 Figure 2.5– Schematic of the Current Sensor developed and used in the SpastiMed. … 21 Figure 2.6– Schematic of the Angular position sensor circuit. ……….……… 22 Figure 2.7– Motor consumed current signal when supplying the motor with a 12V Pulse
Width Modulated line. Time scale is in cs. .………...……… 24
Figure 2.8– Schematic of the digitally controlled motor velocity control circuit developed
for SpastiMed. ……….……….. 24
Figure 2.9– Schematic of the circuit used to control the direction of rotation of the motor presented in 2.1.3. ………...………. 25
Figure 2.10 – Block diagram of the “computersaid” function responsible by the
interpretation of the information sent by the LabVIEW®. ……… 28
Figure 2.11 – Block diagram of the “vel_ctrl” function responsible by the control and
adjustment of the motor velocity according to the reference (ANGVEL). ………..……….. 31
Figure 2.12–Block diagram of the “SpastiMed-main-pic” function which works as the “brain” of the device. ………...……….. 32
Figure 2.13– Picture of the LabVIEW® graphical user interface. A –“Calibrate” button.
B – Pre-Calibration movement push-buttons. C – Calibration results. D – Save to file
button. E – Assessment Start/Stop button. F – “Number of Cycles” box. G – Warning
lights panel. H – Angular position plot. I – Consumed current plot. ……… 33
Figure 2.14 – Picture of the LabVIEW® graphical user interface communication
xii
Figure 2.15–Metallic arm with the angular position referential in yellow. …………..…… 34
Figure 2.16– Values acquired to establish a linear relation between the angular position and the ADC values. ………..……….. 35
Figure 3.1 –Explanatory diagram of the SpastiMed routine used to assess and quantify
spasticity. ………..………. 37
Figure 4.1– Consumed current signals (A) obtained from the current sensor circuit with
an unloaded device at A) – 25o/s, B) – 45o/s, C) – 60o/s and D) – 90o/s. The horizontal
axis is displaying the number of acquisitions which can be converted to time (s) by simply
dividing by 100. ……….……… 39
Figure 4.2– Consumed current signals (A) obtained from the current sensor circuit with SpastiMed applied on a healthy and relaxed upper limb mobilized at A) – 25o/s, B) –
45o/s, C) – 60o/s and D) – 90o/s. The horizontal axis is displaying the number of
acquisitions which can be converted to time (s) by simply dividing by 100. ……….… 40
Figure 4.3– Consumed current signals (A) obtained from the current sensor circuit with SpastiMed applied on a healthy upper limb mobilized at A) 25o/s and B) 60o/s. In the
square-boxes, the reaction of the device to a small opposing force is easily noticeable. The horizontal axis is displaying the number of acquisitions which can be converted to
time (s) by simply dividing by 100. ……….……… 41
Figure 4.4– Consumed current signals (A) obtained from the current sensor circuit with SpastiMed applied on a healthy upper limb mobilized at 25o/s. In the square-boxes, the
reaction of the device to intense opposing forces is easily noticeable. The horizontal axis is displaying the number of acquisitions which can be converted to time (s) by simply
dividing by 100. ………..……….……….. 42
Figure 4.5– Consumed current signals (A) obtained from the current sensor circuit with SpastiMedapplied on “Subject A” upper limb mobilized at A) – 45o/s, B) – 90o/s. The
horizontal axis is displaying the number of acquisitions which can be converted to time
(s) by simply dividing by 100. ………..………….……… 42
Figure 4.6– FFT of two signals obtained during extension movements at the velocity of
90o/s with the device: A) unloaded. B) attached to a relaxed healthy upper limb. C) attached to “Subject A” upper limb. ………..….………. 43
Figure 5.1– Custom made upper limb sustentation tool used in Centro de Medicina e Reabilitação de Alcoitão to nullify the effect of gravity in the rehabilitation of some upper
limb movements. ………...……… 47
xiii
TABLES INDEXTable 1.1 – Modified Ashworth Scale used in clinical environment to assess spasticity
[7]. ………. 6
Table 1.2 –Modified Tardieu Scale used in clinical environment to assess spasticity [12]. 6 Table 2.1– Expected mass and length of the different segments of a human upper limb
from a subject with a total mass of 100kg and a total height of 1m [42]. ………..…….. 17
Table 2.2 – Specifications of the set of gears used in the mechanical part of the SpastiMed. All the lengths and sizes in the table are expressed in millimetres and are
related to the ones presented in Figure 2.2 (adapted from [44]). ……….……… 18
Table 2.3 –Specifications from the motor used in SpastiMed’s mechanical part (adapted
from [44]). ……….. 19
Table 2.4– Motor direction control state with the change of the inputs (IN1 and IN2) of
the circuit presented in Figure 2.9. ……….……….. 25
Table 2.5 – Communication code from the microcontroller to the LabVIEW® interface regarding the push of the safety buttons. ……….………. 27
Table 2.6 – Communication code from the microcontroller to the LabVIEW® interface
regarding the acquired sensor data communication. The information sent in byte1 and
byte2 corresponds respectively to the microcontroller’s ADRESH e ADRESL registries. 27
Table 2.7 – Communication code from the microcontroller to the LabVIEW® interface
regarding other types of warnings. ………. 27
Table 2.8 – Communication code from the LabVIEW® interface to the microcontroller
regarding hardware action commands. ………...……….. 29
Table 2.9 – Communication code from the LabVIEW® interface to the microcontroller
regarding the configuration of the motor movement. ………..………. 29
Table 2.9 –Motor motion control macros. ………..……….. 30 Table 5.1 – Achievement table for all of the relevant spasticity assessment methods
presented in CHAPTER 1. regarding the 5 fundamental key-features on a spasticity
assessment device/method. The symbols are explained as follow: - the method fully
possesses the feature; / - the method partially possesses the feature or presents small flaws and/or limitations either for scientific or clinical use; - the method does not
possess the feature; ? – not enough information to conclude if the method possesses
xv
SYMBOLS AND NOTATIONSCNS Central Nervous System
MAS Modified Ashworth Scale
MTS Modified Tardieu Scale
AS Ashworth Scale
TS Tardieu Scale
MMAS Modified Modified Ashworth Scale PROM Passive Range of Motion
EMG Electromyography
RPM Rotations Per Minute
ADC Analogic-to-Digital Converter
IC Integrated Circuit
DAC Digital-to-Analogic Converter
UI User Interface
ADRESH A/D Result High ADRESL A/D Result Low
FFT Fast Fourier Transform
1
INTRODUCTIONSpasticity consists of a muscular tonus alteration caused by a flawed central nervous system (CNS) which leads into a hypertonic phenomenon [1-4]. The presence of spasticity is normally
noticeable by the appearance of a denoted velocity dependent “rigidity” throughout the passive
mobilization of the affected limb [1, 3]. Spasticity is a potential source of constraints in subjects’
independency by negatively affecting the accomplishment of daily basic tasks [5].
To quantify spasticity physicians usually recur to the clinical scales [6-10] from which the most
used ones are the Modified Ashworth Scale (MAS) [7-9, 11, 12] and the Modified Tardieu Scale (MTS)
[6, 10]. Both these scales quantify spasticity based on the perception of muscular response sensed
trough the passive mobilization by an operator with no resource to any advanced measuring tools
[6, 7-10, 12]. In a different field of approach, many instruments have been built based on the
quantification of biomechanical magnitudes that have shown direct relation with spasticity [7, 9, 10,
13-24]. Even so, most of these instruments had either inappropriated size for clinical usage, weak
result correlation both inter and intra-subject, or a noticeable result dependence on the operator
[7, 9, 10, 13-24].
Another problem associated with spasticity is the fact that the treatment methods usually comprise high costs [2, 5-7]. Also, the relation between the quantity of spasticity and the dose that
has to be applied to attain an effective and desired result is known to be very strict. These two
facts combined justify the need for a more precise equipment to quantify muscular spasticity [2,
5-7].
The main objective of this project was to create a reliable device to detect and quantify spasticity that can simultaneously: be of easy and fast application, have no need of a specialized operator, be portable, present a good result repeatability and good independency from the operator in the produced results.
3
1. THEORETICAL STUDY AND STATE OF THE ART1.1 Spasticity
1.1.1 Clinic and etymologic definition
Spasticity is commonly described as a simple type of muscular “rigidity” [1, 4]. However,
clinically and scientifically, this designation is inappropriate and incorrect as muscular rigidity designates a different pathology with only a few similar effects [1]. Unlike muscular rigidity,
spasticity is defined as velocity dependent effect, positively affected by the increase of movement speed [1, 3]. Physiologically, it consists of an abnormal skeletal muscle tonus [1, 2] which causes this
type of muscular hypertonia [3]. As a result of this phenomenon, subjects usually express
permanent or intermittent [2] muscular contractions (Figure 1.1) which can be sensed and
quantified by passively mobilizing the affected limb [3].
Spastic muscular hypertonia results directly from a malfunction in the central nervous system
(CNS) [3], more precisely, by the loss of the natural equilibrium between muscular activation and
inhibition [1]. This kind of disorder is typically connected to superior motor neuron lesions [1-4].
Among a vast group of lesions the most relevant ones are spastic diplegia, motor neuron disease, multiple sclerosis [1, 3, 4, 6], vertebro-medullary lesions, encephalic lesions, tumours, stroke and
cerebral palsy [1, 3, 4].
Figure 1.1 –Subjects that present spasticity in flexor muscles around the elbow and the wrist junctions [25,26].
1.1.2 Epidemiology and impact
The main causes of muscular spastic hypertonia are considerably common [27]. For example,
according to studies carried in United States of America, the actual incidence of cerebral palsy is
around 36 cases by each 10000 births [27] affecting mostly male subjects in a ratio of 14:10 [27].
On its own, accidentally inflicted spinal cord injuries contribute with around 30 to 60 persons with non-lethal acquired lesion per million of inhabitants which sums on 10000 new subjects with this type of lesions per year [28]. And finally, multiple sclerosis has an incidence of 42 cases per million
4
Statistically, muscular spasticity is present in 77% of cerebral palsy subjects, 65 to 78% of
the persons with non-lethal spinal cord lesions [5] and around 90% of the subjects with multiple
sclerosis [30]. Apart from these 3 main causes in number of subjects to spastic subjects pool, other
lesions like stroke (39% of all cases turn into spastic subjects) [31] and cranio-encephalic injuries
(50%) [32] also contribute with a considerably high number of subjects.
The consequential impact of muscular spasticity on the daily life of spastic subjects is very variable and influenced by both the grade of spasticity and the region where the affected muscles are located. Spasticity negatively impacts the subjects independency to do their personal hygiene, it interferes in their walking pattern and in a group of other daily simple tasks [5], commonly causes
pain in the affected limbs as well as other secondary complication like contractures, pressure ulcers, fatigue and sleep disorders [5]. Therefore, the negative effect on subjects’ daily life is an
undeniable fact which degree depends on the subject needs and on the number and type of barriers that arise with the acquired spasticity (architectural barriers and others). However,
spasticity can lead into some positive impacts such as the increase of venous return [5, 6], the
increase of subject stability while standing or seating [5, 6, 31], muscular growth and the increase in
strength of spastic muscles [5].
1.1.3 Treatments
As previously mentioned, acquired spasticity results in a group of good and bad effects. Those effects should always be correctly compared and weighted to decide if a clinical treatment
is needed and how it will improve subjects’ life quality. Consequently, the decision should not only
be supported by the grade of muscular spasticity presented by the subject but as well by the
increase in subjects’ life quality that treatment could turn into [5, 11]. Even though this has been a
conclusion of many authors [2, 5, 6, 31], in the present days there is still no clinical method that shows
sensitivity to this aspect.
The 3 main goals of clinical treatment are: to improve the subject performance and adaptation to his surroundings, to reduce the risk on the appearance of secondary complications and to appease the pain [2].
There are various types of treatments and/or strategies of application. The first line of treatments are the most conservative ones, such as the case of the rehabilitation therapies. If later a need for a more acute type of treatment arises, the subject is prescribed a set of drugs. Those, if needed, can be followed by intrathecal injections. Finally, and only as a last resort if everything else fails, surgery can be administered [2, 5].
5
and front rhizotomy to unlock jammed nerves and microsurgeries to purposely cause lesions on the motor nerve that causes the hypertonia [2].
1.2 Spasticity assessment methods
1.2.1 Clinical Scales
The clinical scale assessment methods are based on protocols that qualitatively grade the sensed muscular response during the passive mobilization of a limb according to a pre-defined scale [6, 7-10]. Among all the existent scales, the most used one is the MAS [7-9, 11, 20] followed by the
Ashworth Scale (AS), the Tardieu Scale (TS) and the MTS [6, 10].
The AS and MAS (Table 1.1) are based on the quantification of the perceived resistance during the passive mobilization of a limb or segment. The magnitude of that resistance is then
graded in 5 different levels with the AS (grade 0 to 4) and 6 levels with the MAS [6]. The MAS just
as the name denotes is a modified version of the AS where the lower grades were revised to turn
the boundaries between them less diffuse. To do so, a new 1+ grade was introduced [8]. Even
though this new grade slightly improved the results, the main problem of the MAS is still the result clustering effect in the lowest grades of the scale [9]. To complete, the MAS is still unable of
providing any type of biomechanical information related to the components of the muscular tonus like the viscoelastic component or the reflex activation of the contractile elements [9].
The TS and MTS (Table 1.2) evaluate the passive range of motion (PROM) at different movement velocities, the quality of the reaction and the angular position where the first muscular
response, which is called “catch”, is perceived during a limb extension done at a high angular velocity [12, 33-35]. Usually the velocities used in MTS spasticity assessment are the ones
corresponding to a movement of extension or flexion done in one second and in half a second
[12]. While assessing, the examiner should collect two catch angles, R1 and R2 which correspond
to the angle at the higher movement velocity and the one at lower velocity, respectively [35]. The
presence of a considerably high difference between R1 and R2 values evidences the presence
of a velocity dependent resistance which is usually associated to muscular spasticity [35] and a
small difference can evidence the absent of spasticity or that the perceived resistance is non-velocity dependent [35].
There are still other scales like the “Priebe and Penn”, based on the assessment of the
frequency of spasms [6, 12] and, more recently, Ansari et al. developed the Modified MAS (MMAS)
as a result of a study which concluded that this new scale as a better result repeatability for the
same examiner but, unfortunately, a weak correlation in the results from different examiners [11].
6
Table 1.1 –Modified Ashworth Scale used in clinical environment to assess spasticity [7].
Grade Explanation
0 No increase in muscle tone;
1 Slight increase in muscle tone, manifested by a catch and release or by minimal
resistance at the end of the range of motion;
1+ Slight increase in muscle tone, manifested by a catch, followed by minimal resistance
throughout the remainder of the range of motion;
2 More marked increase in muscle tone through most of the range of motion, but affected
limb is easily moved;
3 Considerable increase in muscle tone, passive movement is difficult;
4 Affected limb is rigid in flexion or extension.
Table 1.2 –Modified Tardieu Scale used in clinical environment to assess spasticity [12].
Grade Explanation
0 No resistance throughout the course of the passive movement;
1 Slight resistance throughout the course of the passive movement, with no clear catch
at precise angle;
2 Clear catch at precise angle, interrupting the passive movement, followed by release;
3 Fatigable clonus (<10s when maintaining pressure) occurring at precise angle;
4 Continuous clonus (>10s when maintaining pressure) occurring at precise angle.
All these scales, even if highly subjective, represent useful tools extremely used both in clinical procedure and in scientific studies to obtain qualitative information concerning muscular spasticity. However, some studies revealed the low reliability and low sensitivity to small spasticity variations [8, 10, 13]. In addition it is notorious that the results are substantially dependent on the
examiner [6]. Removing this dependency was one of the main goals of the tool developed during
this project.
Like previously mentioned for the treatments, authors [36] defend that the quantification of
spasticity should also take into account the effect of the disease in the subject life quality [36]. As
a matter of fact, with that goal, some authors developed some questionnaires which unfortunately remain unused [6, 36].
To conclude, even though these scales present a limited ability to quantify spasticity, they will surely remain used [14] due to their simplicity, inexistent usage cost and their relatively
7
1.2.2 Electrophysiological measurementsThis type of measurements is nearly never used in clinical procedure because the produced results are hard to analyse, the devices needed are very expensive and because a few methods require invasive procedures [7, 37].
One example of this type of measurements is the usage of electromyography (EMG) to estimate muscular reflexes during the passive mobilization of a limb, to study the amplitude and the duration of those reflexes [34] and to categorize them in spastic or non-spastic ones [38]. Another
example is the measurement of the H-Reflex (Hoffmann Reflex) which is produced by electrically stimulating a muscle and measuring the M-wave (muscular response wave) given by the muscle
[39]. This method is capable of identifying a “shorter” excitability of the synapsis caused by an
alteration of the synaptic excitation threshold [37]. Even though both the Reflex and the ratio
H-max/M-max present higher values in the presence of spasticity when the objective is to quantify spasticity, those values have shown to be highly variable and with diffuse or no dependence at all to the spasticity grade [37]. In fact, during a cross study with MAS, subjects with different clinical
scale results presented similar H-Reflex amplitudes, and subjects with similar grades of spasticity presented very different H-Reflexes [37]. Similar results were found for the H-max/M-max ratio [37].
The main problem associated with the application of EMG technics is the irrefutably high dependence on factors such as: subject subcutaneous fat, skin resistance and muscle fibbers orientation in the spot where the electrodes are attached [34] as these factors substantially
contribute to the previously mentioned variability in results.
To conclude, the main advantage in the usage of EMG in new studies is the fact that it can
be used to monitor and easily detect subjects’ voluntary muscular contractions and avoid “false
positive” results when assessing or quantifying spasticity [34].
1.2.3 Biomechanical measurements
In the last few years, many authors developed and described various methods, tools, devices and instruments created to measure biomechanical magnitudes with a direct relation with spasticity which can be described and understood in such a way that quantification is described through a physical or mathematical model [9, 14].
The recent technical and technological developments in the area of biomechanical measurements have evidenced the huge potential these methods possess to quantify spastic hypertonia with much more precision and liability than the clinical scales [7, 14, 37]. Even so, this
methods remain unused in clinical procedure and most of the authors’ point the main causes as
8
One of the oldest biomechanical tests to assess and quantify spasticity is the Wartenberg Pendulum Test, which was described in 1951 by the author with the same name as being a simple method with a good liability [9, 36]. In this test, the examiner extends the leg of a subject seating or
laying down on the edge of a litter and then drops the leg and lets it oscillate [9, 36]. Wartenberg
described that a non-spastic leg oscillates smoothly, just like a pendulum [9], 6 times in average,
before it stops [36]. However, in a spastic leg, the oscillation is affected by the abnormal viscoelastic
properties and the exaggerated extensive reflexes of the limb [9]. As a result, the number of
oscillations is reduced in proportion to the grade of spasticity in the limb [36]. More recent studies
concluded that the observation of the first oscillation, in opposition to the simple evaluation of the number of oscillations, could be a better solution to assess and quantify spasticity in a subject limb [36].
The Wartenberg Pendulum test is commonly used in studies of spasticity in subjects of various ages with cerebral palsy, victims of stroke and others [9, 40]. It is highly accepted as a
method capable of differentiating healthy subjects from subjects with spasticity in the extensor
muscles of the knee [36] and able to distinguish subjects with spasticity and parkinsonian rigidity
[41]. However, the Wartenberg is more and more seen as an imprecise method for spasticity
quantification [40].
Recently the combined use of the Wartenberg Pendulum test with EMG technics demonstrated much better results than the simple older test with a considerably higher sensitivity in spasticity quantification for flexor muscles in the knee even in extreme cases like 2 years and a half old children [9] and on elder subjects [41].
In the literature, there are numerous examples of instruments used in biomechanical
quantification and, in the last few years, many new solutions have emerged [9]. These instruments
recurred to mechanical tools and data acquisition instruments to be more precise than the clinical
scales in the identification of the characteristic aspects of spasticity [38]. Most of these methods
have been mainly used to quantify neuromuscular activity, muscular resistance (force and torque measuring tools), muscular rigidity, elasticity, viscosity, etc. [38]. Below are some concrete
9
1.2.3.1 Spasticity Measurement SystemThe Spasticity Measurement System[17] (Figure 1.2) consists of a mechanical machine
capable of producing movements of sinusoidal oscillation in the hip (with frequencies in between 3 and 12Hz) by simply moving a foot correctly attached to a platform which is moved by an electric motor. The system is completed by an acquisition and registry module responsible for collecting the torque response and the angular position of the foot during the evaluation time and an EMG system for muscular reflex monitoring [17]. The results presented by the author regarding the
detection of muscular spasticity are satisfactory [17]. Even so, there were no further studies to
proof it was capable of quantifying spasticity.
Finally, the main problem found in this system was the inappropriate size for clinical use as well as the restrict applicability to the lower limb only.
Figure 1.2 –SMS – Spasticity Measurement System – Explanatory scheme of the measuring equipment
[17].
1.2.3.2 On-line spasticity measurement system
The On-line spasticity measurement system (Figure 1.3) is divided in 3 subsystems:
mechanical structure, acquisition electronics/sensors and a control subsystem. The function of the device was to induce passive movement of a body segment around a specific joint while measuring the sensed muscle torque during the mobilization. The applicability of the instrument was very wide covering a vast range of joints and limb sizes [15].
Figure 1.3 –Mechanical structure of the On-line spasticity measurement system. The arrows indicate the
10
The results obtained by this instrument were highly satisfactory in distinguishing spastic from non-spastic limbs. The only flaw it presented was the inadequate size for clinical use. This fact was promptly pointed by the authors and justified by the purpose for which this device was built. That purpose was to perform a group of scientific studies that could lead into a bigger and better understanding of the biomechanical parameters associated with spasticity without any human interference in the system. The final goal of these authors was to develop a clinically accepted
portable system based on this system with high precision in assessment and quantification [15].
1.2.3.3 Portable system with force transducer
This portable system (Figure 1.4) is composed by a force transducer and one flexible electro-goniometer. The instrument is to be held by an examiner that passively mobilizes the limb of a subject while the instrument does the acquisition of angular position and applied force on the
transducer [7]. From the data acquired the “Resistance to Passive Motion” is calculated and used
to quantify spasticity [7]. Even so, this parameter ended up showing small correlation with the
results obtained with the MAS especially in the grades 1, 1+ and 2. For that same reason, it was declared as possibly inefficient to quantify spasticity but highly effective in detecting its presence
[7].
Figure 1.4 –Scheme of the portable system with a force transducer [7].
1.2.3.4 Portable Spasticity Assessment Device
The Portable Spasticity Assessment Device (Figure 1.5) is divided in 2 main parts: the air
cushions, used to sense muscle response torque, and an angular position sensor to monitor and
register the instant angle of the limb that is being assessed [18]. The air cushions are strapped in
both sides of the wrist (for the upper limb) and, the cushions, are connected to a differential
pressure sensor that communicates with a personal computer [18]. The results obtained with this
instrument showed good correlation with MAS results specially when executing the movement at a high frequency (>1.5Hz) [18, 38]. The constant need of monitoring by a trained operator that could
11
Figure 1.5 –Portable Spasticity Assessment Device scheme [18].
1.2.3.5 MyotonometerTM
The MyotonometerTM function is to measure the rigidity (or viscosity) of a muscle with simple
non-invasive contact with the skin [19, 20]. This device is composed by a line of transducers that
measure the quantity of tissue moved when an external force is applied by a probe over the muscle that is being tested. The resulting value has a linear relation with the muscle tonus of a
relaxed muscle [20] and so, it can be used to measure alterations in the tonus such as spasticity.
This device wasn’t as successful as expected in quantifying spasticity in accordance with the MAS
[20]. In the reviewed literature, the authors also presented results based on statistics that can be
considered biased and impartial.
1.2.3.6 Isokinetic Dynamometers (Biodex multi-joint SystemTM and Kincom 500H)
The isokinetic dynamometry is a method extensively used in the last decade mainly in
computer controlled machines and instruments [22] especially in the areas of physiotherapy and in
some scientific studies [21, 22]. Some of the most technologically advanced instruments [10, 13, 21-23]
can record and determine a huge set of parameters simultaneously with relevance in spasticity assessment like instant velocity, angular position, muscular applied force, etc. Also very important is the fact that they can be used in a high variety of muscles and articulations [10, 13, 21-23].
Among all the devices available in the market, there are two with more relevant results in spasticity assessment which are the Biodex multi-joint SystemTM [10, 21] (Figure 1.6), which is
mainly used in rehabilitation and the KinCom 500H [13, 22-24] (Figure 1.7) which can be described
as a device capable of inducing movements at a constant velocity with a coupled force transducer as main source of data [24].
12
Figure 1.6 - BIODEX MULTI-JOINT SYSTEM–PRO[39] used in the study made by Supraja e Singh[10].
Figure 1.7 - KinCom 500H [13, 22-24].
There is a considerably high amount of studies where this kind of devices were used [21-23, 39]
and, generally, the results are quite satisfactory in detecting the presence of spastic hypertonia. The quantification results have shown good correlation with the MAS with imprecise results only in separating slightly spastic subjects and non-spastic ones [13, 21-23].
To conclude, the main and big advantage of this devices is the fact that they have multiple
applications [10, 21] but, they also have a big disadvantage in the fact that they are quite big and
13
1.2.3.7 Instrument developed by Inês Clemente et al.–“The Glove”The main objective of this project was to build the prototype of an instrument capable of
assessing and quantifying spasticity with simplicity of use and a low cost of production [16]. The
development team had members who were also involved in the SpastiMed project.
The final prototype (Figure 1.8) is composed by a glove with a water sac which is connected to a pressure transducer and an acquisition system which communicates with a personal computer where the data is processed and shown to the operator.
Figure 1.8 –Spasticity measurement device developed by Inês Clemente [16]. A) Inside view of the glove
(plastic water sac inserted between the glove and the yellow tissue). B) Outside view ( (1) back of the hand (2) and palm of the hand) of the Glove when correctly strapped on an examiner’s hand [16].
To use this device, the physician would just have to wear the glove and execute a similar
protocol to the one usually used to assess spasticity on a limb [16]. In the mentioned project, only
the arm was studied (elbow junction).
The prototype showed satisfactory ability to differentiate the spastic subjects from the healthy subjects seen that 82% of the non-spastic cases and 89% of the spastic ones were identified in accordance with the physician diagnostic obtained using a custom clinical scale [16]. Even so,
during the development and validation of this prototype, a high result dependency on the examiner was detected. To contour this limitation the examiner that operated the instrument was always the same. The study of all the information and notes left by the author also lead to the conclusion that a limitation that should be corrected urgently was the lack of velocity monitoring to avoid producing different spasticity grade results even in the same subject only caused by a variation in the limb mobilization velocity. All these conclusions were taken highly into account during the
14
1.3 Project motivation and contextualisation
The main reasons that justify the search for a more precise equipment in spasticity assessment are the fact that the regularly used treatments present high costs and the very strict relation between the degree of spasticity, the dose and the consequent effectiveness of the applied treatment.
The objective of this project is centred around the scientific and clinic urgency in creating a method for spasticity assessment and quantification that can gather simultaneously a set of key points like being of easy and fast application, no need for a specialized operator, being portable, present a good result repeatability and a good independency from the operator in the results produced.
After an extended literature review this research team took part in a mini-intern course lectured in Centro de Medicina de Reabilitação de Alcoitão in which the main team members could understand and contact with the pathology and its effects, observe the clinical procedure of spasticity quantification by MAS and the administration of botulinic toxin. Later on, the team idealized a new device that could gather the previously referred key points and that could be an attractive alternative solution to the use of the clinical scales in daily clinical procedure. This new
15
2. BUILDING AND DEVELOPING SPASTIMEDThe SpastiMed device is divided in 3 parts (Figure 2.1). The mechanical part is composed
by an articulated metallic arm on top of which a high current input brushed DC motor and a set of gears are attached. These last two are responsible by passively mobilizing the metallic arm and the subject limb while the second part, composed by the control and acquisition electronics, is collecting real-time data like the angular position of the arm and the motor consumed current, which is proportional to the motor torque output. In this prototype system, a few sensors are responsible for supervising subject security during the procedure. The third and last part is a user interface developed in LabVIEW® which is responsible for the storage and treatment of the acquired data.
A diagram that summarises this last paragraph is shown in the Figure 2.1.
Figure 2.1 –Block Diagram representation of the SpastiMed device.
16
2.1 Mechanical Part
The obvious main goal of the mechanical part of the prototype was to passively mobilize a subject upper limb. The final state of the prototype can be seen in Figure 2.2. The bigger sized conic gear (Figure 2.3 – C) – d)) is fixed tightly with the metallic part that lays over the subject forearm (Figure 2.3 – C) – c)) and is supposed to sit over the subject joint. Over the second metallic part (Figure 2.3 – C) – b)), the one that lays over the patient arm, is screwed a DC motor (Figure 2.3 – C) – a)) to which is fixed a smaller sized conic gear (Figure 2.3 – C) – e)). The size ratio between the referred conic gears is 2:1.
Figure 2.2 –Final state of the mechanical part of the SpastiMed device. A) Top View when attached to a
subject arm. B) Side View when attached to a subject arm. C) View of the device without the white plastic protective covers. a) DC motor. b) arm metallic part. c) forearm metallic part. d) bigger conic gear. e)
smaller conic gear. f) splint parts to help locking the device in position on top of an arm.
2.1.1 Introductory considerations
To establish the design sizes of the metallic parts (Figure 2.3 – C) – b) and Figure 2.3 – C)
– c)) and the minimum specifications of the motor that could be used (Figure 2.3 – C) – a)) an
extreme standard case [42] of a very short (1m tall) and heavy (100kg total mass) person was
considered. The segments that the SpastiMed device passively mobilizes are the ones presented
in Table 2.1 (adapted from [42]).
17
Table 2.1– Expected mass and length of the different segments of a human upper limb from a subject with a total mass of 100kg and a total height of 1m [42].
Segment Mass (kg) Length (cm)
Arm 5.26 33.5
Forearm 3.64 28.0
Hand 1.26 19.5
Therefore, all the previously mentioned data can be condensed to a simple problem of classic physics of a metallic rod with 25cm and 5.2kg, fixed on one of the extremities, to which is applied a perpendicular force to its rotation axis over the free extremity. Thus, the moment of inertia of
the rod can be calculated using the Eq.1.
𝐼 =13 𝑀𝐿2 𝐸𝑞. 1
The obtained result is I=0.108(3)kg.m2.
2.1.2 Conic Gears
The selection of these components was mainly based on the set of choices available in the market suppliers.
Figure 2.3 –Schematic drawing of a cut view of the gears used in the mechanical part of the SpastiMed.
18
Table 2.2 –Specifications of the set of gears used in the mechanical part of the SpastiMed. All the lengths and sizes in the table are expressed in millimetres and are related to the ones presented in Figure 2.2
(adapted from [43]).
Nº de Teeth dp A+V dm Bore F A de S Lm
15 22.5 32.0 16 6 17.23 17.23 26.11 1.73 7.88
30 45.0 25.0 25 8 17.85 45.88 45.88 2.85 9.00
2.1.3 Motor
Based on the previously described classic physics problem and adding the facts that the prototype was expected to achieve an angular velocity of ω=90o/s, that the range of painless
motion of a spastic member is usually around the 70o and that the acceleration should be made
in around 0.1s then, the angular acceleration α applied to accelerate the previously described rod
from 0 to 90o/s can be determined through one of the cinematic equations of a movement with
constant acceleration (Eq.2).
𝜔(𝑡) = 𝜔0+ 𝛼𝑡 𝐸𝑞. 2
From which results that α=900o/s2or, converting from grades to radians, α=15.71s-2.
Using Eq.3, it is now possible to determine the fragment of the range of motion “lost” in the
acceleration process from 0 to 90o/s.
∆𝜃(𝑡) = 𝜔0𝑡 +12 𝛼𝑡2 𝐸𝑞. 3
The result is ∆θ=4.5o.
Seen that both the acceleration and the moment of inertia are now known, the torque can
now be obtained through the use of the Eq.4.
𝜏 = 𝐼𝛼 𝐸𝑞. 4
The result is 𝜏=1.7N.m.
Considering now that the point of application of the corresponding force is R=25cm and
recurring to the known torque relation with force and radius (Eq.5) the force applied in the gear at
2.25cm can be calculated.
19
The magnitude of that force is F=75.(5)N and consequently, it is now possible to, once more
through the use of Eq.5, calculate the torque output exerted by the selected motor through the
gear with R=1.125cm. Therefore, the torque output value is 𝜏=0.85N.m.
In the considered ideal case scenario, the limb would not produce any kind of resistance to
the acceleration or to the passive mobilization. In a real case scenario this resistance can’t be
ignored and will surely play a considerably relevant role in the motor load stress. For that reason, while choosing an appropriate motor a security factor (four times) was applied to the motor torque output.
The second fundamental parameter that had to be defined was the motor output in rotations per minute (RPM). As previously mentioned, the metallic arm should be mobilized with angular
velocities in between 0 and 90o/s, what corresponds to 15RPM. Remembering that the size ratio
between gears is 2:1 then, the motor speed output will have to be 30RPM and, for the same reason as the mentioned before, the chosen motor had an unloaded maximum speed output nearly four times bigger than this value.
The motor seen in Figure 2.3 – C) – a)) was chosen based on these two fundamental specifications (output torque and speed). All of its specifications are shown in Table 2.3.
Table 2.3 –Specifications from the motor used in SpastiMed’s mechanical part (adapted from [44]).
Parameter minimum Maximum
DC Supply Voltage (V) 4.5 6.0 12.0 15.0
Consumed Current with
no load (A) - 0.45 0.52 -
Consumed Current with
load (A) - 2.10 2.85 -
Rotation Speed with no
load (RPM) 40 53 106 132
Peak Stall Torque (Nm) - 9.72 14.50 -
2.1.4 Metallic parts
With the specifications obtained in 2.1.2 and 2.1.3, with special focus on the gears chosen (Figure 2.3 – C) – d) and Figure 2.3 – C) – e)), the metallic parts presented in Figure 2.3 – C) –
b) and Figure 2.3 – C) – c) were designed in the 3D graphic design software SolidWorks®. The
20
freedom to manipulate the drawings to obtain the best possible result. The parts were machined from a block of aluminium to obtain a light prototype with good mechanical properties. To achieve the best result in the articulation between the two metallic parts and having a precise and solid angular position measuring tool, both the motor holding plate and the gears were considerably modified from their stock state.
2.2 Electronics
The second part of the SpastiMed device is composed of all the control and acquisition
electronics being these divided in five sub-parts: current sensor, angular position sensor, the motor driver circuitry and the microcontroller. In the next few steps all these sub-parts will be extensively described to clarify their construction as well as their role in the device.
The complete schematic of all the electronics integrated in the SpastiMed device can be
seen in Figure 2.4.
Figure 2.4– Schematic of all the electronics integrated in the SpastiMed device.
2.2.1 Current Sensor
SpastiMed’s spasticity assessment method is based on the relation between the motor
21
Considering the DC motor previously described, the expected consumed current should be normally ranged in between 0 and 2.5A. With that in mind and based on the specifications of the Analogic-to-Digital Converter (ADC) module of the chosen microcontroller, the goal in this step was to build a circuit capable of linearly converting a current value in those referred ranges to a voltage value in between 0 and 5V while producing the smallest alteration possible to the motor supply voltage.
The schematic of the developed circuit can be seen in Figure 2.5. This small circuit is based
on the simple theory behind the Ohm’s Law and can measure the current passing through a small
ohmic value resistance (RS<1Ω) by amplifying the small electrical potential difference with an
Operational Amplifier (Op-Amp).
Figure 2.5– Schematic of the Current Sensor developed and used in the SpastiMed.
To determine the value of the sensing resistance (RS) the desired maximum electrical potential difference in between the resistance terminals was defined as 0.5V. Therefore, seen that this maximum should correspond to the previously mentioned maximum current value of
2.5A, using the Ohm’s Law the value of RSis RS=0.2Ω. With such high value of current (2.5A),
one big concern in the component choice was the dissipative potency, which had to be at least
PRS=1.25W. Within the choices available the used resistance was the closest to this specifications
RS=0.22Ω with PRS=6W.
The values of RGand R2 were determined through the use of the equation of the gain of an
Operational Amplifier in non-inverting amplifying mode (Eq.6) and by defining the gain value (G)
as being 10 or lower so that the output would never exceed the 5V that the microcontroller can safely read.
𝐺 =(R2 + RG)R2 𝐸𝑞. 6
The result for RG was RG ≤ 42,3kΩ. Based on the material available the used resistance
22
In the final circuit a couple of 1kΩ resistances were connected from the non-used amplifier
input pins to the ground line, like suggested in the Op-Amp LM358 datasheet [45].
2.2.2 Angular position Sensor
The second relevant magnitude in SpastiMed’s spasticity assessment routine is the angular
position of the metallic arm. In the final prototype, the fundamental component to achieve that goal was a linear high-precision potentiometer which was fixed tightly inside the bigger gear bore, parallel to its axis of articulation. With this design, a linear relation between the resistance value of the potentiometer and the angular position of the metallic arm was achieved.
Similarly to what was described in 2.2.1, the objective was to develop a circuit that would
linearly convert a resistance value that would range from nearly 0 to nearly 10kΩ in a voltage
value from 0 to 5V. The simpler and most logic solution was the use of a current regulator which to keep a constant current in the potentiometer and consequently keeping the voltage value linearly related to the resistance at every instant (Ohm Law).
The schematic presented in Figure 2.6 is based on a common current regulator circuit [46]
with a Zener diode that was replaced by LM385 which is an adjustable high precision Zener diode.
The Zener voltage was fixed at VZ =1.24V in between the (+) and (-) terminals. As a result, in
theory, R2 will define the current value(IL) just like described in Eq.7.
𝑉𝑍− 𝑉𝐸𝐵= 𝐼𝐿R2 𝐸𝑞. 7
Figure 2.6– Schematic of the Angular position sensor circuit.
According to the datasheet [47] of chosen transistor (Figure 2.7 – Q2) at a temperature of
25oC, VBE is approximately 0.65V and it will slightly decrease with an increase of the component
temperature. For that and for safety reasons, the value of the used R2was 1.5kΩ instead of the
23
2.2.3 Safety switchesOne on/off button switch was integrated on the system so it could be held by the subject under evaluation so that he/she could stop the motor movement of the device at any moment. Another on/off button switch is placed on the top of a hardtop case inside which all of the electronic circuits are placed. This second button has the same working pattern.
Finally, one push button is present on the hardtop case which possesses a vital role in the
calibration of the SpastiMed device by helping in the definition of the painless range of motion
before the assessment and quantification procedure is made.
In the code developed for the microcontroller (7. Appendices) a few other button actions were
left on a dormant state for further developments of the SpastiMed device.
2.2.4 Motor control driver
During the development of all the hardware and circuits present in this prototype, the development of an appropriate motor driver circuit was the longest and more complex step. This step arose numerous problems and required a group of slight adjustments to the conceptual idea itself.
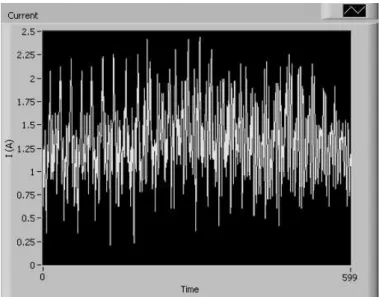
The desired motor driver should have the role of controlling both the velocity and the direction in which the motor will rotate. To do so, our first choice fell on the commonly used Full H-Bridge motor drivers on a single Integrated Circuit (IC). Unfortunately, this approach had to be abandoned based on the fact that this type of component revealed itself very sensitive to some characteristics of the used motor that would lastly cause a few of these ICs to burn down during the device development. Another flawed relevant fact was that the velocity control on the chosen IC motor driver had to be done through the use of a Pulse Width Modulated (PWM) input in the motor which was causing undesirable oscillations in the motor consumed current (Figure 2.7)
“polluting” the most relevant signal to this study.
The final solution to these problems was based on a motor characteristic that allows its speed to be controlled through the variation of the DC Voltage Supply value. As a consequence, much of the previously presented calculations to determine the specifications of the mechanical parts of SpastiMed may seem slightly unjustified when observing the final prototype and the way it
works. Even so, and seen that those calculations reflect the exact way through which those specification were determined, they were kept unaltered.
24
Figure 2.7– Motor consumed current signal when supplying the motor with a 12V Pulse Width Modulated
line. Time scale is in cs.
2.2.4.1 Motor velocity control
Based on the previously mentioned objective of controlling the motor speed through the value of its supply voltage, the goal in this step was to create a digitally controlled voltage regulator. To do so, two components were combined: a Digital-to-Analogic Converter (DAC) based on the R/2R ladder theory and a standardly used analogic adjustable voltage regulator (LM317) supplied by a 12V DC line with a maximum current supply of 6A. To control this remotely, the DAC was connected to the PORTD of the microcontroller, like shown on Figure 2.8.
25
2.2.4.2 Control of the direction of rotation of the motorTo control the direction in which the motor rotates a small circuit was developed with two high current relays and a relay driver IC. This relay driver IC was responsible for receiving input from the microcontroller and drive the relays according to those. The microcontroller outputs used were the RC0 (IN1) and RC1 (IN2) which were responsible for controlling the Relay1 and Relay2 respectively. The complete circuit schematic can be seen in the Figure 2.9.
Different combinations of the relay driver inputs produce different motor motion directions. All the possible combinations of logic inputs as well as the corresponding effect in the metallic arm movement can be seen in Table 2.4.
Figure 2.9– Schematic of the circuit used to control the direction of rotation of the motor presented in
2.1.3.
Table 2.4– Motor direction control state with the change of the inputs (IN1 and IN2) of the circuit
presented in Figure 2.9.
IN1 IN2 Motor state
0 0 Turned Off
0 1 Moves the metallic arm Clockwise
1 0 Moves the metallic arm Counter-clockwise

![Table 1.2 – Modified Tardieu Scale used in clinical environment to assess spasticity [12]](https://thumb-eu.123doks.com/thumbv2/123dok_br/16545687.736926/26.892.65.827.521.745/table-modified-tardieu-scale-clinical-environment-assess-spasticity.webp)
![Figure 1.6 - BIODEX MULTI-JOINT SYSTEM–PRO [39] used in the study made by Supraja e Singh [10]](https://thumb-eu.123doks.com/thumbv2/123dok_br/16545687.736926/32.892.235.659.104.468/figure-biodex-multi-joint-pro-study-supraja-singh.webp)
![Figure 1.8 – Spasticity measurement device developed by Inês Clemente [16] . A) Inside view of the glove (plastic water sac inserted between the glove and the yellow tissue)](https://thumb-eu.123doks.com/thumbv2/123dok_br/16545687.736926/33.892.269.620.328.695/figure-spasticity-measurement-developed-clemente-inside-plastic-inserted.webp)


![Table 2.3 – Specifications from the motor used in SpastiMed’s mechanical part (adapted from [44] )](https://thumb-eu.123doks.com/thumbv2/123dok_br/16545687.736926/39.892.187.705.643.923/table-specifications-motor-used-spastimed-s-mechanical-adapted.webp)