Graduated in Biotechnology Engineering
FRACTIONATION OF
HYDRO-ETHANOLIC EXTRACTS FROM GRAPE
POMACE THROUGH MEMBRANE
PROCESSING: THE EFFECT OF
MEMBRANE AND EXTRACTING MEDIA
ON PROCESS PERFORMANCE
Dissertation for obtaining the Erasmus Mundus Master degree in Membrane Engineering
Advisor: Carla Brazinha, Research Associate, FCT-UNL Co-advisor(s): João G. Crespo, Professor, FCT-UNL
Jorge M. R. D. Silva, Professor, ISA-UTL
Jury:
President: Prof. Isabel Coelhoso, Assistant Professor, FCT, UNL, Lisboa, Portugal Examiner(s): Dr. Luísa Neves, Post-Doc Researcher, ISA, UTL, Portugal
Prof. Damien Quemner, Asst. Professor, UM2, Montpellier, France Prof. Vlastimil Fila, Asst.Professor, VŠCHT, Prague, Czech Republic Member(s): Dr. Carla Brazinha, Research Associate, FCT, UNL, Lisboa, Portugal
SYED USMAN TAQUI
Graduated in Biotechnology Engineering
FRACTIONATION OF
HYDRO-ETHANOLIC EXTRACTS FROM
GRAPE POMACE THROUGH
MEMBRANE PROCESSING: THE
EFFECT OF MEMBRANE AND
EXTRACTING MEDIA ON PROCESS
PERFORMANCE
Dissertation presented to Faculdade de Ciências e Tecnologia, Universidade Nova de Lisboa for obtaining the master degree in Membrane Engineering
Fractionation of hydro-ethanolic extracts from grape pomace through membrane processing: The effect of membrane and extracting media on process performance
The EM3E Master is an Education Programme supported by the European Commission, the European Membrane Society (EMS), the European Membrane House (EMH), and a large international network of industrial companies, research centers and universities (http://www.em3e.eu).
Copyright @ Syed Usman Taqui, FCT/UNL
A Faculdade de Ciências e Tecnologia e a Universidade Nova de Lisboa têm o direito, perpétuo e sem limites geográficos, de arquivar e publicar esta dissertação através de exemplares impressos reproduzidos em papel ou de forma digital, ou por qualquer outro meio conhecido ou que venha a ser inventado, e de a divulgar através de repositórios científicos e de admitir a sua cópia e distribuição com objectivos educacionais ou de investigação, não comerciais, desde que seja dado crédito ao autor e editor.
Wrapping the gift and not presenting it is like feeling the gratitude but not expressing it. Hence, I wish to avail myself of this opportunity to acknowledge all those people who bear an imprint on this project.
I pay my profound gratefulness to my head supervisor Prof. Joao Crespo, for giving me such a great opportunity and providing such a wonderful platform to carry my master thesis work. I feel blessed to be associated with my mentor and supervisor Dr. Carla Brazinha for the myriad ways in which she has vigorously supported me. This project would have been a distant reality without her enthusiastic supervision.
I pay my indebtness to my co-supervisor Prof. J.R.D Silva for his unsparing efforts and unconditional support which increased my clarity in the subject and reduced ambiguity in the analytical work of my project carried out in Universidade Tecnica de Lisboa.
I express my eternal gratitude to the lab technicians Mafalda Cadima at Universidade Nova de Lisboa and Diana Faria & Daniel Duarte at Universidade Tecnica de Lisboa for their patient demeanour and kindness that has been motivation enough to keep me going even when the going got tougher.
My earnest thankfulness to Kaushal Khairnar and Rita Valerio for their perpetual energy and and making themselves available to render help at any point of time.
I extend my gratitude to the coordinator of EM3E program Prof. Andre Ayral and Dr. Elena Vallejo, Chargée de Projets, UM2, for being extremely supportive that gave me impetuous to complete the Erasmus Mundus program.
I humbly acknowledge Prof. Isabel Coelhoso for her gentle encouragement throughout my final year of masters program in Portugal.
I extend my gratitude to Prof. Patrice Bacchin and Prof. Karel Bouzek and their entire faculty team at UPS, Toulouse and ICT, Prague for making first year of program sail smoothly.
I am grateful to all the faculty members of FCT, UNL for being a constant source of enlivenment and guidance. I reserve my explicit vocal thanks to all the members of the laboratory at FCT, UNL and ISA, UTL for being the surrogate family during my stay. The academic freedom, the variety of facilities and friendly atmosphere contributed in no small measure for the accomplishment of my project.
The camaraderie and companionships of Nayan & Divya Nayak, who have firmly stood by me every step of the way and treating me as their family, would be forever cherished with humble gratitude.
Finally, I express my deepest sense of gratitude and love to my family and friends who have been a foundation of sustain and motivation all the way through my life.
Grape pomace are generated as waste in juice and winemaking industry in huge quantities. Studies have shown that nutrient extracts from these particular plant matrices garner myriad of benefits in health and nutraceuticals sector. Moreover, the newer recognition of monomeric and oligomeric phenolic compounds as bioactive molecules of commercial value such as gallic acid, catechin, epicatechin, quercetin and resveratrol gives scope for its extensive study and extraction from the pomace. The need for optimizing the biocompatible solvent extraction of ethanolic-water composition is realized and the kinetics of extraction time is demonstrated. The work focusses on novel use of membrane technology for separation and fractionation of lower flavan-3-ols from the crude extract. Four different membranes of varied pore size, chemical nature and material were chosen. Of these, Duramem 900, a class of Organic Solvent Nanofiltration membrane showed lower rejections of monomeric and oligomeric phenolic compounds. This membrane was then subjected to the comparative study of nanofiltration and diananofiltration.
List of Figures ... 1
List of Tables ... 1
1. Introduction: ... 2
2. Materials and Methods: ... 7
2.1 Materials ... 7
2.2 Experimental Procedure ... 8
2.2.1. Grape pomace pre‐treatment ... 8
2.2.2. Different methods of Extraction of Phenolic Compounds from Grape Pomace ... 8
2.2.3. Extracts pretreatment before Membrane Processing ... 9
2.2.4. Membrane Processing ... 9
2.3. Analytical Methods ... 10
2.3.1 Measurement of total phenolic content by the method of Folin‐Ciocalteu, the Glories’ method and the spectrophotometric test at 280 nm ... 10
2.3.2 Measurement of anthocyanins and polymerization index by Somer’s Method ... 11
2.3.3 Measurement of proanthocyanins by the Tannin Power Method ... 11
2.3.4 Measurement of the monomeric, oligomeric and polymeric flavan‐3‐ols by the vanillin assay with a prior fractionation of the monomeric, oligomeric and polymeric fractions in C18 Sep‐Pak Cartridges ... 12
3. Results and Discussions: ... 14
3.1 Optimization of the hydro‐ethanolic extracting solvent ... 14
3.2. Comparison of different methods of extraction ... 15
3.3 Screening of Commercial Organic Solvent Ultra and Nanofiltration membranes ... 17
3.3.1 Comparison of the Permeabilities and Global Observed Rejections of Anthocyanins and Proanthocyanins ... 19
3.3.2 Fractionation of Phenolic Compounds by C18 Sep‐Pak Cartridges ... 19
3.4 Nanofiltration vs. Diananofiltration ... 21
3.4.1 Comparison of Permeabilities for nanofiltration and diananofiltration ... 21
3.4.2 Comparison of the Global Observed Rejections of Anthocyanins and Proanthocyanins ... 22
3.4.3 Fractionation of Phenolic Compounds by C18 Sep‐Pak Cartridges ... 23
4. Conclusion: ... 25
List of Figures
Figure 1.Optimization of extracting solvent and extraction time using a Soxhlet unit for different
compositions of ethanol‐water mixtures ... 15 Figure 2. Comparison of different methods of extractions: concentrations of different classes of phenolic compounds (target compounds) in grape pomace extracts obtained by different methods of extraction
... 16 Figure 3. Permeability vs. Final Concentration for Nanoiltration membrane experiments ... 18 Figure 4. Instantaneous Observed Rejection vs. Final Concentration FC [‐] ... 18 Figure 5. Comparison of Global Observed Rejection Coeffcients of FI, FII and FII by different membranes
... 20 Figure 6. Permeability vs. Final Concentration for Nanofiltration experiment ... 21 Figure 7. Permeability vs. Dia‐volume for diananofiltration experiment ... 22 Figure 8. Comparison of Observed Rejection of FI, FII and FII by Nanofiltration and Diananofiltration .... 23
List of Tables
Table 1. Characteristics of the membranes studied ... 7 Table 2. Comparison of the fractionated phenolic compounds at different temperatures ... 17 Table 3. Measurement of Total Anthocyanins and Total Proanthocyanins and their Global Observed Rejection Coefficients for the different membranes ... 19 Table 4. Fractionated phenolic compounds of different membranes ... 20 Table 5. Measurement of Total Anthocyanins and Total Proanthocyanins and their Global Observed Rejection Coefficients for Nanofiltration and Diananofiltration ... 22 Table 6. Fractionated phenolic compounds of different membranes ... 23
1. Introduction:
Grapes have a long and abundant history. During the ancient Greek and Roman civilizations, grapes were
revered for their use in winemaking. Grape (Vitis spp.) is one of the most economically important plant
species due to its diverse uses in production of wine, grape juice and other food products [1]. It is
cultivated in all continents in the temperate regions where sufficient rain, warm and dry summers as well
as relatively mild winters are normal climatic patterns. The qualities of grape products are characterized
by their metabolic compositions [2].
Grape fruit contains various nutrient elements, such as vitamins, minerals, carbohydrates, edible fibers
and phytochemicals. The unique combination of phytochemicals in grapes includes a variety of bioactive
compounds such as simple phenolics, flavonoids, anthocyanins, stilbenes, proanthocyanidins, and vitamin
E [1,3,4]. In excess of 500 compounds, including 160 esters, have been identified to be present in wines
with active role in the formation of their organoleptic properties [5]. Simple phenolics in grapes are
derivatives of hydroxycinnamic acid (p-coumaric, caffeic, sinapic and ferulic acids) and hydroxybenzoic
acid (gallic, gentisic, protocatechuic and p-hydroxybenzoic acids) [1,5]. Gallic acid has been shown to
possess various therapeutic properties, including antioxidant, anti-cancer, anti-inflammatory, antifungal
and antiviral activities [6–9]. However, polyphenols including flavonoids, stilbenes and
proanthocyanidins are the most important class of biologically active compounds in grapes. Grape is one
of the richest sources of polyphenols among fruits. Flavonoids represent a widespread and common group
of natural polyphenols produced by the phenylpropanoid pathway [10,11]. They confer UV-protection,
determine flower coloration, attract pollinators, and act as tissue protectors in case of pathogen attack or
oxidative damage [12]. These classes of phenolics are the most abundant biologically active
phytonutrients among the polyphenols found in grapes, possessing cardioprotective, neuroprotective,
antimicrobial and antiaging properties [13-16]. Most of the flavonoids are found primarily in the outer
epidermal cells (the grape skin), whereas about 60%–70% of total polyphenols are stored in grape seeds
[1,4].
Phenolic compounds are also regarded as preservatives against microbes and oxidation for food [17, 18].
What’s more, in vivo assays showed that phenolic compounds are bioavailable [19, 20]. Therefore,
besides wine and juice, grape diet supplements would be promising functional foods worthy of
Nevertheless, more than 70% of grape polyphenols remain in the pomace (a byproduct of wine/grape
juice processing), which becomes a valuable source of health promoting nutraceuticals [21]. Therefore,
the wide range of pharmacological effects of grapes and grape products on human health is due to the fact
that those additives are sources of unique combinations of nutraceuticals.
However, some reports have also shown that at higher concentrations the effect of polyphenolic
compounds on health was negative and some structures in particular promoted the negative effects [22].
In addition, some high molecular weight phenolics could not be absorbed [23, 24]. Thus, researchers are
focused in the monomeric and oligomeric phenolic compounds as they are of paramount importance to
human health.
Winemaking industry takes the major share of the grape plantations. However, tonnes of grape pomace
are generated as waste and its disposal poses a serious challenge for wineries [25]. The production of
wine involves the harvesting and pressing of grapes to extract juice for fermentation. During this process
of pressing, the seeds, skins and stems are left out as waste. This waste of grape pomace adds to cost for
its removal and requires effective treatment to avoid the initiation of environmental hazards, such as
contamination of ground and surface water and also gives foul odour [26]. The winery waste has shown to
increase the chemical oxygen demand (COD) and biological oxygen demand (BOD) within wastewater
streams. This increase of BOD and COD levels arise due to the presence of lipids and pollution loads in
higher quantities and other organic substances such as tannins, sugars, pectins, polyalcohols and
polyphenols [27]. For this reason, wineries started using this waste of grape pomace as animal feeds or
fertilizers. Nevertheless, owing to the presence of health benefits of the phenolic compounds present in
this winery waste, these compounds can be extracted for production of additive-free, safer and maturally
processed products. Commercially, it can be viable in response to the changing market of customers using
“natural” products [28]. Thus, the work commercially highlights the botanical extracts which are subset of
natural extracts that seem to be the fastest growing nutaceutical ingredients segment. An annual world
demand increase of this market is estimated to increase by 8.9% through 2015. Furthermore, the
antioxidant category of over $ 1.5 billion market of cosmeceutical ingredients market has garnered
widespread commercial importance [29].
Solvent extraction has stood against time for being a traditional, simple and cost-effective technique.
Literature data reports the influence of different extraction solvents, techniques on the content of natural
antioxidants in extracts [30, 31]. The efficiency of solid-liquid extraction is strongly dependent on plant
commonly used for the extraction of phenolics from fresh product [31, 33]. The properties of extracting
solvents are shown to affect the measured total phenolics content (±25% variation) and antioxidant
capacity (up to 30% variation) in fruits and vegetables [31]. Of these, ethanol-water mixtures are of
interest to us as they biocompatible and are classified with GRAS status and thus, widely used for the
recovery of nutraceuticals [34]. The hydro-ethanolic mixture has been reported to have a beneficial effect
on extraction of phenolic compounds from grapes [35]. On the contrary, extractions performed with pure
water or ethanol also seem to suffer with low efficiencies especially in the case of anthocyanins and total
phenolics from grape by-products when compared to ethanol-water mixture [31,33,36]. Thus,
experiments of solid-liquid extraction were performed using the ethanol-water bio compactible mixtures
at different compositions to optimize the most effective hydro-ethanolic extracting solvent and also the
extracting time for the selected grape pomaces.
The simple steam distillation and vacuum distillation are the traditional approaches used for obtaining the
biologically active compounds, extracted from natural products. However, they generally require an
increased temperature and high energy consumption. The former is inappropriate for heat-sensitive
products. Furthermore, the evaporation of the solvent at times accompany a loss of compounds of low
molecular weight which can be at times be evaporated along with them [37]. Another method described in
literature, particularly for propolis extract concentration is lyophilization process [38]. However, this
method shows some of the disadvantages of the previously mentioned processes, e.g. involves a large
amount of energy, comprises incubation at about 70 ◦C [39], etc.
A membrane separation process can be utilized as an alternative of the approaches mentioned above. In
the cases of substances with a molecular mass less than 1000 Dalton, nanofiltration has received a great
attention as a process with reduced operation cost, carried out at ordinary temperature [40-42]. The last is
very important because most of the species extracted from the natural products are very unstable at
elevated temperature.
Organic solvent nanofiltration (OSN) is a pressure driven membrane based separation technique where an
incoming feed stream is separated into two components referred to as permeate (solvent and solutes able
to pass through the membrane) and the retentate (solvent and solutes retained or rejected by the
membrane). In nanofiltration molecules ranging between 200–1000 g mol−1 can be separated and the
mechanism is thought to be mainly the differences in stearic effects. In addition to steric exclusion
membrane-solvent interactions, pressure, feed concentration, temperature and charge of the solute can
OSN is a non-thermal technique and can offer potential advantages over conventional unit operations,
such as distillation, with regards to energy-efficiency. Additionally the risk of heat sensitive solutes
getting degraded and unwanted side-reactions during OSN operation is small [43].
Perhaps the best known and most successful application of OSN to date has been in the MAXDEWAX
process developed by W. R. Grace and ExxonMobil and employed for crude-oil dewaxing at the 72 000
barrels per day scale. Applications have been proposed for a variety of industries including refining – e.g.
hydrocarbons separation, food industry – e.g. deacidification of vegetable oil , fine-chemical and
pharmaceutical synthesis – e.g. organometallic catalyst separation and solvent exchange, etc [44].
In 2000, Nwuha investigated the membrane extraction of the bioactive components of green tea in an
organic solvent using different nanofiltration membranes [45]. A series of tests with various membranes
using higher ethanol concentrations (e.g. 80%) gave highest rejection of catechins with lower rejection of
caffeine for G-10 and G-20 membranes, respectively. There are also multiple reports by Tylkowski et al
on the extraction of flavonoids and polyphenols using solvent resistant membranes (duramem 200 and
500) from Sideritis spp (Mursalitza tea) and Propolis (resinous product from beehives) with high rejection
(>90%) [46].
The technique of continuous diafiltration (also referred to as constant volume diafiltration) involves
washing out the original buffer salts (or other low–molecular weight species) in the retentate (sample) by
adding solvent to it at the same rate filtrate is generated. As a result, the Liquid is added at the same rate
as filtrate is generated, and when the volume of filtrate collected equals the starting retentate volume, 1
Diavolume has been processed. Using continuous diafiltration, over 99.5% of a 100% permeable solute
can be removed by washing through multiple volumes with the solvent or buffer of choice. It takes very
high volumes of solvent to completely wash a partially permeable molecule through the membrane than it
does to remove a 100% permeable molecule from a mixture [47].
Diafiltration is a perspective approach for successful fractionation and following concentration of
multicomponent solutions such as plant extracts. For instance the dual membrane diafiltration is a
promising method for membrane separation and concentration. It comprises a separation step, where
lower molecular weight compound is separated from higher molecular weight compound, followed by a
solvent recovery step, where the lower molecular weight compound is retained by the membrane,
allowing the solvent to be recycled into the first stage. Diafiltration was used to separate caffeic from
rosemarinic acid, extracted from rosemary. Membrane concentration of antioxidants from Castanea sativa
diafiltration process with PES membranes increased the antioxidant properties of the concentrated streams
[48,49].
This work aims to combine the understanding of science of phenolic compounds and utilization of
membranes to separate and fractionate the discrete classes of phenolic compounds. In this tarmac of
study, the optimization of the extracting solvent is evaluated for the release of phenolic compounds from
the grape pomaces and subjected to membrane processing. 4 different membranes (tight ultrafiltration
membrane of Nadir UP_005 and organic solvent nanofiltration membranes of Solsep NF 010306,
Duramem 500 and Duramem 900) are screened for the separation and subsequent fractionation of
monomeric and oligomeric flavan-3-ols from the polymeric flavan-3ols and later the extracts are
characterized by various methods. Finally, a comparison in the performance of organic solvent
2. Materials and Methods:
2.1
Materials
The reagents used were ethanol (Panreac, Spain, 99.5% purity), methanol (Pancreac, Spain, 99& purity,
Folin-Ciocalteu reagent (Panreac, Folin-Ciocalteu DC), HCl, H2SO4, diethy ether, ethyl acetate, acetone
were purchased from Merck (Darmstadt, Germany), gallic acid monohydrate (Sigma–Aldrich, ≥99%),
Vanillin (Merck, Darmstadt, Germany), Sep-Pak Plus C18 cartridges WAT 036810 and WAT 036800
were obtained from Waters (Milford, MA).
The grape pomace is the solid material obtained from crushing and destemming the grapes followed by
fermentation and finally pressing the wine, as described in Brazinha et al [50]. The grape pomace from
grapes Vitis vinifera variety Tempranillo (known worldwide and very common in Portugal) was kindly
provided by Esporão S.A. from the winery Herdade do Esporão, Reguengos de Monsaraz, Alentejo (south
of Portugal).
The flat sheetmembranes used in this work and their characteristics are shown in Table 1. As this work
aims at separating small molecules, specifically the oligomer and monomeric flavan-3-ols from crude
grape pomace extracts, all selected membrane are nanofiltration membranes with small pores appropriate
for separating small molecules, except Nadir UP 005 which is a very tight ultrafiltration membrane. The
membranes are also all stable in ethanol. Nadir UP005, although used for processing aqueous solutions,
was reported to be stable in a solution of 70% ethanol in water. The others membranes are organic solvent
nanofiltration membranes, suitable for processing solutions with pure ethanol as solvent.
Table 1. Characteristics of the membranes studied
Membrane Producer Membrane
material Retention data
Maximum temperature
(ºC)
Maximum pressure
(bar)
Nadir UP 005
MICRODYN-NADIR GmbH PES on PE/PP 5000
(a) 95 5
Solsep
NF010306 SolSep BV Not available (b) 150 40
Duramem 500 Evonik Modified
Polyimide
500(c) 50
50
20
(a) MWCO (MW at which 90% rejection is obtained) when the processing solution has water as solvent
(b) when the processing solution has ethanol as solvent, an oily molecule with MW around 1000 Da are
retained 80% and a colorant with MW around 500 Da are retained higher than 99%
(c) MWCO of styrene oligomers dissolved in acetone
Legend: MWCO molecular weight cut-off, PES Polyethersulfone, PE/PP Polyethylene/Polypropylene
2.2
Experimental
Procedure
2.2.1. Grape pomace pre‐treatment
The raw material, grape pomaces was dried for 72 h in a hot air oven at 37°C and then milled to a fine
powder form using a small grinding coffee mill.
2.2.2.DifferentmethodsofExtractionofPhenolicCompoundsfromGrapePomace
2.2.2.1 Optimization of the hydro-ethanolic extracting solvent in solid-liquid extractions using
Soxhlet experimental unit
The Soxhlet experimental unit of extraction method was used to determine the most effective composition
of hydro-ethanolic extracting solvent for extracting maximized phenolic compounds, by using different
extracting media (aqueous solutions of 20% wt ethanol, 40% wt ethanol, 60% wt ethanol and 80% wt
ethanol). In these Soxhlet experiments, the balloon containing the extracting media was immersed in an
oil bath maintained at a temperature of 120 °C, a sufficiently high value to promote the evaporation of
extraction media, with constant stirring at 350 rpm (IKA RCT Basic, IKA, Germany). The solids were
placed in the Soxhlet apparatus. The time of extraction was 8 hours and the weight ratio of the extracting
medium and the dried and milled grape pomace was 8:1.
2.2.2.2 Bourzeix method
The phenolic compounds from dried and milled grape pomace were extracted using the method described
by Bourzeix et al. [51]. The solids (7.0 g) were immersed in 20 mL of methanol, 1 g/L of ascorbic acid
was added to avoid oxidation and the resulting suspension was stored at -24 °C for 24 h. Later, the
supernatant was decanted, and the residue was extracted with 20 mL of methanol/water (80/20, %v/v) for
4 h. In the next stage, the supernatant was again decanted and the residue was treated with 20 mL of
methanol/water (50/50, % v/v) for another 4 h. Furthermore, the process was repeated with 20 mL of
distilled water at -24 °C for 15 h. Finally, the residue was extracted with 20 mL of acetone/water (75/25,
% v/v). The nitrogen atmosphere was maintained throughout the extraction. Care was taken not to disturb
extracting solvent by using rotary evaporator for maintaining constant ratio in all the methods of
extraction.
2.2.2.3 Solid-liquid extraction at 40°C
For ensuring maximum extraction of phenolic compounds including those that are thermosensitive, a
simple solid liquid extraction was performed. The dried and milled grape pomace solids along with the
extracting media were placed in an airtight balloon which was immersed in an oil bath (IKA RCT Basic,
IKA, Germany). The temperature of the bath was maintained at 40 °C with constant stirring at 350rpm.
The extraction was performed for a period of 72 h in the dark. The weight ratio of the solids to the
extracting media was maintained at 1:8 throughout all extraction experiments.
2.2.3. Extracts pretreatment before membrane processing
The extracts obtained were centrifuged for 45 minutes, at 20ºC and 8000 rpm, for removing suspended
solids. Nitrogen was passed through the samplesbefore freezing them at -20°C for storage before further
use.
2.2.4. Membrane Processing
The membrane unit used was operated in a dead-end mode with a gas control unit (METCell, Membrane
Extraction Technology, UK) and flat membranes with an effective membrane area of 51.4 cm2. The
control of the temperature in the concentrate was carried out by immersing the membrane module in a
controlled temperature bath and permeate was measured by an electronic balance (Kern 572, Kern,
Germany).
The membrane experiments operated in the concentration mode were carried out at 40ºC; the feed
vessel was stirred at 450 rpm, processing 150 mL of crude grape pomace extract. The membranes were
conditioned prior to processing the crude extracts, at a higher transmembrane pressure than the value used
when processing crude extracts. The transmembrane pressures were of 3 bar for Nadir UP 005, 25 bar for
Solsep NF010306, 8 bar for Duramem 500 and 8 bar for Duramem 900. The crude extracts were
processed until a Final Concentration FC (-) of 6 was reached. This signifies the ration between retentate
and initial feed.
A nanofiltration experiment operated in the diafiltration mode (diananofiltration) was carried out at the
same temperature, under the same stirring conditions, using Duramem 900 at the same transmembrane
added to the initial feed solution) was reached. In diafiltration operation, the feed volume should always
be constant, so the amount of solvent added during each experiment is equal to the amount of permeate.
The permeability Lp (t) is related to volume V (t), time (t) and membrane area (A), pressure (P) was
calculated through the following equation:
Lp(t) [L/m2/h/bar]
P t A
t V
* *
) (
(1)
The observed rejection of phenolic compounds as function of the concentration factor in the membranes
studied. The observed rejection is calculated through the following equation:
Ri
feed i
perm i
c c
, ,
1
(2)
2.3.
Analytical
Methods
2.3.1MeasurementoftotalphenoliccontentbythemethodofFolin‐Ciocalteu,theGlories’ method and the spectrophotometric test at 280 nm
The content of the extracts in total phenolic compounds was determined by the method of
Folin-Ciocalteu proposed by Slinkard et al with slight modification [52]. Briefly, 1.58ml of water, standard or
sample extract (20 μl) and 100 μl of FC reagent were mixed. Then, 300 μl of Na2CO3 solution (7.5%,
w/v) was added and allowed to stand for 30 min at 40°C digestor. Absorption was measured at 765 nm in
a spectrophotometer. Gallic acid was used as a standard and the Total Phenolic Content was expressed as
Gallic Acid equivalent (GAE) in mg/g of raw material.
Total phenolic content was also measured using a modified version of the Glories’ method [53,54]
described in Mazza et al. [55]. Briefly, the method consisted of mixing 0.25 mL of sample with 0.25 mL
of 0.1% HCl in 95% ethanol and then further addition of 4.55 mL of 2% HCl. The absorbance of the
solution was then read at 280 nm to measure the total phenolics. The results were also represented as
Gallic Acid equivalents.
Somer’s et al proposed a spectrophotometric test at 280 nm, in which the total phenolic content
presented [56]. Hence, the grape pomace samples were diluted and analyzed in Deuterium Lamp at 280
nm. The results were also represented as Gallic Acid equivalents.
2.3.2MeasurementofanthocyaninsandpolymerizationindexbySomer’sMethod
Somer’s et al had extensively studied the anthocyanins equilibria and established a relatively easier
method for the quantitative and qualitative determination of various aspects of anthocyanins [56]. In our
work, the measurement of total anthocyanins was calculated. In brief, the method consisted of
centrifuging the samples for 10 mins at 4000 rpm. 0.1ml of sample was mixed with 10 ml of 1M HCl and
kept for 3 hours in water bath at 25°C. Samples were then measured in spectrophotometer at 520 nm
using 1M HCl as reference solution. Later, 5μL of sodium disulphite (N2O5S2) was then injected into the
sample and then read again at 520nm using water as blank solution.
The total anthocyanins were calculated using the following formula:
Total Anthocyanins (mg/L of extract) * ))*20
3 5
( 2 5 2 520 520
S O N HCl
A
A (3)
2.3.3 Measurement of proanthocyanins by the Tannin Power Method
The tannin-specific activity (TSA) of grape pomace extract was determined by nephelometry as described
by De Freitas and Mateus[57]. This method is based on the characteristic property of proanthocyanins to
interact and precipitate proteins. The extract solutions supplemented with condensed tannins were diluted
to 50 times with filtered model solution (12% ethanol, 5.0 g/L tartaric acid, pH 3.20). Later, 4.0 mL of
this solution were transferred to a test tube and mixed with 150 μL of Bovine Serum Albumin (BSA). The
test tube was kept in the dark for 30 min. The extract solutions with and without BSA were measured for
its maximum turbidity in a turbidometer. The difference of the values corresponds to the overall turbidity
of the sample. The TSA is expressed in turbidity units NTU/mL of pomace extract and is determined by
the following expression, where 0.08 corresponds to the dilution factor of wine:
Turbidity (NTU/ml)
08 . 0
sample
Turbidity
(4)
2.3.4Measurementofthemonomeric,oligomericandpolymericflavan‐3‐olsbythevanillin assay with a prior fractionation of the monomeric, oligomeric and polymeric fractions in C18 Sep‐Pak Cartridges
The extracts of feed, retentate and permeate were fractionated by Waters C18 Sep-Pak cartridges
(Waters, Milford, MA) by following the method described by Sun et al. [58]. Depending on the intensity
of the colour of permeate, either 5 ml or 10 ml of permeate and owing to dark colour of feed and
retentate; 5ml of feed and retentate were concentrated to dryness using a rotary evaporator at <30 °C.
After evaporation, the residue was dissolved in 20 mL of phosphate buffer pH 7. If required, the pH was
adjusted to pH 7.0 with NaOH or HCl solutions. Two C18 Sep-Pak cartridges were connected in series
(top, Waters Sep-Pak Plus tC18 environmental cartridge; bottom, Waters Sep-Pak Plus C18 cartridge).
The cartridges were conditioned with methanol (10 mL), distilled water (20 mL), and phosphate buffer
pH 7.0 (10 mL). After the cartridges were conditioned, the samples were then passed at a flow rate not
higher than 2 mL/min. Later, 10 mL of phosphate buffer at pH 7.0 was passed to eliminate the Phenolic
acids. The cartridges were then dried with N2 for 90 mins. The elution of monomeric and oligomeric
flavan-3-ols (fractions FI + FII) was ensured by passing 25 mL of ethyl acetate, followed by the elution of
polymeric proanthocyanidins (fraction FIII) with 15 mL of methanol. The ethyl acetate fraction (fractions
FI + FII) were dried in rotary evaporator and then redissolved in 3 mL of phosphate buffer, pH 7.0, and
finally redeposited onto the same series of cartridges preconditioned as described above. The cartridges
were again dried with N2 for 90 mins, and monomers (FI) were separated from oligomers (FII) by
sequential elution with 25 mL of diethyl ether and 15 mL of methanol. The three fractions (FI, FII and
FIII) were evaporated to dryness under vacuum and redissolved in 3 mL of methanol. Sample
fractionation was performed in duplicate.
The determination of the total flavan-3-ol content of the monomeric, oligomeric and polymeric
fractions by vanillin assay was performed according to the method described by Sun et al. [59]. A 2.5 mL
portion of H2SO4/methanol (25/75, % v/v) solution and 2.5 mL of 1% (w/v) vanillin in methanol were
added to 1 mL of the sample. For blank solution, only methanol was added instead of vanillin. For FI
fractions, the absorbance at 500 nm was read after a reaction time of 15 min at 30 °C using a Unicam
UV-vis UV4 spectrophotometer (Unicam, Cambridge, U.K). For FII and FIII fractions, upon the addition of
vanillin solution in sample at room temperature, it was quickly placed in spectrophotometer until the
maximum absorbance value at 500 nm was reached. Quantification was performed by means of standard
previously described [59]. The fractionated phenolic content is related to the volume of methanol for diluting the dry sample Vrs (ml), absorbance at 500 nm, volume of extracting solvent Vext (ml), Slope of
standard curve of various fractions ‘b’ [F1‐ 0.0081, F2‐ 0.0046, F3 ‐ 0.0037], initial volume of sample evaporated in rotavapour Tsample (ml) and initial quantity of powdered extract taken Msample (g). The
formula used to calculate the different fractions is:
Fractionated Phenolic Content (mg/g) =
*
*
*
1000
*
*
sample sample
ext rs
M
T
b
V
Abs
V
(5)
3. Results and Discussions:
3.1
Optimization
of
the
hydro
‐
ethanolic
extracting
solvent
The effect of the hydro-ethanolic extracting solvent and the time of extraction on the extraction efficiency
of total phenolic compounds using Soxhlet experimental unit were studied. Kinetics were performed on
the production of extracts at the same weight ratio of extracting medium to grape pomace of 8, during 8
hours, at different extracting media (20% wt, 40% wt, 60% wt and 80% wt of ethanol in water).
The extracts were analysed after each cycle of Soxhlet (each hour) in terms of the content in total
phenolic compounds measured by the method of Folin-Ciocalteu and the Glories’ method (the most
common methods) and the spectrophotometric test at 280 nm (the simplest method). Owing to the
phenomenal chemical diversity of the phenolic compounds present, there is no method that offers
accurate measurement of the total phenolic content [56].
It was interesting to note in (figure 1) that there indeed exists reliability while comparing these three
methods for measurement of total phenolics. The bars represent the standard deviation of total phenolics
with respect to Gallic Acid Equivalent (mg/g of dried pomace). It can be seen that the variation of
standard deviation is in the range of 0.74 – 4.9 mg/g of dried pomace upon comparison of all the three
tests performed affirming the similarity in results amongst the techniques used. Thus, direct spectral
reading at 280 nm can be considered as the appropriate method for measurement of total phenolic content
as it is very rapid and simple compared to the complexities in preparation of sample required for
Folin-Ciocalteau and Glories tests.
From the (figure 1), it is interesting to see that lower ethanol composition serves better extraction leading
to a greener method. Nevertheless, two important things to note are that 40% wt ethanol serves as the
optimized extracting solvent with a greater margin compared to 20% wt, 60% wt and 80% wt ethanol.
Also, the extraction time leads to near stability after 7-8 hours by Soxhlet experiment and thus,
Figure 1.Optimization of extracting solvent and extraction time using a Soxhlet unit for different compositions of ethanol‐water mixtures
Legend: The standard bars represent the standard deviation of values obtained by Folin Ciocalteau test, Glories test and
Spectrophotometric test at A280 for measurement of total phenolic content [GAE] mg/g of dried pomace.
3.2.
Comparison
of
different
methods
of
extraction
The researchers specifically from the field of Agronomy and Enology use the classical Bourzeix’s method
for extraction of phenolic compounds from the pomaces [58,60,61,63]. This well established method is
proved time and again for its effective extraction capability by using majorly methanol and also acetone
as extracting solvents. However, one of the important facets in the framework of this work was to
incorporate ethanol-water mixture because of its biocompatible nature. Hence, a cross study of
comparison was done for 3 different methods of extraction namely, solid-liquid hydro-ethanolic
extraction with Soxhlet, classical Bourzeix’s method and solid-liquid hydro-ethanolic extraction at 40°C.
The comparison of its capability of extraction of different classes of phenolic compounds was analysed by
using the following measurements: total phenolic content by spectrophotometric analysis, total
anthocyanins measurement [56] and proanthocyanins [57].The results are discussed in (figure 2).
0.00 5.00 10.00 15.00 20.00 25.00 30.00 35.00 40.00 45.00
3 4 5 6 7 8
[Gallic
acid
eq]
mg/g
of
dried
pomace
Time [hours]
20% Ethanol
40% Ethanol
60% Ethanol
Figure 2. Comparison of different methods of extractions: concentrations of different classes of phenolic compounds (target compounds) in grape pomace extracts obtained by different methods of extraction
As seen in (figure 2), for the measurement of total anthocyanins and proanthocyanins, it is remarkable to
observe that solid-liquid hydro-ethanolic extraction distinguished itself as the most appropriate method of
extraction. The fact that its total phenolic content value was slightly lesser than Bourzeix’s method shows
that the use of the total phenolic compounds as an indication of the presence of proanthocyanins has to be
taken cautiously; total phenolic compounds present in a sample may be due to others classes of phenolic
compounds, such us non-flavonoids like phenolic acids and stilbens.
As expected, the solid-liquid extraction using Soxhlet experimental unit was least effective in comparison
with the other methods as reports confirmed that temperature above 45°C proved progressive destruction
for not only anthocyanins (acylated monoglucosides of anthocyanins [56] but also proanthocyanins
(trimer procyanidins) [64]. However, the advantage of using this Soxhlet unit for solid-liquid extraction is
the extraction time that requires only 8 hours compared to 3 days for solid-liquid hydro-ethanolic
extraction at 40°C and 5 days for Bourzeix’s method. Furthermore, the feed solutions obtained from 40%
wt ethanol extracting solution at 40°C and from Soxhlet were subjected to fractionation of monomeric
(FI), oligomeric (FII) and polymeric (FIII) fractions of phenolic compounds enriched in flavan-3-ols and
the absolute values obtained were compared as shown in (Table 2).
0.00 20.00 40.00 60.00 80.00 100.00 120.00
Total Phenolic Content [mg/g]
Total Anthocyanins [mg/L]
Tannin Power [NTU/ml]
Absolute
values S‐L Extraction (120 °C)
S‐L Extraction (40 °C)
Table 2. Comparison of the fractionated phenolic compounds at different temperatures
Solid-Liquid
Extraction at 40% wt
ethanol
Fractionated Phenolic Compounds
(mg/g)
Monomeric
fractions
FI (mg/g)
Oligomeric
fractions
FII (mg/g)
Polymeric
fractions
FIII (mg/g)
(with soxhlet) 0.37 0.69 6.10
(without soxhlet) 40°C 0.40 2.23 11.93
The above values in the table corresponds to the flavan-3-ols profiles obtained by Monagas et al in a
similar study to identify the individual amounts of fractionated phenolic compounds obtained from grape
skins [60]. Thus, the present work incorporates the Soxhlet unit for fast screening of membranes as the
feed solution can be easily obtained for membrane processing in lesser time. However, owing to its
reliable, biocompatible and effective method of extraction of different classes of phenolic compounds,
solid-liquid hydro-ethanolic extraction at 40°C (ethanol 40% wt) was chosen as the most appropriate
extraction method.
3.3
Screening
of
Commercial
Organic
Solvent
Ultra
and
Nanofiltration
membranes
With the objective of permeating the monomeric and oligomeric phenolic compounds to separate them
from the crude grape pomace extract, different membranes with different pore size, material and chemical
nature were processed with extracting solution at 40°C and 400 rpm in Metcell. The transmembrane
pressures were of 3 bar for Nadir UP 005, 25 bar for Solsep NF010306, 8 bar for Duramem 500 and 8 bar
for Duramem 900.
The permeabilities of the different membranes and their observed rejections of total phenolic
compounds measured by direct spectral reading at 280 nm over the Final Concentration FC are shown in
(Figure 3 and Figure 4) respectively. The interpretations of these graphs add as supporting parameters
Figure 3. Permeability vs. Final Concentration for Nanoiltration membrane experiments
Legend: FC [-] is the ratio between initial feed and retentate
Figure 4. Instantaneous Observed Rejection vs. Final Concentration FC [‐]
Legend: FC [-] is the ratio between initial feed and retentate
It can be seen in the above figures that permeabilities are related to the pore size of the membranes. The
higher the pore size, the better is the permeability value. Since the feed solution of crude extract contain
higher percentages of polymeric phenolic compounds which are bigger in size, the 500 dalton membranes
are prone to fouling and its subsequent lower permeability. Furthermore, the rejections of phenolic
molecules are almost similar for the three membranes. Nevertheless, Duramem 900 has distinguished
60% 65% 70% 75% 80% 85% 90% 95% 100%
0 1 2 3 4 5 6
Instantaneou
s
Observed
Rejection
Final Concentration FC [‐]
Duramem 500
Duramem 900
Solsep NF 010306
itself to permeate more molecules. However, the permeating molecules are monomeric, oligomeric or
polymeric can be confirmed by the experiments that follow below. Also, the membrane conditioning was
done effectively with 40% wt ethanol to all the membranes and after the processing is completed, the
membranes showed significant closing of global masses balances at the initial feed and final combined
retentate and permeate.
3.3.1 Comparison of the Global Observed Rejections of Anthocyanins and Proanthocyanins
The Somer’s and the Tannin Power methods were performed in the same way as discussed before and the
global retentate and global permeate streams of all the four membranes were analyzed. The results of
measurement of total anthocyanins and proanthocyanins and their rejections are represented in (Table 3).
Table 3. Measurement of Total Anthocyanins and Total Proanthocyanins and their Global Observed
Rejection Coefficients for the different membranes
Membrane
Anthocyanins Proanthocyanins
Retentate Permeate Observed
Rejection
Retentate Permeate Observed
Rejection
Nadir UP_005 400.23 12.12 96.97 % 82.63 3.50 95.76 %
Solsep NF 010306 478.97 52.52 89.03 % 101.25 5.88 94.19 %
Duramem 500 645.39 2.02 99.68 % 105.75 10.75 89.83 %
Duramem 900 591.90 18.20 96.92 % 116.38 8.13 93.01 %
In the above table, it can be seen that Solsep NF 010306 is relatively rejecting lesser anthocyanins which
are polymeric flavan-3-ols which is not good for our objective of work. Proanthocyanins are known to
exist both in oligomeric and polymeric form and hence, its rejection value interpretation can be done after
performing fractionation of individual classes of phenolic compounds.
3.3.2 Fractionation of Phenolic Compounds by C18 Sep‐Pak Cartridges
For having a concrete screening of the membranes, the individual fractionated amounts of monomeric,
oligomeric and polymeric flavan-3-ols are of importance. Polymeric proanthocyanins with degree of
polymerization (DP>5) are very difficult to resolve by HPLC techniques when compared to simple
oligomers. Therefore, purification techniques such as normal-phase HPLC, adsorption chromatography
mixtures of polymeric phenolic compounds [61,62]. Thus, in our study, C18 Sep-Pak cartridges were
incorporated and the results are depicted in (Table 4).
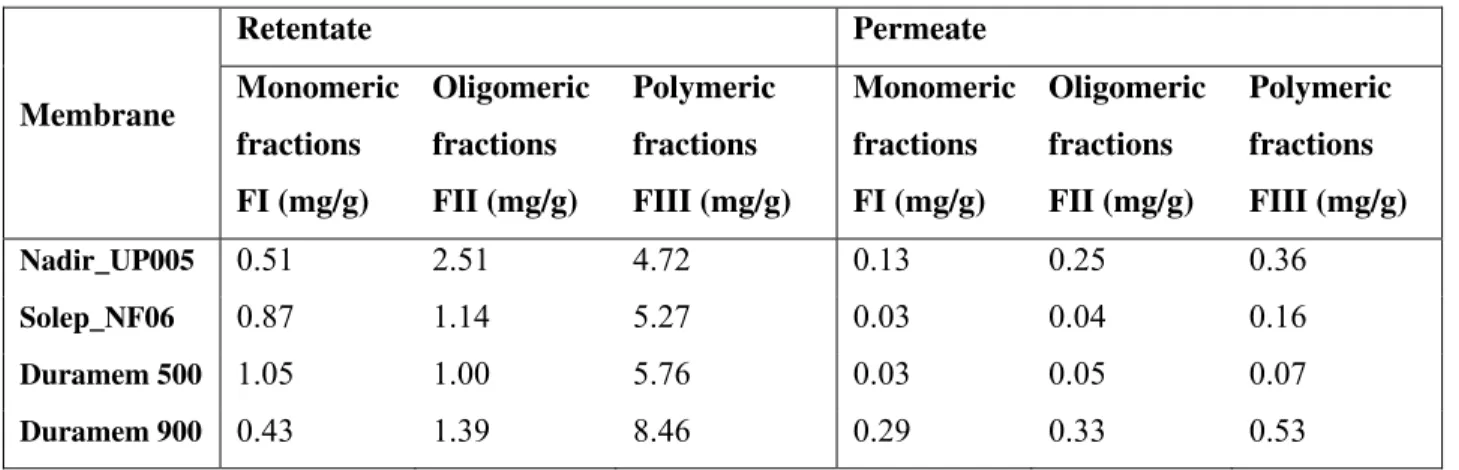
Table 4. Fractionated phenolic compounds of different membranes
Membrane Retentate Permeate Monomeric fractions FI (mg/g) Oligomeric fractions FII (mg/g) Polymeric fractions FIII (mg/g) Monomeric fractions FI (mg/g) Oligomeric fractions FII (mg/g) Polymeric fractions FIII (mg/g)
Nadir_UP005 0.51 2.51 4.72 0.13 0.25 0.36
Solep_NF06 0.87 1.14 5.27 0.03 0.04 0.16
Duramem 500 1.05 1.00 5.76 0.03 0.05 0.07
Duramem 900 0.43 1.39 8.46 0.29 0.33 0.53
From the above figure, it can be seen that Duramem 900 made up of modified polyimide, hydrophobic
nature with apparent MWCO 900 daltons is relatively the most appropriate membrane. It has retained a
lot of polymeric phenolic compounds and allowed to permeate higher monomeric and oligomeric
fractions compared to other membranes. A graph of global observed rejection in (figure 5) for FI, FII and
FIII fractions of different membranes states that Duramem 900 can be chosen as basis for the screening
procedure.
Figure 5. Comparison of Global Observed Rejection Coeffcients of FI, FII and FII by different membranes
Legend: FI – monomeric flavan-3-ols, FII – oligomeric flavan-3-ols, FIII – polymeric flavan-3-ols
0.80 0.85 0.90 0.95 1.00
Nadir_UP005 Solsep_NF06 Duramem 500 Duramem 900
Global Oberved Rejection Coefficients
Observed
Rejection
for
FI,
FII
and
FIII
of
different
membranes
FI
FII
3.4
Nanofiltration
vs.
Diananofiltration
Feed obtained by solid-liquid extraction with 40% wt ethanol using soxhlet experimental unit was used
for fast screening of most appropriate membrane. However, once the Duramem 900 membrane was
selected, it was processed with feed extract obtained by solid-liquid extraction with 40% wt ethanol for 3
days. Once the most effective extraction method and most appropriate membrane were chosen, it was
subjected to Nanofiltration and Diananofiltration membrane processing. With the objective of study of
diananofiltration, unfolding of differences in values of all the characterization results would ensure the
advantageous usage of diananofiltration for commercial purposes.
3.4.1ComparisonofPermeabilitiesfornanofiltrationanddiananofiltration
The Duramem 900 was subjected to nanofiltration with membrane processing conditions same as the
previous one. Later on, with second flat sheet Duramem 900 membrane, diafiltration was performed
which is based on keeping uniform volume of feed throughout the experiement for two diafiltration
volumes. The diluent used was the same solution used for membrane conditioning which is 40% wt
ethanol.
Figure 6. Permeability vs. Final Concentration for Nanofiltration experiment
Legend: FC [-] is the ratio between initial feed and retentate
0 0.1 0.2 0.3 0.4 0.5 0.6 0.7
0 1 2 3 4 5 6 7
Permeability
[L/m2/h/bar]
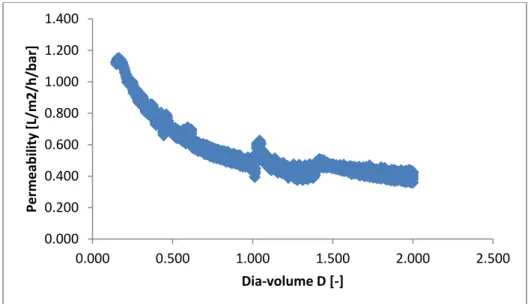
Figure 7. Permeability vs. Dia‐volume for diananofiltration experiment
Legend: D [-] is the ratio of solvent added to initial feed solution
From the figures 6 and 7, it can be seen that the permeability of the nanofiltration is much lesser than
diananofiltration. In both the filtration techniques, the gradual decrease of permeability over time is the
result of the fouling mechanism that occurs. However, the diafiltration has constant initial volume and is
kept diluted with the diluent and hence the fouling is controlled to a greater extent. This is one of the
major advantages of using diafiltration technique when compared to the normal filtration. This
phenomenon plays a vivid role in the rejection of molecules. Further characterization and fractionation
results give a better understanding of this concept.
3.4.2 Comparison of the Global Observed Rejections of Anthocyanins and Proanthocyanins
The Somer’s and the Tannin Power methods were performed in the same way as discussed before and the
global retentate and global permeate streams were analyzed. The results of measurement of total
anthocyanins and proanthocyanins and their rejections are represented in (Table 5).
Table 5. Measurement of Total Anthocyanins and Total Proanthocyanins and their Global Observed
Rejection Coefficients for nanofiltration and diananofiltration
Membrane Total Anthocyanins [mg/ml] Total Proanthocyanins [NTU/ml]
Duramem 900 Retentate Permeate Observed
Rejection
Retentate Permeate Observed
Rejection
Nanofiltration 508.53 20.20 96.02 % 196.25 3.00 98.47 %
Diafiltration 68.67 22.22 94.61 % 39.25 3.13 98.67 %
0.000 0.200 0.400 0.600 0.800 1.000 1.200 1.400
0.000 0.500 1.000 1.500 2.000 2.500
Permeability
[L/m2/h/bar]
Since the feed is continuously diluted in diafiltration keeping the uniform volume, the final higher values
of anthocyanins and proanthocyanins in nanofiltration experiments are because of its FC [-] to be 6. It can
be seen that anthocyanins are highly rejected in both the filtration techniques. However, a higher rejection
in proanthocyanins in both the filtration modes is not entirely desirable as proanthocyanins can occur in
both oligomeric and polymeric forms and the former are interested in our work. Hence, for better
judgement of appropriate method for filtration, the retentate and permeate streams containing phenolic
compounds were fractionated by C18 Sep-Pak cartridges.
3.4.3FractionationofPhenolicCompoundsbyC18Sep‐PakCartridges
The monomeric (FI), oligomeric (FII) and polymeric (FIII) fractions obtained from retentate and permeate
streams of nanofiltration and diananofiltration techniques were fractionated and the results are seen in
(Table 6).
Table 6. Fractionated phenolic compounds of different membranes
Duramem 900 membrane Retentate Permeate Monomeric fractions FI (mg/g) Oligomeric fractions FII (mg/g) Polymeric fractions FIII (mg/g) Monomeric fractions FI (mg/g) Oligomeric fractions FII (mg/g) Polymeric fractions FIII (mg/g)
Nanofiltration 0.51 3.63 16.44 0.26 0.84 0.35
Diafiltration 0.22 4.02 11.38 0.30 1.12 0.15
Figure 8. Comparison of Observed Rejection of FI, FII and FII by Nanofiltration and Diananofiltration
Legend: FI – monomeric flavan-3-ols, FII – oligomeric flavan-3-ols, FIII – polymeric flavan-3-ols
0.00 0.20 0.40 0.60 0.80 1.00
Nanofiltration Diafiltration
From the figure we can see that with diafiltration mode of operation is relatively effective compared to
the nanofiltration from the perspective of fractionating monomeric and oligomeric phenolics into the
permeate stream. Thus, the higher rejection of monomeric and oligomeric flavan-3-ols in the
nanofiltration process in the dead end system can be attributed to the fact that there is a formation of
solute film consisting mainly of the higher molecular weight fractions which contributes to the resistance
4. Conclusion:
The study derives strength for the research activity from the ‘biobased’ economy which mimics the
natural ecosystems – reuse, recover and regenerate; the areas which will be explored to find a value
addition to the thousands of tons of grape pomace residue generated every year by the juice and
winemaking industry. Additionally, it incorporates prudently the use of membrane technology as a clean
and effective way of separation and fractionation of bioactive molecules known to have myriads of
benefits in the health sector.
In the present work, optimizations of several parameters were carried out that play a significant role in
achieving the desired concentration and fractionation of monomeric and oligomeric flavan-3-ols. The
primary step was to efficiently extract the phenolic compounds from the solid parts of the grape pomace.
In this context, one of the key issues of this work was to keep the process commercially attractive by
having biocompatible solvents for extraction. Thus, studies were carried out to access the optimum
composition of hydro-ethanolic extracting media that has maximum extracting capability. Results showed
that 40% wt ethanol was the most effective mixture and corroborates the fact of a having a greener
method of extraction.
Furthermore, there was a comparative study of the three different methods of extraction. Kinetics of
extraction in Soxhlet was studied and optimum extraction time was 8 hours. As it was a quicker method,
it was employed in fast screening of membranes. However, solvent extraction at 40°C was more effective
in the extraction of phenolic compounds from the industrial waste of grape pomace.
The total phenolics were measured by using 3 different methods namely the Folin Ciocalteau test, Glories
test and Spectrophotometric test at 280 nm. It was remarkable to observe the similarity in results with
Gallic Acid Equivalents having standard deviation range of 0.79-4.9 mg/g of dried pomace. Thus, the
latter method was well accepted for being simple, fast and reliable.
The crude extracts were subjected to process screening with 4 different types of membrane. The observed
rejection coeffiecients in the Nadir UP_005, Solseo NF 010306, Duramem 500 and Duramem 900 were
found to be in the range of 65% to 80% at FC [-] of 6. The measurement of anthocyanins and
proanthocyanins at the retentate and permeate streams were done to obtain a supporting data for
interpretation of screening procedure. Finally, the monomeric, oligomeric and polymeric fractionation of
flavan-3-ols by C18 Sep-Pak cartridges revealed that Duramem 900 was most appropriate membrane for
At the end, the most effective method of extraction and the most appropriate membrane was subjected to
comparative studies of organic solvent nanofiltration and diananofiltration. It was clearly illustrated in
diafiltration studies that reduced fouling; better permeability and diluted feed streams attributed the fact of
lower rejections of monomeric and oligomeric phenolic compounds and higher rejection of polymeric
fractions in comparison to the nanofiltration. It could be interesting to carry out the study at pilot scale
and also access the bioactivity of the extracted flavan-3-ols.
Further study:
The monomeric and oligomeric fractions of flavan-3-ols obtained from the C18 Sep-Pak cartridges will
be injected into HPLC equipment loaded with few standard samples of commercially available monomers
and oligomers. This will give a better perspective to identify the individual monomers and oligomers
permeated in the nanofiltation and diananofiltration techniques. After the results are obtained, the
chemical nature and sizes of the distinctive molecules will be related to that of the Duramem 900
5. References:
1. Ali, K.; Maltese, F.; Choi, Y.; Verpoorte, R. Metabolic constituents of grapevine and grape-derived products. Phytochemistry Reviews, 2010, 9, 357–378.
2. Vivier, M.A.; Pretorius, I.S. Genetic improvement of grapevine: Tailoring grape varieties for the third millennium—A review. South African Journal of Enology and Viticulture, 2000, 21, 5–26.
3. Nassiri-Asl, M.; Hosseinzadeh, H. Review of the pharmacological effects of Vitis vinifera
(grape) and its bioactive compounds. Phytotherapy Research, 2009, 23, 1197–1204.
4. Tsao, R. Chemistry and biochemistry of dietary polyphenols. Nutrients, 2010, 2, 1231–1246.
5. Waterhouse, A.L. Wine phenolics. Annals of the New York Academy of Sciences, 2002, 957, 21–36.
6. Nguyen, D.M.; Seo, D.J.; Lee, H.B.; Kim, I.S.; Kim, K.Y.; Park, R.D.; Jung, W.J. Antifungal activity of gallic acid purified from Terminalia nigrovenulosa bark against Fusarium solani. Microbial Pathogenesis, 2013, 56, 8–15.
7. Zhao, J.; Khan, I.A.; Fronczek, F.R. Gallic acid. Acta Crystallographica Sect. E, 2011, 67, 316–317.
8. Sameer mahmood, Z.; Raji, L.; Saravanan, T.; Vaidya, A.; Mohan, V.; Balasubramanyam, M. Gallic acid protects rinm5f β-cells from glucolipotoxicity by its antiapoptotic and insulin-secretagogue actions.
Phytotherapy Research, 2010, 24, S83–S94.
9. Rather, S.A.; Sarumathi, A.; Anbu, S.; Saravanan, N. Gallic acid protects against immobilization stress-induced changes in wistar rats. Journal of Stress Physiology & Biochemistry, 2013, 9, 136–147.
10. Ananga, A.; Georgiev, V.; Tsolova, V. Manipulation and engineering of metabolic and biosynthetic pathway of plant polyphenols. Current Pharmaceutical Design, 2013, 19, 6186–6206.
11.Vogt, T. Phenylpropanoid biosynthesis. Molecular Plant, 2010, 3, 2–20.
12. Harborne, J.B.; Williams, C.A. Advances in flavonoid research since 1992. Phytochemistry, 2000, 55, 481–504.
13. Raj, N.K.; Sripal, R.M.; Chaluvadi, M.R.; Krishna, D.R. Bioflavonoids classification, pharmacological, biochemical effects and therapeutic potential. Indian Journal of Pharmacology, 2001,
33, 2–16.
15. Han, X.; Shen, T.; Lou, H. Dietary polyphenols and their biological significance. International
Journal of Molecular Sciences, 2007, 8, 950–988.
16. Alzand, K.I.; Mohamed, M.A. Flavonoids: Chemistry, biochemistry and antioxidant activity. Journal
of Pharmacy Research, 2012, 5, 4013–4012.
17. Riedel, H.; Saw, N.M.M.T.; Akumo, D.N.; Kütük, O.; Smetanska, I. Wine as Food and Medicine in
Scientific, Health and Social Aspects of the Food Industry; Valdez, B., Ed.; InTech: Rijeka, Croatia,
2012; 399–418.
18. This, P.; Lacombe, T.; Thomas, M.R. Historical origins and genetic diversity of wine grapes. Trends in Genetics, 2006, 22, 511–519.
19. Bertelli, A.A.A.; Das, D.K. Grapes, wines, resveratrol, and heart health. Journal of Cardiovascular
Pharmacology, 2009, 54, 468–476.
20. Conde, C.; Silva, P.; Fontes, N.; Dias, A.C.; Tavares, R.M.; Sousa, M.J.; Agasse, A.; Delrot, S.; Gerós, H. Biochemical changes throughout grape berry development and fruit and wine quality. Food,
2007, 1, 1–22.
21. Ratnasooriya, C.C.; Rupasinghe, H.P.V. Extraction of phenolic compounds from grapes and their pomace using β-cyclodextrin. Food Chemistry, 2012, 134, 625–631.
22. Ugartondo, V.; Mitjans, M.; Lozano, C.; Torres, J.L.; Vinardell, M.P. Comparative study of the cytotoxicity induced by antioxidant epicatechin conjugates obtained from grape. Journal of Agricultural
and Food Chemistry, 2006, 54, 6945–6950.
23. Lu, Y.;Bennick, A. Interaction of tannin with human salivary proline-rich proteins. Archives of Oral
Biochemistry, 1998, 43, 717–728.
24. Wroblewski, K.; Muhandiram, R.; Chakrabartty, A.; Bennick, A. The molecular interaction of human salivary histatins with polyphenolic compounds. European Journal of Biochemistry, 2001, 268, 4384– 4397.
25. Ayala-Zavala, J.F., Vega-Vega, V., Rosas-Domínguez, C., Palafox-Carlos, H., Villa-Rodriguez, J. A., Siddiqui, M.W., Dávila-Aviña, J. E. and G.A González-Aguilar. Agro industrial potential of exotic fruit byproducts as a source of food additives. Food Research International, 2011, 44(7): 1866- 1874.
26.Bonilla, F., Mayen, M., Merida, J. and Medina, M. Extraction of phenolic compounds from red grape marc for use as food lipid antioxidants. Food Chemistry, 1999, 66(2): 209-215.
28.Siddiqui, M. W., Chakraborty, I., Mishra, P., and Hazra. P, Bioactive attributes of tomatoes involving dg, ogc, and rin genes. Food and Function, 2014, DOI: 10.1039/C3FO60520E.
29. Freedonia, Cosmeceuticals US Industry Study with Forecasts for 2015 & 2020, Industry Market
Research Brochure, Freedonia Group. Available from:
www.freedoniagroup.com/brochure/27xx/2758smwe.pdf. Accessed 2014 February 17.
30. D. Grigonisa, P.R. Venskutonisa, B. Sivikb, M. Sandahlb, C. S. Eskilssonc, “Comparison of different extraction techniques for isolation of antioxidants from sweet grass (Hierochloë odorata)”, The Journal
of Super critical Fluids, 2005, 33:3, 223-233
31. J. A. Michiels, C. Kevers, J. Pincemail, J. O. Defraigne, J. Dommes, “Extraction conditions can greatly influence antioxidant capacity assays in plant food matrices”, Food Chemistry, 2012, 130: 4, 986-993.
32. K. Zhou, L. Yu, “Effects of extraction solvent on wheat bran antioxidant activity estimation”, LWT -
Food Science and Technology, 2004, 37:7, 717-721
33. G Spigno, L. Tramelli, D. M. De Faveri, “Effects of extraction time, temperature and solvent on concentration and antioxidant activity of grape marc phenolics”, Journal of Food Engineering, 2007, 81: 1, 200-208.
34. N. E. Durling, Owen J. Catchpole, John B. Grey, Rosemary F. Webby, Kevin A. Mitchell, L. Yeap Foo, Nigel B. Perry, “Extraction of phenolics and essential oil from dried sage (Salvia officinalis) using ethanol–water mixtures”, Food Chemistry, 2007, 101:4,1417-1424.
35. M. Alothman, B. Rajeev, A.A. Karim, “Antioxidant capacity and phenolic content of selected tropical fruits from Malaysia, extracted with different solvents”, Food Chemistry, 2009, 115:3, 785-788.
36. Makris DP, Boskou G, Andrikopoulos NK, Recovery of antioxidant phenolics from white vinification solid by-products employing water/ethanol mixtures. Bioresource Technology, 2007, 98: 2963–2967.
37. G. Yang, R.A. Wang, The supercritical fluid extractive fractionation and the characterization of heavy oils and petroleum residue, Journal of Petroleum Science and Engineering, 1999, 22 (1–3), 47–52.
38. S. Ochiai, Propolis food producing method and propolis food, USA Patent 5,692,685 (1997).
39. Z. Sosnowski, Method for extracting propolis and water soluble dry propolis powder, USA Patent 4,382,886 (1983).
40. I. Vincze, G. Vatai, Application of nanofiltration for coffee extract concentration, Desalination, 2004,