Article
Printed in Brazil - ©2017 Sociedade Brasileira de Química0103 - 5053 $6.00+0.00*e-mail: [email protected]
Grape and Apple Pomaces from Southern Brazil: Valorization of By-Products
through Investigation of Their Antioxidant Potential
Mariéli Karling, Thariane C. Bicas, Vanderlei Aparecido de Lima and Tatiane Luiza C. Oldoni*
Departamento de Química, Universidade Tecnológica Federal do Paraná (UTFPR), 85503-390 Pato Branco-PR, Brazil
The extraction process of bioactive compounds from grape and apple pomaces was optimized using a response surface methodology to evaluate the effect of ethanol concentration, time and temperature on the extraction of total phenolic content, antioxidant activity by radical scavenging 2,2-diphenyl-1-picrylhydrazyl hydrate (DPPH) method and individual phenolics by high performance liquid chromatography (HPLC). Optimizing suggests that the best condition for total phenolic and gallic acid extraction from grape pomace was obtained in intermediate level (60% ethanol, 60 °C, 30 min) while 80% ethanol, 75 °C and 39 min was more efficient for p-coumaric acid extraction. For apple pomace the extract obtained with 50% ethanol at 75 °C and 39 minutes was more active by DPPH method and content of caffeic acid. Therefore, these abundant and inexpensive agro-industrial residues produced in Southern Brazil, are an important source of bioactive compounds that may be used as antioxidant substances in food and pharmaceutical industries.
Keywords: liquid-chromatography, extraction, phenolic compound, optimization, bioactive
compound
Introduction
Phenolic compounds in food have received especial attention due to their beneficial effects to human health.1,2 Most of the biological properties of phenolics are related to their antioxidant activity. They are able to scavenge free radicals as reactive species of nitrogen and oxygen, naturally produced during aerobic metabolism.3,4 Studies have shown that daily consumption of antioxidants can protect the body against many diseases as cancers and cardiovascular diseases.2
Grapes, apples, their derivatives and by-products are considered source of antioxidant activity compounds because they have a high content of phenolic compounds as phenolic acids, several flavonoids, monomers (catechin, epicatechin and gallocatechin) and superior phenolic (proanthocyanidins or condensed tannins).3,5-8
When processing grapes and apples to produce wine, juice and jams, significant amount of waste is generated (peel, seeds, pulp and stems). It is estimated that only 20% of fruit weight is used and the remaining is discarded9,10
as animal feed and to make compost, destinations that do not generate economic gains for agribusiness and represent problems for disposal.11 Nevertheless, large amounts of the residual quantities of bioactive compounds are maintained into the vegetal tissues. Previous studies12 have shown that approximately 58% of phytochemical remain in the pomace during industrial processing.
Therefore, pomaces of grapes and apples become valuable sources by representing significant economic gains for producers, becoming raw materials for other activities and offer a new possibility of use by preventing or reducing the problems and environmental impacts related to the accumulation and disposal of these products.13,14
There is a possibility of using these residues as natural antioxidant in the food and pharmaceutical industries15 and as an antimicrobial agent, prolonging the shelf life of products by inhibiting the lipid oxidation,16-18 enhancing color, flavor and aroma of foods.19 Shirahigue et al.20 showed a delayed lipid oxidation in processed chicken meat stored under refrigeration added with grape residue extracts (mixture of seed and peel) from Isabel and Niagara varieties.
emphasizes the growing interest on these topics.21-24 The chemical composition of grape and apple pomaces is varied and complex and it is intimately related to the geographical region and climate where it is produced.25 However, the available information on the polyphenolic and antioxidants from pomaces of Southern of Brazil, that has a wet temperature climate, with well-defined seasons is still limited and scarce, hindering the valorization of these by-products.
Extraction of bioactive compounds from plant materials is an important process and various techniques have been studied in this regard.26 The design of experiments (DOE) has been used in several studies of extractions for being considered a useful analytical tool, with application in the screening of the most relevant variables of a given analytical system.27 Therefore, it is important to apply DOE in studies covering many variables, as it makes possible the planning and carrying out in an organized way from a minimum number of experiments, saving time and financial resources and allows scientists to evaluate the influence of input and output variables aiming at increasing the process, improving the efficiency and quality of results.28,29
Therefore, the aim of the present study was to optimize the extraction of phenolic compounds with antioxidant activity from grape and apple pomaces using central composite design (CCD).
Experimental
Materials
Standards including gallic acid, vanillic acid, caffeic acid, p-coumaric acid, ferulic acid, trans-resveratrol stilbene and reagents Folin-Ciocalteau, 6-hydroxy-2,5,7,8-tetramethyl chroman-2-carboxylic acid (Trolox), 2,2’-azino-bis(3-ethyl benzothiazoline-6-sulphonic acid) (ABTS), 2,4,6-tripyridyl-s-triazine (TPTZ), 2,2-diphenyl-1-picrylhydrazyl hydrate (DPPH), ethanol (EtOH) and methanol were purchased from Sigma Chemical Co. (St. Louis, MO).
Preparation of materials
The grape pomace samples (Vitis labrusca, Bordeaux variety) from the red wine processing were collected at a winery in Mariopolis city, Paraná state, Brazil and apple pomace samples (Malus domestica, Fuji variety) from juice processing were obtained in Treze Tílias city, Santa Catarina state, Brazil. Both collected in the year of 2014. The samples were lyophilized, grounded, weighed, packed and stored at −6 oC until analysis.
Experimental design and extraction procedures
Response surface methodology (RSM) was used to optimize antioxidant activity and phenolic compounds extraction from apple and grape pomace. A central composite design with three independent variables was used: temperature (35-85ºC/X1), time (21-45 min/X2) and ethanol concentration (40-90%/X3). The three independent variables were coded at five levels (–1.68, –1, 0, 1, +1.68), which resulted in an experimental design of 17 experimental points, including three central points.
Statistica software was used for designing experiments and statistical data analysis (ANOVA). Experimental data were analyzed to fit a second order polynomial regression containing linear and quadratic coefficient and two-factor interaction effects. Models and regression coefficients were considered significant when p-values were lower than 0.05. The model equation of response (Y) of three independent variables (X1, X2 and X3) is:
(1)
where Y is the dependent variable (total phenolic compounds-TPC, DPPH, caffeic acid, gallic acid, vanillic acid, p-coumaric acid, ferulic acid and trans-resveratrol stilbene), β0 is the constant coefficient, βi is the linear coefficient (main effect), βii is the quadratic coefficient and
βij is the two-factor interaction coefficient.
A representative sample lyophilized of grape and apple pomaces (2 g) was extracted with a mixture of 25 mL of X3 ethanol:water mixture. The samples were homogenized using a vortex (Phoenix Luferco, model Ap56). After, the samples were heated at X1 ºC for X2 minutes and then cooled to room temperature and solvent was added if necessary to bring the final volume back to 25 mL. Ethanolic extract of grape pomace (EEGP) and ethanolic extract of apple pomace (EEAP) were obtained. All extracts were filtered through a qualitative paper for total phenolic content (TPC) and DPPH analysis and then filtered using 0.45 µm polytetrafluoroethylene (PTFE) syringe filter (Chromafil®) for chromatographic analysis and stored at
−4 ºC until analysis.
Total phenolic content (TPC)
after five minutes, it was added 2.0 mL of sodium carbonate (Na2CO3) 40 g L-1. The mixture was incubated at room temperature in the dark for 2 hours against ethanol as blank. Subsequently, the absorbance was measured using a spectrophotometer (model UV-Vis lambda 25, PerkinElmer) at 740 nm. Gallic acid was used as reference at concentration ranging from 10 to 80 mg L-1 and the results of total phenolic content were expressed as mg gallic acid equivalents (GAE) g-1 of dry weight (DW).
Antioxidant activity using 2,2-diphenyl-1-picrylhydrazyl hydrate (DPPH) free radical scavenging method
DPPH free radical scavenging activity was measured according to the method described by Brand-Williams et al.31 The reaction medium consisted of 0.5 mL of EEGP (0.5 g L-1) and EEAP (1.6 g L-1), 3 mL of ethanol and 0.3 mL of DPPH radical solution 0.5 mmol L-1 in ethanol. The mixture was incubated at room temperature in the dark for 45 min and the absorbance was measured using a spectrophotometer (model UV-Vis lambda 25, PerkinElmer) at 517 nm. Ethanolics solutions of Trolox (15 to 100 µmol L-1) were used for calibration, and the results were expressed as µmol of Trolox g-1 of dry weight (µmol Trolox g-1). The measurements were conducted in triplicate.
High-performance liquid chromatography with photodiode array detection (HPLC-PDA)
The high-performance liquid chromatography with photodiode array detection (HPLC-PDA) method was performed according to Oldoni et al.28 using a liquid chromatography equipment (Varian 920-LC) coupled to an analytical column Varian C-18 RP (250 × 4.6 mm, 5 µm) and a detector of photodiode array (PDA). It was injected 10 µL of EEGP and EEAP at a concentration of 5 and 6 g L-1, respectively. The mobile phase was composed of water:acetic acid (99:1, v/v) (solvent A) and methanol:acetic acid (99:1, v/v) (solvent B) in gradient mode at a constant flow of 1 mL min-1. The gradient started with 5% solvent
B to 7% of B in 7 minutes, 20% B in 15 minutes, 50% B in 30 minutes, 90% B in 50 minutes, and 95% B in 55 minutes. The column was maintained at a constant temperature of 30 oC. This work used authentic standards of vanillic acid, gallic acid, caffeic acid, p-coumaric acid, ferulic acid and
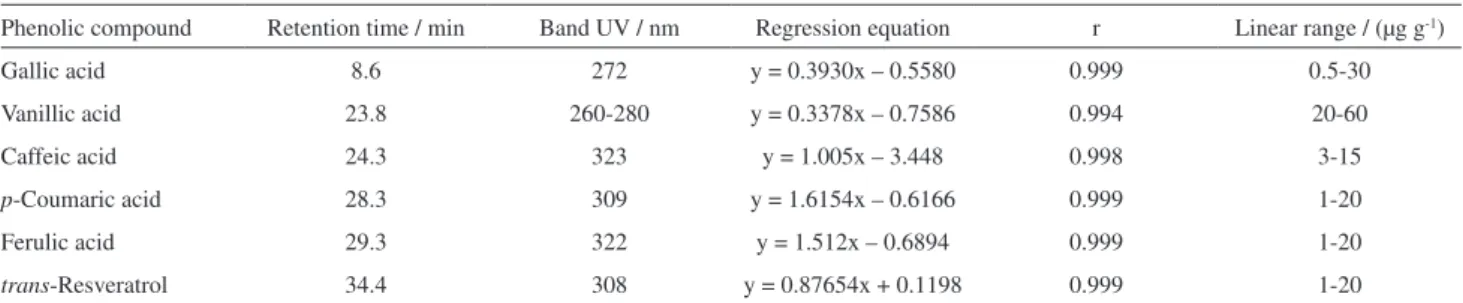
trans-resveratrol stilbene. The identification was performed by comparison of absorption in ultraviolet at 280 and 320 nm wavelengths and retention times (Table 1).
Results and Discussion
Optimization by RSM was carried out to verify that the independent variables-temperature (X1), time (X2) and ethanol concentration (X3)-significantly influenced the process of extraction of phenolic compounds and antioxidant activity present in EEGP and EEAP. Influence was verified through the responses obtained in the analysis of total phenolic content (TPC), antioxidant activity by DPPH radical scavenger method and determination of phenolic compounds by HPLC for both extracts.
Based on the chromatographic analysis by HPLC, in EEGP it was identified and quantified gallic acid, caffeic acid, p-coumaric acid and trans-resveratrol and in EEAP caffeic acid (Figure 1). In both chromatograms some compounds were observed but not identified. Their ultraviolet (UV) spectra correspond to phenolic families analyzed as flavan-3-ol and dihydrochalcone (280 nm), hydrocinnamic acid (320 nm) and flavonol (350 nm).32
Farhadi et al.22 studied different cultivars, species and parts of grapes (seed, skin, peel and pulp) and identified other compounds with antioxidant capacities beyond those found in this work, particularly catechin, epicatechin, quercetin and rutin flavonoids. Tournour etal.8 conducted comparative studies of different varieties of Portuguese grapes using different methods of extraction, and their studies have revealed the presence of gallic acid, caffeic acid, syringic acid, catechin and epicatechin, and the major compounds were syringic acid and catechin.
Leyva-Corral et al.5 evaluated apple pomace and a product formulated from that and identified phenolic acids
Table 1. Chromatographic parameters of phenolic compounds analyzed by HPLC
Phenolic compound Retention time / min Band UV / nm Regression equation r Linear range / (µg g-1)
Gallic acid 8.6 272 y = 0.3930x – 0.5580 0.999 0.5-30
Vanillic acid 23.8 260-280 y = 0.3378x – 0.7586 0.994 20-60
Caffeic acid 24.3 323 y = 1.005x – 3.448 0.998 3-15
p-Coumaric acid 28.3 309 y = 1.6154x – 0.6166 0.999 1-20
Ferulic acid 29.3 322 y = 1.512x – 0.6894 0.999 1-20
and flavonoids in both, especially caffeic acid. Among the major phenols identified in apple pomace, García etal.33 described cinnamic acids.
After that, RSM was used to evaluate the influence of independent variables on dependent variables and regression coefficients. It was possible to demonstrate the terms of the model, quadratic and linear adjustments, as well as models of significant interactions between the terms. RSM analysis is performed by combining two independent factors related to dependent variable.
Optimum extraction conditions for grape pomace
For caffeic acid, trans-resveratrol and antioxidant activity by DPPH method no variable or interaction was statistically significant. The values of antioxidant activity and phenolic compounds for EEGP varied from 102.16 to 307.2 µmol of Trolox g-1 and from 17.98 to 33.52 mg GAE g-1 of dry grape pomace, respectively. The runs 10 and 11, corresponding to the combination of intermediate levels of three input variables showed the highest responses for DPPH and TPC, respectively (Table 2).
The main effect, time of extraction had significant effect (p < 0.05) on the TPC (Table 3). The content decreased by 49.7% when going from 30 min, run R11 (33.52 mg GAE g-1) to 39 min of extraction, run R16 (17.98 mg EAG g-1). It was observed that the TPC of the extracts initially increased with increasing time until
reaching a maximum, after which the TPC decreased with increasing time. It suggests that after the optimum extraction time occurred degradation of some thermolabile phenolic compounds, thus leading to a lower concentration of phenolic compounds.
The developed model can be considered statistically significant and predictive. F-value calculated was 7.05 times higher than F-tabulated with 95% of confidence (Table 3) for TPC. The models had satisfactory levels of adequacy (R2).
The main effect, ethanol concentration was significant (p < 0.05) to extract gallic acid (Table 3). The content increased 55.8% when ethanol concentration going from 80%, run R16 (5.70 µg g-1) to 65%, run R10 (12.90 µg g-1). The maximum predicted TPC (33.52 mg GAE g-1) and gallic acid evaluated by HPLC (12.90 µg g-1) was obtained under the optimum extraction conditions of 65% of ethanol, 60 °C and 30 min for EtOH concentration, temperature and time, respectively (Table 2).
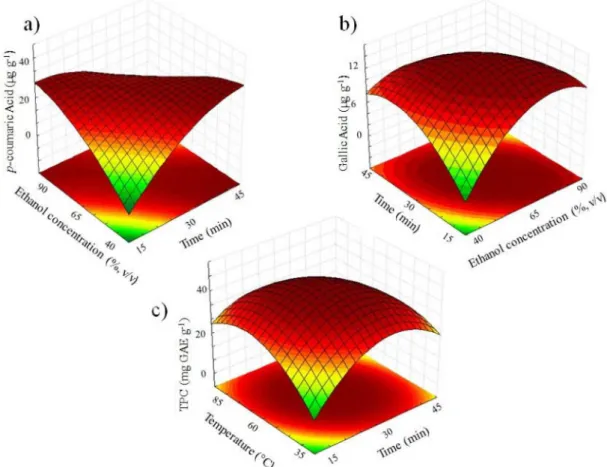
The extraction of phenolic p-coumaric acid (CUA) was influenced by interactions between time versus temperature and ethanol concentration versus temperature (Figure 2 and Table 3). At EtOH concentration of 50%, the content of
p-coumaric acid at 45 and 75 °C was 21.2 and 19.4 µg g-1, runs R2 and R15, respectively (Table 2). In comparison, the
p-coumaric acid of the extract set 45 and 75 °C using 80% EtOH was approximately 18.1 and 34.2 µg g-1, runs R3 and R13, respectively. The samples extracted at 45 and 75 °C using 80% EtOH were significantly different. An increase
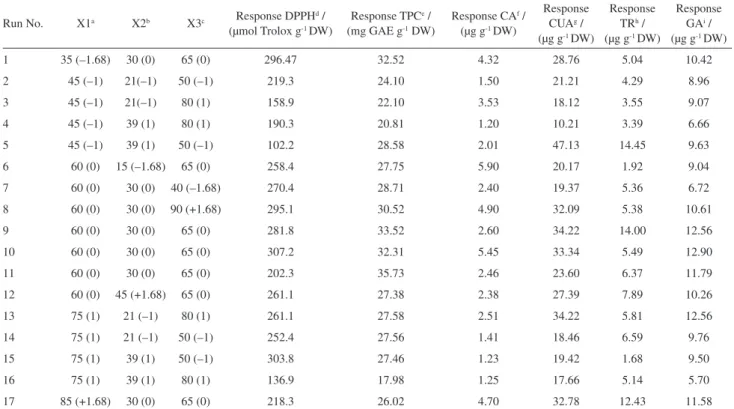
Table 2. Central composite rotatory design and corresponding response values for ethanolic extract from grape pomace (EEGP)
Run No. X1a X2b X3c Response DPPHd /
(µmol Trolox g-1 DW)
Response TPCe /
(mg GAE g-1 DW)
Response CAf /
(µg g-1 DW)
Response CUAg /
(µg g-1 DW)
Response TRh /
(µg g-1 DW)
Response GAi /
(µg g-1 DW)
1 35 (–1.68) 30 (0) 65 (0) 296.47 32.52 4.32 28.76 5.04 10.42
2 45 (–1) 21(–1) 50 (–1) 219.3 24.10 1.50 21.21 4.29 8.96
3 45 (–1) 21(–1) 80 (1) 158.9 22.10 3.53 18.12 3.55 9.07
4 45 (–1) 39 (1) 80 (1) 190.3 20.81 1.20 10.21 3.39 6.66
5 45 (–1) 39 (1) 50 (–1) 102.2 28.58 2.01 47.13 14.45 9.63
6 60 (0) 15 (–1.68) 65 (0) 258.4 27.75 5.90 20.17 1.92 9.04
7 60 (0) 30 (0) 40 (–1.68) 270.4 28.71 2.40 19.37 5.36 6.72
8 60 (0) 30 (0) 90 (+1.68) 295.1 30.52 4.90 32.09 5.38 10.61
9 60 (0) 30 (0) 65 (0) 281.8 33.52 2.60 34.22 14.00 12.56
10 60 (0) 30 (0) 65 (0) 307.2 32.31 5.45 33.34 5.49 12.90
11 60 (0) 30 (0) 65 (0) 202.3 35.73 2.46 23.60 6.37 11.79
12 60 (0) 45 (+1.68) 65 (0) 261.1 27.38 2.38 27.39 7.89 10.26
13 75 (1) 21 (–1) 80 (1) 261.1 27.58 2.51 34.22 5.81 12.56
14 75 (1) 21 (–1) 50 (–1) 252.4 27.56 1.41 18.46 6.59 9.76
15 75 (1) 39 (1) 50 (–1) 303.8 27.46 1.23 19.42 1.68 9.50
16 75 (1) 39 (1) 80 (1) 136.9 17.98 1.25 17.66 5.14 5.70
17 85 (+1.68) 30 (0) 65 (0) 218.3 26.02 4.70 32.78 12.43 11.58
aX1: temperature (°C); bX2: time (min); cX3: ethanol concentration (%); dDPPH: 2,2-diphenyl-1-picrylhydrazyl hydrate-antioxidant activity; eTPC: total
phenolic content; fCA: level of caffeic acid; gCUA: p-coumaric acid; hTR: level of trans-resveratrol; iGA: gallic acid; DW: dry weight.
Table 3. Analysis of variance (ANOVA), regression coefficients of the models, R2 values and F-value of the optimized second order polynomial models of
antioxidant activity as measured by DPPH, phenol content (TPC), level of gallic acid, level of p-coumaric acid and caffeic acid level for ethanolic extracts of grape (EEGP) and apple pomace (EEAP)
Term
EEGP EEAP
Coefficients of the models
TPC / (mg GAE g-1 DW)
GA / (µg g-1 DW)
CUA / (µg g-1 DW)
DPPH / (µmol Trolox g-1 DW)
CA / (µg g-1 DW)
Intercept (β0) 34.12 12.46 30.60 33.75 59.50
time (β1) –0.52a –0.50a 1.07a 1.34b 0.01a
EtOH concentration (β2) –1.19a 0.19a –0.34a –3.74c 12.39b
Temperature (β3) –0.43a 0.38a –0.01a 3.19c 8.39d
time × time (β11) –3.11d –1.12a –3.06a –1.11d –2.32a
EtOH concentration × EtOH concentration (β22) –2.39a –1.47b –2.37a –3.43c –6.57a
Temperature × temperature (β33) –2.51a –0.64a –0.58a –1.43b –1.90a
time × EtOH concentration (β12) –1.91a –1.21a –6.42d 0.79a –0.40a
time × temperature (β13) –1.61a –0.67a –4.20d 0.42a –0.44a
EtOH concentration × temperature (β23) 0.04a 0.23a 6.75d 0.28a –14.63b
R2 0.68 0.73 0.75 0.98 0.81
F-value 31.65 39.82 45.68 32.02 690.57
F-tabulated 4.49 4.49 4.49 4.49 4.49
F ratioe 7.05 8.87 10.17 14.27 153.80
95% confidence level; anot significant p > 0.05; bsignificant at p < 0.01; csignificant at < 0.001; dsignificant at p < 0.05; eFratio (F-value/tabulated F-value);
in temperature from 45 to 75 °C caused a 47% increase in content of p-coumaric acid when extracting with 80% EtOH (Table 2 and Figure 2).
Ethanol is less polar (1.69 dipole moment) than water (1.85 dipole moment) so by increasing the concentration of ethanol the polarity of the solvent extractor is decreased. The extraction of gallic acid has a maximum at around 65% of ethanol and p-coumaric acid at 80%. The difference between extractions of these compounds can be explained by the fact that gallic acid is a more polar compound than
p-coumaric acid.
The interactions between the extraction time and temperature also influenced the extraction of phenolic
p-coumaric acid. At an ethanol concentration of 80% and 75 °C, the content at 21 and 39 min was 34.2 and 17.7 µg g-1, runs R13 and R16, respectively. In comparison, the
p-coumaric acid of the extracts at 21 and 39 min using 45 °C was approximately 18.1 and 10.2 µg g-1, runs R3 and R4, respectively. The samples extracted at 21 and 39 min using 45 and 75 °C were significantly different. An increase in time from 21 to 39 min caused a 48.4% decrease in content of p-coumaric acid when extracting with 75 °C and EtOH 80%.The maximum predicted CUA (47.13 µg g-1) was obtained under the extraction conditions of 50% of ethanol,
45 °C and 39 min for EtOH concentration, temperature and time, respectively (Table 2).
Two-way joining analysis (Figure 3) confirms the maximum conditions for extraction of phenolic compounds and antioxidant activity from EEGP. This analysis evaluates the clustering of samples related to dependent variables. The intensity of color shows which dependent variable is more related to extracts produced in different conditions. For EEGP, runs R2, R3, R4 and R16 showed lowest results for all variables analyzed. Runs R9, R13, R11 and R10 showed the highest content of phenolic compounds and gallic acid, indicating a strong correlation between these results. The run R5 showed the highest content of
p-coumaric acid and trans-resveratrol.
Because three variables (p-coumaric acid, phenolic compounds and galic acid) were significant, presented distinct values and there is interest in obtaining the optimal operating condition of the independent variables, it was calculated the Desirability function. The calculated global value was 0.7784 for the conditions of 60 °C, 30 min and ethanol concentration of 65%, which corresponds to the central point, simultaneously satisfying all the requirements necessary for dependent variables. Dependent variables that were influenced by the evaluated parameters (X1, X2
and X3) were tested for lack of fit and showed adequacy (p > 0.05) of models.
Karacabey and Mazza3 using RSM in grape pomace also observed the effect of ethanol concentration and temperature on the extraction of compounds with antioxidant activity and the ethanol concentration was the most significant variable for the extraction of bioactive
compounds. Other authors have also reported that the polarity of the solvent used in the extraction directly affects not only the amount of phenolic compounds but also the composition of phenolic compounds.34
Optimum extraction conditions for apple pomace
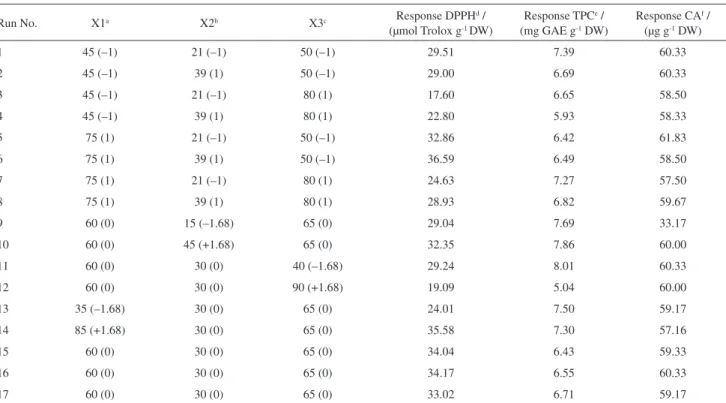
The variations observed for antioxidant activity and TPC obtained for the EEAP were 2.34 to 4.06 µmol Trolox g-1 and 5.04 to 8.01 mg GAE g-1 of dry apple pomace, respectively.
In extraction of phenolic compounds no independent variables were significant; however, the antioxidant activity by DPPH method was influenced by all tested variables (Table 3) with quadratic and linear effects. It was observed that when time and extraction temperature variables varied from lower level to higher level occurred an increase of 42.4% in antioxidant activity (Table 4).
The main effect, ethanol concentration was significant (p < 0.05) to extract compounds with antioxidant activity by DPPH method. The activity increased more than 40.0% when going from 80 (2.34 µmol g-1) to 50% (4.06 µmol g-1) EtOH concentration (Table 4). The effect of ethanol concentration can be related to decrease in polarity of solvent extraction due to the increase of ethanol concentration. Therefore a change in polarity of solvent coupled with temperature and time increase provided
Figure 3. Two-way joining results for EEGP. Antioxidant activity (DPPH), total phenolic content (TPC), caffeic acid (CA), p-coumaric acid (CUA), trans-resveratrol (TR), gallic acid (GA).
Table 4. Central composite rotatory design and corresponding response values for ethanolic extract from apple pomace (EEAP)
Run No. X1a X2b X3c Response DPPHd /
(µmol Trolox g-1 DW)
Response TPCe /
(mg GAE g-1 DW)
Response CAf /
(µg g-1 DW)
1 45 (–1) 21 (–1) 50 (–1) 29.51 7.39 60.33
2 45 (–1) 39 (1) 50 (–1) 29.00 6.69 60.33
3 45 (–1) 21 (–1) 80 (1) 17.60 6.65 58.50
4 45 (–1) 39 (1) 80 (1) 22.80 5.93 58.33
5 75 (1) 21 (–1) 50 (–1) 32.86 6.42 61.83
6 75 (1) 39 (1) 50 (–1) 36.59 6.49 58.50
7 75 (1) 21 (–1) 80 (1) 24.63 7.27 57.50
8 75 (1) 39 (1) 80 (1) 28.93 6.82 59.67
9 60 (0) 15 (–1.68) 65 (0) 29.04 7.69 33.17
10 60 (0) 45 (+1.68) 65 (0) 32.35 7.86 60.00
11 60 (0) 30 (0) 40 (–1.68) 29.24 8.01 60.33
12 60 (0) 30 (0) 90 (+1.68) 19.09 5.04 60.00
13 35 (–1.68) 30 (0) 65 (0) 24.01 7.50 59.17
14 85 (+1.68) 30 (0) 65 (0) 35.58 7.30 57.16
15 60 (0) 30 (0) 65 (0) 34.04 6.43 59.33
16 60 (0) 30 (0) 65 (0) 34.17 6.55 60.33
17 60 (0) 30 (0) 65 (0) 33.02 6.71 59.17
the maximum extraction of compounds with antioxidant activity from apple pomace which indicates the heat stability of these compounds.
In the extraction of caffeic acid only the time factor was not significant, while the independent variable temperature and ethanol concentration, as well as the interaction between ethanol concentration and temperature were significant (Table 3). It is possible to suggest that caffeic acid shows heat stability and a better affinity with medium less polar. The maximum predicted caffeic acid (61.83 µg g-1) evaluated by HPLC was obtained under extraction conditions of 50% of ethanol concentration and 75 °C (Table 4 and Figure 4).
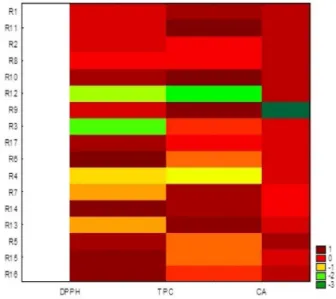
Two-way joining analysis for EEAP (Figure 5) showed that runs R3, R4 and R12 presented the lowest content of phenolic compounds and antioxidant activity while R9 extracted lower content of p-coumaric acid.
Wijngaard and Brunton35 reported in apple pomace that only the temperature had a significant effect on the model response for antioxidant activity using DPPH method while concentration of ethanol plays the most important role to extract individual polyphenol groups as phenolic acids and flavonoids.
Using ANOVA, it was observed that models were significant and predictive. F calculated was 14.27 and 153.80 times higher than F tabulated for DPPH method and caffeic acid, respectively, with 95% confidence (Table 3). The models had satisfactory levels of adequacy (R2).
For apple pomace, DPPH and caffeic acid variables were significant and from the Desirability function (0.7025), optimal extraction conditions were 60 °C, 30 min and ethanol concentration of 65%, corresponding to the
central point, same condition obtained for grape pomace. The lack of fit calculated was not significant for DPPH model (p > 0.05) while for the caffeic acid model the value was less than 0.05, indicating that the model is inadequate.
Conclusions
Effects of time, temperature and ethanol concentration on antioxidant activity and phenolic compounds of grape and apple pomaces were determined by response surface methodology (RSM). The optimization procedure was conducted in order to simultaneously maximize the antioxidant activity by DPPH method, total phenolic
Figure 5. Two-way joining results for EEAP. Antioxidant activity (DPPH), total phenolic content (TPC), caffeic acid (CA).
content and individual phenolic acids and stilbene
trans-resveratrol.
From desirability function it was possible to establish that optimal conditions of extractions for both pomaces were the independent variables in central point. On the whole, it is interesting to note that grape and apple pomaces from Southern of Brazil are a valuable source of natural antioxidants and have properties that suggest applications in the food and pharmaceutical industries.
Acknowledgments
The authors acknowledge grants and fellowships from Conselho Nacional de Desenvolvimento Científico e Tecnológico (CNPq-Process No. 476635/2013-6), Central de Análises and Diretoria de Pesquisa e Pós-Graduação (DIRPPG) of Federal Technological University of Paraná (UTFPR).
References
1. Melo, P. S.; Bergamaschi, K. B.; Tiveron, A. P.; Massarioli, A. P.; Oldoni, T. L. C.; Zanus, M. C.; Pereira, G. E.; de Alencar, S. M.; Cienc. Rural2011, 41, 1088.
2. Sautter, C. K.; Denardin, S.; Alves, A. O.; Mallmann, C. A.; Penna, N. G.; Hecktheuer, L. H.; Food Sci. Technol. 2005, 25, 437.
3. Karacabey, E.; Mazza, G.; Food Chem. 2010, 119, 343. 4. Sang, S.; Yang, I.; Buckley, B.; Ho, C. T.; Yang, C. S.; Free
Radical Biol. Med. 2009, 43, 362.
5. Leyva-Corral, J.; Quintero-Ramos, A.; Camacho-Dávila, A.; Zazueta-Morales, J. J.; Aguilar-Palazuelos, E.; Ruiz-Gutiérrez, M. G.; Meléndez-Pizarro, C. O.; Ruiz-Anchondo, T. D. J.; Food Sci. Technol. 2016, 65, 228.
6. Rana, S.; Gupta, S.; Rana, A.; Bhushan, S.; Food Science Human Wellness2015,4, 180.
7. Soares, M.; Welter, L.; Gonzaga, L.; Lima, A.; Mancini-Filho, J.; Fett, R.; Food Sci. Technol. 2008, 28, 727.
8. Tournour, H. H.; Segundo, M. A.; Magalhães, L. M.; Barreiros, L.; Queiroz, J.; Cunha, L. M.; Ind. Crops Prod. 2015,74, 397. 9. Llobera, A.; Cañellas, J.; Food Chem. 2007, 101, 659. 10. Lommen, A.; Godejohann, M.; Venema, D. P.; Hollman, P. C.
H.; Spraul, M.; Anal. Chem. 2000, 72, 4431.
11. Prozil, S. O.; Mendes, J. A.; Evtuguin, D. V.; Lopes, L. P. C.; Millenium2013,44, 23.
12. Guyot, S.; Marnet, N.; Sanoner, P.; Drilleau, J. F.; J. Agric. Food Chem. 2003,6240.
13. Domínguez-Perles, R.; Teixeira, A. I.; Rosa, E.; Barros, A. I.; Food Chem. 2014, 164, 339.
14. Macagnan, F. T.; dos Santos, L. R.; Roberto, B. S.; Moura, F. A.; Bizzani, M.; Silva, L. P.; Bioact. Carbohydr. Diet. Fibre
2015, 6, 1.
15. Oldoni, T. L. C.; Melo, P. S.; Massarioli, A. P.; Moreno, I. A. M.; Bezerra, R. M. N.; Rosalen, P. L.; da Silva, G. V. J.; Nascimento, A. M.; Alencar, S. M.; Food Chem. 2016, 192, 306.
16. Bucic-Kojic, A.; Sovová, H.; Planinic, M.; Tomas, S.; Food Chem. 2013, 136, 1136.
17. Mielnik, M. B.; Olsen, E.; Vogt, G.; Adeline, D.; Skrede, G.; Food Sci. Technol. 2006, 39, 191.
18. Peschel, W.; Sánchez-Rabaneda, F.; Diekmann, W.; Plescher, A.; Gartzía, I.; Jiménez, D.; Lamuela-Raventós, R.; Buxaderas, S.; Codina, C.; Food Chem. 2006, 97, 137.
19. Tseng, A.; Zhao, Y.; Food Chem. 2013, 138, 356.
20. Shirahigue, L. D.; Plata-Oviedo, M.; Alencar, S. M.; D’Arce, M. A. B. R.; Vieira, T. M. F. S.; Oldoni, T. L. C.; Int. J. Food Sci. Technol. 2010, 45, 863.
21. Drosou, C.; Kyriakopoulou, K.; Bimpilas, A.; Tsimogannis, D.; Krokida, M.; Ind. Crops Prod. 2015, 75, 141.
22. Farhadi, K.; Esmaeilzadeh, F.; Hatami, M.; Forough, M.; Molaie, R.; Food Chem. 2016, 199, 847.
23. Jara-Palacios, M. J.; Hernanz, D.; Cifuentes-Gomez, T.; Escudero-Gilete, M. L.; Heredia, F. J.; Spencer, J. P. E.; Food Chem. 2015, 183, 78.
24. Zhu, F.; Du, B.; Zheng, L.; Li, J.; Food Chem. 2015, 186, 207. 25. Rockenbach, I. I.; Gonzaga, L. V.; Rizelio, V. M.; Gonçalves,
A. E. S. S.; Genovese, M. I.; Fett, R.; Food Res. Int. 2011, 44, 897.
26. Ghafoor, K.; Park, J.; Choi, Y. H.; Innovative Food Sci. Emerging Technol. 2010, 11, 485.
27. Montgomery, D. C.; Design and Analysis of Experiments, 8th ed.; John Wiley: New York, 2012.
28. Oldoni, T. L. C.; Oliveira, S. C.; Andolfatto, S.; Karling, M.; Calegari, M. A.; Sado, R. Y.; Maia, F. M. C.; Alencar, S. M.; Lima, V. A.; J. Braz. Chem. Soc. 2015, 26, 2054.
29. Zordi, N.; Cortesi, A.; Kikic, I.; Moneghini, M.; Solinas, D.; Innocenti, G.; Portolan, A.; Baratto, G.; Dall’Acqua, S.; J. Supercrit. Fluids2014, 95, 491.
30. Singleton, V. L.; Orthofer, R.; Lamuela-Raventós, R. M.; Methods Enzymol.1999, 299, 152.
31. Brand-Williams, W.; Cuvelier, M.; Berset, C.; Lebensm-Wiss. Techonol. 1995, 28, 25.
32. Alberti, A.; Zielinski, A. A. F.; Zardo, D. M.; Demiate, I. M.; Nogueira, A.; Mafra, L. I.; Food Chem. 2014, 149, 151. 33. García, Y. D.; Valles, B. S.; Lobo, A. P.; Food Chem. 2009, 117,
731.
34. Yu, J.; Ahmedna, M.; Goktepe, I.; Food Chem. 2005, 90, 199. 35. Wijngaard, H. H.; Brunton, N.; J. Food Eng. 2010,96, 134.
Submitted: August 29, 2016