1 Gazi University, Faculty of Health Sciences, Department of Nutrition and Dietetics. Emniyet Mahallesi, Muammer Yaşar Bostancı Caddesi, 16, Beşevler, Ankara, Turkey. Correspondencia para/Correspondence to: B KOCAADAM. E-mail: <[email protected]>.
2 Ege University, Faculty of Health Sciences, Department of Nutrition and Dietetics. İzmir, Turkey. Como citar este artigo/How to cite this article
Bilici S, Kocaadam B, Mortas H, Kucukerdonmez O, Koksal E. Intuitive eating in youth: Its relationship with nutritional status. Rev Nutr. 2018;31(6):557-65. http://dx.doi.org/10.1590/1678-98652018000600005
Intuitive eating in youth: Its relationship
with nutritional status
Alimentação intuitiva na juventude
:
sua relação
com o estado nutricional
Saniye BILICI1 0000-0002-1235-0329
Betul KOCAADAM1 0000-0002-9058-4630
Hande MORTAS1 0000-0001-6356-5226
Ozge KUCUKERDONMEZ2 0000-0003-2228-8917
Eda KOKSAL1 0000-0002-7930-9910
A B S T R A C T
Objective
To determine intuitive eating in young adults and the effects of factors such as gender, Body Mass Index and dietary intake, and dietary adequacy on intuitive eating.
Methods
This cross-sectional study was conducted with students at Gazi University in Ankara (N=665; 17.6% men; 82.4% women). The questionnaire, including the general characteristics, anthropometric measurements, Intuitive Eating Scale-2, and 24-H Dietary Recall sections, were applied to all participants. For the evaluation of the diet, Nutrient Adequacy Ratio and Mean Adequacy Ratio were used.
Results
Conclusions
The intuitive eating scores varied according to gender, dietary adequacy and age. Intuitive eating may be effective in the formation of long-term behavioral changes, which is beneficial for the treatment of obesity. The result of this study may encourage the development of this behavior in groups (may vary according to gender), that is thought to be effective by considering the changes of intuitive eating behavior.
Keywords: Intuitive eating. Behavioral change. Body mass index. Nutrient Adequacy Ratio. Mean Adequacy Ratio.
R E S U M O
Objetivo
Determinar a alimentação intuitiva em adultos jovens e os efeitos de fatores como sexo, índice de massa corporal, ingestão alimentar e adequação da dieta na alimentação intuitiva.
Métodos
Este estudo transversal foi realizado em estudantes da Universidade de Gazi, em Ancara (N=665; 17,6% homens; 82,4% mulheres). O questionário, incluindo as características gerais, medidas antropométricas, Escala de Alimentação Intuitiva 2 e recordatório alimentar de 24 horas foi aplicado aos participantes. Para a avaliação da dieta, foram utilizados o Índice de Adequação de Nutrientes e a Razão de Adequação Média.
Resultados
A Escala Média de Escala de Comportamento Intuitivo-2 foi de 3,2±0,33, dos homens e das mulheres, foi de 3,3±0,37 e 3,2±0,32, respectivamente (p<0,05). De acordo com a análise de regressão linear, sexo, idade a Razão de Adequação Média tiveram efeito no modelo formado pelo escore (p<0,05). Além disso, houve uma correlação negativa entre os escores da Escala de Alimentação Intuitiva-2 e os valores do índice de massa corporal nas mulheres (rp=-0,095, p=0,026).
Conclusão
Os escores alimentares intuitivos variaram de acordo com o gênero, com adequação da dieta e com a idade. A alimentação intuitiva pode ser eficaz na formação de mudanças a longo prazo no comportamento, o que é benéfico para o tratamento da obesidade. O resultado deste estudo pode encorajar o desenvolvimento deste comportamento em grupos (talvez variar de acordo com o gênero) que é considerado efetivo considerando-se as mudanças do comportamento alimentar intuitivo.
Palavras-chave: Alimentação intuitiva. Mudança de comportamento. Índice de massa corporal. Índice de Adequação de Nutrientes. Razão de Adequação Média.
I N T R O D U C T I O N
In recent years, obesity as a result of unhealthy eating habits, and sedentary lifestyle have become a major public health problem especially in young adults in Turkey as well as worldwide [1,2]. The primary approach to treat obesity is to provide the patient with weight loss through diet and exercise [3]. However, increasing evidence suggests that the efficacy of this treatment method is questionable in long term [4].
As an alternative to energy-restricted diets, the movement to shape eating based on
characterized by concepts such as normal eating, adaptive eating, wisdom eating and conscious eating [8].
The Intuitive Eating Scale (IES) was first introduced to the scientific literature by Hawks
et al. [9]. The scale was then developed and the
Intuitive Eating Scale-2 (IES 2) was developed [10]. Başet al. [11] determined the validity and reliability of IES-2 in Turkish university students.
According to the results presented in a literature review assessing the relationship between intuitive eating and health measures, it is stated that there is a positive relationship among intuitive eating, psychological health measures and positive eating behaviors, but a negative one between intuitive eating and the body mass index (BMI) [4]. Similarly, most current work on intuitive eating has shown that it was related to lower rigid control, lower psychological distress, higher psychological adjustment, and lower BMI [12]. Clinical studies have shown that intuitive eating does not have much effect on body weight loss, but it is effective in terms of weight maintenance, improved psychological health, positive physical health indicators (e.g.
blood pressure, cholesterol level etc.) and diet intake and/or eating behaviors [13-16]. In addition to these findings, studies assessing the relationship between BMI and intuitive eating have found negative correlations between the two [5,17]. To the best of our knowledge, this study is important in that it is the first study in Turkey after the validity and reliability study.
Corroborating the study of Baş et al. [11], the
present study offers: the relationship between intuitive eating and BMI, dietary intake and dietary adequacy.
M E T H O D S
This cross-sectional study was conducted
with 665 university students in Gazi University
between the ages of 18-25 years, who agreed to participate in the study voluntarily
(September-November 2017) and live in Ankara,
the capital city of Turkey (the response rate of the study was 75%). Because some of the individuals participating in the research could not be reached, participants were selected by probabilistic sampling. GPower version 3.1.9.2 (University of Düsseldorf, Düsseldorf, Germany) was used to perform calculations on sample size within an 85% confidence interval at a 0.05 significance level, and sample size calculation indicated a sample size of 615 individuals.
The questionnaire form was applied to the participants using the face-to-face interview method. Verbal or written consents of individuals participating in the research were obtained by the voluntary consent form in accordance with the Helsinki declaration. This study was approved by the Research Ethics Committee of
Gazi University. The questionnaire consists of
general characteristics, anthropometric measures, Intuitive Eating Scale-2, and 24-h dietary recall (for 2 days, weekday and weekend) sections.
In order to assess the intuitive eating score, the Turkish version of the Intuitive Eating Scale-2 (5-point Likert scale instrument with
twenty-three items), developed by Baş et al.
[11], was used. In this validity and reliability study, Bartlett’s test of sphericity yielded a value of X2=9043.49 (p<0.001), while the Kaiser-Meyer-Olkin index was 0.87. The IES-2 consists of four subscales: 1. Unconditional permission to eat (UPE; 6 items; e.g., “If I’m craving a certain food,
I allow myself to have it”), Eating for physical
reasons (EPR; 8 items; e.g., “I mostly eat foods
that make my body perform efficiently (well)”),
Reliance on hunger and satiety cues (RHSC; 6 items; e.g., “I rely on my hunger signals to tell me
when to eat”), and Body-food choice congruence
(B-FCC; 3 items) (e.g., “I mostly eat foods that
give my body energy and stamina”) was used for
The researchers asked the participants to talk about their dietary intake over a 2-day period (weekday and weekend) using the 24-h dietary recall method. Nutrition Information Systems (Beslenme Bilgi Sistemi-BeBiS/The German Food Code and Nutrient Data Base, BLS II.3, 1999) which is a food software program in compliance with Turkish food, was used to assess energy (kcal), macronutrients, and micronutrients. For the evaluation of dietary adequacy, the Nutrient
Adequacy Ratio (NAR) and Mean Adequacy
Ratio (MAR), which is measured by NAR, were
used.
Nutrient Adequacy Ratio (NAR)
NAR was calculated using the daily intake ratio of a nutrient and Dietary Reference Intake (DRI) framework categorized according to age and gender. In this study, NAR were obtained for a total of twelve nutrients (protein, fiber, vitamin B6, folate, vitamin B12, vitamin C, calcium, phosphor, potassium, magnesium, iron and zinc) [18].
NAR (%) = Daily intake of a nutrient x 100
DRI amount of the nutrient
Mean Adequacy Ratio (MAR)
MAR was obtained by ratio of the total NARs divided by the number of nutrients (for twelve nutrients). For both NAR and MAR, a value of 100% is the ideal since it means that the intake is the same as the requirement [18].
MAR (%) = ∑ NAR (%)
Number of nutrients
Participants’ weight and height measurements were taken by the researchers in accordance with the measurement techniques [19]. Body mass index is calculated as the weight (kg) divided
by squared height (m2). The World Health
Classification (WHO) reference values were used in the classification of BMI [20].
The obtained data were evaluated using SPSS 22.0 statistic package program (SPSS Inc., Chicago, Illinois, United States). Baseline sample characteristics, including sociodemographic data, dietary intake, NAR, MAR, total IES-2 score and its subscales, and the BMI were analyzed using descriptive statistics and are presented as means and standard deviation for continuous variables and as percentages for categorical variables. Chi-square was used to compare categorical
variables. One-way Anova (with Tukey’s (HSD)
– Honestly Significant Difference test – for post hoc comparison) and Student’s t-test were used for statistical analysis. To identify the correlation among the parameters, Pearson correlation analysis was used.
Linear regression was used to determine the relationships of IES-2 score with gender, age, BMI, energy, and MAR. The results were evaluated within a 95% confidence interval and at p<0.01 and p<0.05 significance level.
R E S U L T S
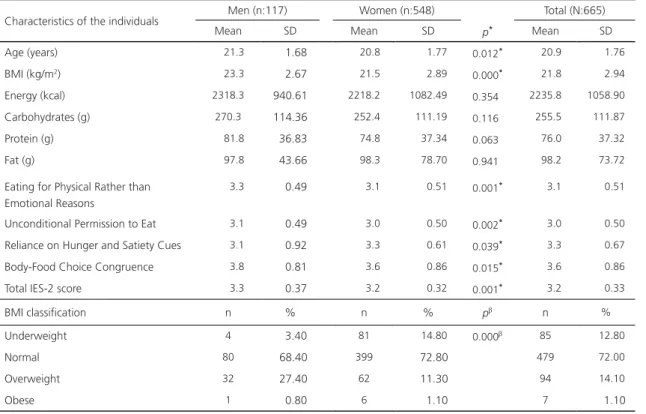
This study was conducted with 665 university students (17.6% men; 82.4% women) whose mean age was 20.9±1.76 (between 18-25 years). The mean BMI was found for men
was 23.3±2.67kg/m2 and 21.5±2.89kg/m2 for
women (p<0.001). Most men (68.4%) and
women (72.8%) had normal BMI. There were no significant differences between energy and macronutrient intake (carbohydrates, protein, fat) in men and women. The mean energy intake was 2235.8±1058.9kcal/day (men: 2318.3±940.6; women: 2218.2±1082.49kcal/ day). Overall, the mean IES-2 score was 3.2±0.33,
men’s score was 3.3±0.37, while women’s score
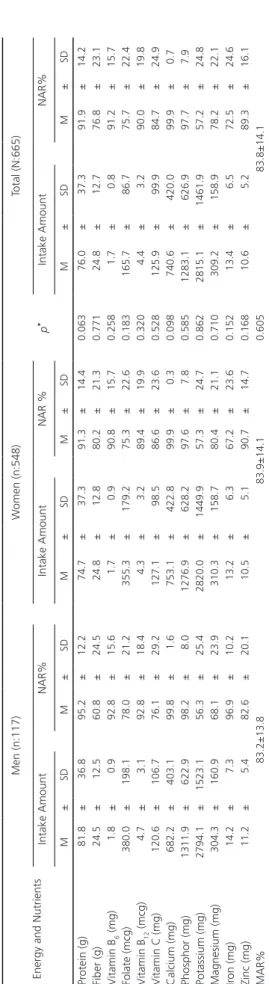
was 3.2±0.32. Regarding gender, the total IES-2 scores and its subscale scores were found to be significantly different (p<0.05) (Table 1). The mean MAR was 83.8±14.1 (men: 83.2±13.8, women: 83.9±14, p>0.05) (Table 2).
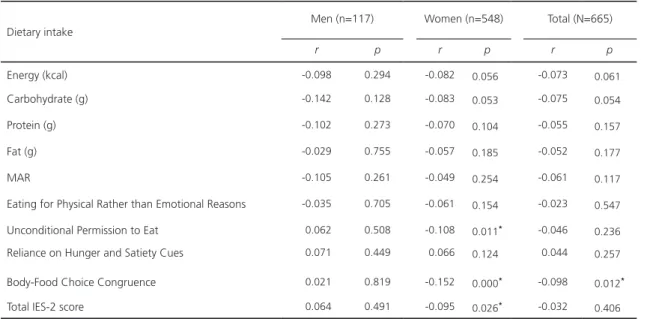
(data not shown). Negative correlations were found between the IES-2 score, Unconditional Permission to Eat score and BMI for women (r=-0.095, p=0.026; r=-0.108, p=0.011, respectively). Body-Food Choice Congruence score was negatively associated with BMI in
both women and in total (p<0.05). There was
a negative relationship between MAR and BMI for both genders, but these were not statistically significant (Table 3).
The difference between the mean scores of the IES-2 scores and its subscales according to the BMI classification was found to be significant only for the Body-Food Choice
Congruence score (p=0.026). This score was
significantly higher in underweight individuals than in normal individuals (3.9±0.82; 3.6±0.84, respectively; p=0.15) (data not shown).
When factors that could affect the IES-2 score (age, gender, energy, MAR, and BMI) Table 1. Descriptive data of the individuals. Ankara, Turkey, 2017.
Characteristics of the individuals Men (n:117) Women (n:548) Total (N:665)
Mean SD Mean SD p* Mean SD
Age (years) 21.3 1.68 20.8 1.77 0.012* 20.9 1.76
BMI (kg/m2) 23.3 2.67 21.5 2.89
0.000* 21.8 2.94
Energy (kcal) 2318.3 940.61 2218.2 1082.49 0.354 2235.8 1058.90 Carbohydrates (g) 270.3 114.36 252.4 111.19 0.116 255.5 111.87
Protein (g) 81.8 36.83 74.8 37.34 0.063 76.0 37.32
Fat (g) 97.8 43.66 98.3 78.70 0.941 98.2 73.72
Eating for Physical Rather than Emotional Reasons
3.3 0.49 3.1 0.51 0.001* 3.1 0.51
Unconditional Permission to Eat 3.1 0.49 3.0 0.50 0.002* 3.0 0.50
Reliance on Hunger and Satiety Cues 3.1 0.92 3.3 0.61 0.039* 3.3 0.67
Body-Food Choice Congruence 3.8 0.81 3.6 0.86 0.015* 3.6 0.86
Total IES-2 score 3.3 0.37 3.2 0.32 0.001* 3.2 0.33
BMI classification n % n % pb n %
Underweight 4 3.40 81 14.80 0.000b 85 12.80
Normal 80 68.40 399 72.80 479 72.00
Overweight 32 27.40 62 11.30 94 14.10
Obese 1 0.80 6 1.10 7 1.10
Note: Independent Sample t-test p*<0.05; Chi-square: pb<0.01.
BMI: Body Mass Index (kg/m2); IES-2: Intuitive Eating Scale-2; SD: Standard Deviation.
were evaluated using linear regression analysis,
models were deemed important (R2:0.030)
p<0.01). Although, BMI and energy were not
significantly related to the IES-2 score (p>0.05), age, gender and MAR had an effect in the model for the score (p<0.05) (Table 4).
D I S C U S S I O N
The results of this study showed that the intuitive eating score varied according to gender. The total IES-2 score and its subscales (except for Reliance on Hunger and Satiety Cues score) for women were significantly lower. Similarly, Tylka
et al. [12] reported that men scored significantly
Table 2
. Mean and Standart Deviation values of daily nutrients intakes, NAR, and MAR scor
e.
Ankara
, T
urkey
, 2017.
Energy and Nutrients
Men (n:117) W omen (n:548) Total (N:665) Intake Amount NAR% Intake Amount NAR % p * Intake Amount NAR% M ± SD M ± SD M ± SD M ± SD M ± SD M ± SD Pr otein (g) 81.8 ± 36.8 95.2 ± 12.2 74.7 ± 37.3 91.3 ± 14.4 0.063 76.0 ± 37.3 91.9 ± 14.2 Fiber (g) 24.5 ± 12.5 60.8 ± 24.5 24.8 ± 12.8 80.2 ± 21.3 0.771 24.8 ± 12.7 76.8 ± 23.1 V itamin B 6 (mg) 1.8 ± 0.9 92.8 ± 15.6 1.7 ± 0.9 90.8 ± 15.7 0.258 1.7 ± 0.8 91.2 ± 15.7 Folate (mcg) 380.0 ± 198.1 78.0 ± 21.2 355.3 ± 179.2 75.3 ± 22.6 0.183 165.7 ± 86.7 75.7 ± 22.4 V itamin B 12 (mcg) 4.7 ± 3.1 92.8 ± 18.4 4.3 ± 3.2 89.4 ± 19.9 0.320 4.4 ± 3.2 90.0 ± 19.8 V
itamin C (mg)
120.6 ± 106.7 76.1 ± 29.2 127.1 ± 98.5 86.6 ± 23.6 0.528 125.9 ± 99.9 84.7 ± 24.9 Calcium (mg) 682.2 ± 403.1 99.8 ± 1.6 753.1 ± 422.8 99.9 ± 0.3 0.098 740.6 ± 420.0 99.9 ± 0.7 Phosphor (mg) 1311.9 ± 622.9 98.2 ± 8.0 1276.9 ± 628.2 97.6 ± 7.8 0.585 1283.1 ± 626.9 97.7 ± 7.9 Potassium (mg) 2794.1 ± 1523.1 56.3 ± 25.4 2820.0 ± 1449.9 57.3 ± 24.7 0.862 2815.1 ± 1461.9 57.2 ± 24.8 Magnesium (mg) 304.3 ± 160.9 68.1 ± 23.9 310.3 ± 158.7 80.4 ± 21.1 0.710 309.2 ± 158.9 78.2 ± 22.1 Ir on (mg) 14.2 ± 7.3 96.9 ± 10.2 13.2 ± 6.3 67.2 ± 23.6 0.152 13.4 ± 6.5 72.5 ± 24.6 Zinc (mg) 11.2 ± 5.4 82.6 ± 20.1 10.5 ± 5.1 90.7 ± 14.7 0.168 10.6 ± 5.2 89.3 ± 16.1 MAR% 83.2±13.8 83.9±14.1 0.605 83.8±14.1 Note: p
*: Significance level of the dif
fer
ence between the mean values of intake amounts of gr
oups. M: Mean; SD: Standar
d Deviation; NAR: Nutrient Adequacy
Ratio
; MAR: Mean Adequacy
Ratio
.
study of college undergraduates, women scored lower on Eating for Physical Reasons; they were also less attuned to their bodies' signals about hunger and fullness than men [10]. However, this study shows that women remain more attuned to their bodies regarding hunger and fullness than men. This can be explained by the fact that girls learn at a young age to associate eating with relief from negative emotions, which may be caused by the pressures they experience from parents regarding what, when, and how much to consume [22], On the other hand, in some studies, gender was not related to the intuitive eating score [23-25].
Although this study was conducted on undergraduates, age was found to be an important factor for intuitive eating. In a study, participants over the age of 22 tended to score higher on intuitive eating; on the other hand, it has been stated that demographic factors such as age and year in college were less clearly associated with intuitive eating values [26]. This result shows that age has a positive effect on intuitive eating. However, this relationship should also be assessed among older age.
It is known that intuitive eating covers the concept of "body wisdom" (the body will instinctively maintain the variety of food needed to sustain health) [4]. Intuitive eaters can be expected to have more nutritious eating habits and more positive eating habits than non-intuitive eaters. Some studies have found that intuitive eating develops positive dietary intake/ eating habits [16,27], but it has been determined that there is no effect in another study whose sample size is low and homogeneous [28]. From this point of view, in the present study, intuitive eating was associated with dietary adequacy. Participants with a high IES-2 score have higher dietary adequacy.
Table 3. Correlation of BMI with dietary intake, MAR and IES-2. Ankara, Turkey, 2017.
Dietary intake
Men (n=117) Women (n=548) Total (N=665)
r p r p r p
Energy (kcal) -0.098 0.294 -0.082 0.056 -0.073 0.061
Carbohydrate (g) -0.142 0.128 -0.083 0.053 -0.075 0.054
Protein (g) -0.102 0.273 -0.070 0.104 -0.055 0.157
Fat (g) -0.029 0.755 -0.057 0.185 -0.052 0.177
MAR -0.105 0.261 -0.049 0.254 -0.061 0.117
Eating for Physical Rather than Emotional Reasons -0.035 0.705 -0.061 0.154 -0.023 0.547 Unconditional Permission to Eat 0.062 0.508 -0.108 0.011* -0.046 0.236
Reliance on Hunger and Satiety Cues 0.071 0.449 0.066 0.124 0.044 0.257 Body-Food Choice Congruence 0.021 0.819 -0.152 0.000* -0.098 0.012*
Total IES-2 score 0.064 0.491 -0.095 0.026* -0.032 0.406
Note: Pearson Correlation p<0.05.
IES-2: Intuitive Eating Scale-2; BMI: Body Mass Index; MAR: Mean Adequacy Ratio.
Table 4. Total IES-2 score linear regression analysis. Ankara, Turkey, 2017.
Model Beta t p
Total IES-2 score
Age (year) 0.078 2.017 0.044
Gender -0.135 -3.397 0.001
BMI (kg/m2) -0.064 -1.618 0.106
Energy (kcal/day) -0.061 -1.222 0.222
MAR% 0.098 1.969 0.049
Note: R2=0.030; p=0.001.
BMI: Body Mass Index (kg/m2); MAR: Mean Adequacy Ratio.
hand, there was no significant relationship between BMI and IES-2 score in men unlike
the other study conducted by Denny et al. [24].
This can be explained by the low number of men in that study (17.6%). Young people who are becoming aware of their bodies and being
influenced by external messages (e.g., parental
pressure about food) may be particularly vulnerable to the effects of dieting on intuitive eating, particularly women. These results support the idea that a low IES-2 score in women may negatively affect weight control.
C O N C L U S I O N
In conclusion, age, gender and dietary adequacy have been shown to be an important factor for determining intuitive eating. Moreover, the results of this study indicate an inverse correlation of intuitive eating with the BMI in women. This study shows that intuitive eating has a positive relationship with dietary adequacy. Thus, obesity prevention and treatment strategies have mainly focused on counteracting detrimental dietary behaviors. Considering adaptive behaviors, such as intuitive eating, could be useful for developing behavioral guidelines insisting on incentives rather than restrictions, particularly regarding gender, as the results of this study have shown. Factors affecting intuitive eating need to be investigated in longitudinal studies in future studies.
C O N T R I B U T O R S
S BILICI designed the study and wrote the protocol. B KOCAADAM and H MORTAS conducted literature research and provided summaries of previous research studies. E KOKSAL and Ö KUCUKERDONMEZ conducted the statistical analysis and revised the manuscript. All authors contributed to and have approved the final manuscript.
A C K N O W L E D G E M E N T S
The authors thank the participants for their support with the data collection. The authors alone are responsible for the content and writing of the article.
R E F E R E N C E S
1. Karaoglan D, Tansel A. Determinants of obesity in Turkey: A quantile regression analysis from a developing country. 2017 [cited 2017 Sept 15]. Available from: https://ssrn.com/abstract= 2900125
2. Ng M, Fleming T, Robinson M, Thomson B, Graetz N, Margono C, et al. Global, regional, and national
prevalence of overweight and obesity in children and adults during 1980-2013: A systematic analysis for the global burden of disease study 2013. Lancet. 2014;384(9945):766-81.
3. Lang A, Froelicher ES. Management of overweight and obesity in adults: Behavioral intervention for long-term weight loss and maintenance. Eur J Cardiovasc Nurs. 2006;5(2):102-14.
4. Van Dyke N, Drinkwater EJ. Review article relationships between intuitive eating and health indicators: Literature review. Public Health Nutr. 2014;17(8):1757-66.
5. Herbert B, Blechert J, Hautzinger M, Matthias E, Herbert C. Intuitive eating is associated with interoceptive sensitivity: Effect on body mass index. Appetite. 2013;70:22-30.
6. Tribole E, Resch E. Intuitive eating: A recovery book for the chronic dieter: Rediscover the pleasures of eating and rebuild your body image. New York: St.Martin's Press; 1995.
7. Anglin JC. Assessing the effectiveness of intuitive eating for weight loss-pilot study. Nutr Health. 2012;21(2):107-15.
8. Akay GG. Yeme bozukluklarında fiziksel açlığı duygusal açlıktan ayırt edebilme. Turkiye Klinikleri J Psychol-Special Topics. 2016;1(2):17-22. 9. Hawks SR, Merrill RM, Madanat HN. The intuitive
eating scale: Development and preliminary validation. Am J Health Educ. 2004;35(2):90-9. 10. Tylka TL, Van Diest AMK. The intuitive eating
scale-2: Item refinement and psychometric evaluation with college women and men. J Couns Psychol. 2013;60(1):137-53.
11. Baş M, Karaca KE, Saglam D, Arıtıcı G, Cengiz E, Köksal S, et al. Turkish version of the intuitive eating Scale-2: Validity and reliability among university students. Appetite. 2017;18:391-7. 12. Tylka TL, Calogero RM, Daníelsdóttir S. Is intuitive
eating the same as flexible dietary control? Their links to each other and well-being could provide an answer. Appetite. 2015;95:166-75.
13. Bacon L, Stern JS, Van Loan MD, Keim LN. Size acceptance and intuitive eating improve health for obese, female chronic dieters. J Acad Nutr Diet. 2005;105(6):929-36.
14. Provencher V, Bégin C, Tremblay A, Mongeau L, Corneau L, Dodin S, et al. Health-at-every-size and eating behaviors: 1-year follow-up results of a size acceptance intervention. J Am Diet Assoc. 2009;109(11):1854-61.
16. Hawley G, Horwath C, Gray A, Bradshaw A, Katzer L, Joyce J, et al. Sustainability of health and lifestyle improvements following a non-dieting randomised trial in overweight women. Prev Med. 2008;47(6):593-9.
17. Anderson L, Erin E, Schaumberg K, Dmochowski S, Anderson D. Contributions of mindful eating, intuitive eating, and restraint to BMI, disordered eating, and meal consumption in college students. Eat Weight Disord. 2015;21(1):83-90.
18. Mirmiran P, Azadbakht L, Esmaillzadeh A, Azizi F. Dietary diversity score in adolescents-a good indicator of the nutritional adequacy of diets: Tehran lipid and glucose study. Asia Pac J Clin Nutr. 2004;13(1):56-60.
19. Lohman TJ, Roache AF, Reynaldo M. Anthropometric standardization reference manual. Med Sci Sports Exerc. 1992;24(8):952.
20. World Health Organization. Obesity: Preventing and managing the global epidemic. Geneva: WHO; 2000. WHO Technical Report Series No.894. 21. Dockendorff SA, Petrie TA, Greenleaf CA, Martin S.
Intuitive eating scale: An examination among early adolescents. J Couns Psychol. 2012;59(4):604-11. 22. Galloway AT, Farrow CV, Martz DM. Retrospective
reports of child feeding practices, current eating behaviors, and BMI in college students. Obesity. 2010;18(7):1330-5.
23. Anglin JC, Borchardt N, Ramos E, Mhoon K. Diet quality of adults using intuitive eating for weight loss-pilot study. Nutr Health. 2013;22(3-4):255-64.
24. Denny KN, Loth K, Eisenberg ME, Neumark-Sztainer D. Intuitive eating in young adults: Who is doing it, and how is it related to disordered eating behaviors? Appetite. 2013;60(1):13-9. 25. Gan WY, Yeoh WC. Associations between body
weight status, psychological well-being and disordered eating with intuitive eating among Malaysian undergraduate university students. Int J Adolesc Med Health. 2017. Ahead of print. http:dx.doi.org/10.1515/ijamh-2017-0095 26. Hawks SR, Merrill RM, Madanat HN, Miyagawa
T, Suwanteerangkul J, Guarin CM, et al. Intuitive eating and the nutrition transition in Asia. Asia Pac J Clin Nutr. 2004;13(2):194-203.
27. Madden CE, Leong SL, Gray A, Horwath CC. Eating in response to hunger and satiety signals is related to BMI in a nationwide sample of 1601 mid-age New Zealand women. Public Health Nutr. 2012;15(12):2272-9.
28. Cole RE, Horacek T. Effectiveness of the "my body knows when" intuitive-eating pilot program. Am J Health Behav. 2010;34(3):286-97.
29. Camilleri GM, Méjean C, Bellisle F, Andreeva VA, Kesse-Guyot E, Hereberg S, et al. Intuitive eating is inversely associated with body weight status in the general population-based NutriNet-Santé study. Obesity. 2016;24(5):1154-61.