1
Microplastics effects in Scrobicularia plana
1 2
Francisca Ribeiro1, Ana R. Garcia2,3, Beatriz P. Pereira1, Maria Fonseca1, Nélia C.
3
Mestre1, Tainá G. Fonseca1, Laura M. Ilharco2, Maria João Bebianno1*
4
1CIMA, University of Algarve, Campus de Gambelas, 8000-139 Faro, Portugal
5
2Centro de Química-Física Molecular and IN – Institute of Nanoscience and Nanotechnology,
6
Complexo I, Instituto Superior Técnico, Universidade de Lisboa, Av. Rovisco Pais 1, 1049-001 7
Lisboa, Portugal 8
3Departamento de Química e Farmácia, FCT, Universidade do Algarve, Campus de Gambelas,
9
8000-139 Faro, Portugal. 10
11
*corresponding author: [email protected] 12 13 14 15 16 17 18 19 20 21 22 23 24 25 26 27 28 29 30 31 32
2
Abstract
33 34
One of the most common plastics in the marine environment is polystyrene (PS) that can
35
be broken down to micro sized particles. Marine organisms are vulnerable to the exposure
36
to microplastics. This study assesses the effects of PS microplastics in tissues of the clam
37
Scrobicularia plana. Clams were exposed to 1 mg L-1 (20 µm) for 14 days, followed by
38
7 days of depuration. A qualitative analysis by infrared spectroscopy in diffuse reflectance
39
mode period detected the presence of microplastics in clam tissues upon exposure, which
40
were not eliminated after depuration. The effects of microplastics were assessed by a
41
battery of biomarkers and results revealed that microplastics induce effects on antioxidant
42
capacity, DNA damage, neurotoxicity and oxidative damage. S. plana is a significant
43
target to assess the environmental risk of PS microplastics.
44 45
Key words: ecotoxicology, biomarkers, neurotoxicity, oxidative stress, genotoxicity,
46
bivalves, peppery furrow shell
47 48
Main findings
49
S. plana is an important target of PS microplastics ecotoxicity.
50
S. plana can be a suitable biomonitor for assessing PS microplastics
51 environmental risk. 52 53 54 55 Introduction 56 57
Plastics are used in everyday life and in several items: cars, electronic equipment,
58
furniture, footwear, construction, food packages, among others. The largest plastics
59
producers are the sectors of packaging (39%) and construction (21%), followed by
60
transportation, agriculture, household and electronics (Pinto, 2012). The annual
61
production of plastics increased considerably from 1.5 million tons in 1950 (decade where
62
the commercial development of polyolefins, polypropylene and polyethylene started), to
63
approximately 322 million tons in 2015 (PlasticsEurope, 2015; Wright et al., 2013b),
64
representing an increase of 9% per year, approximately. This production volume, coupled
3
with their high durability, resistance to degradation, low weight and low recycled volume,
66
leads to the widespread and accumulation of discarded plastics in landfills and, as litter,
67
in terrestrial and aquatic habitats worldwide (Derraik, 2002; Moore, 2008; Thompson et
68
al., 2004). The consumption of plastics in many European countries indicates that the
69
plastic resins most used since 2007 are low density polyethylene (LDPE), high density
70
polyethylene (HDPE), polypropylene (PP), polyvinyl chloride (PVC), polyethylene
71
terephthalate (PET)and polystyrene (PS).
72
It is not possible to obtain reliable estimates of the amount of plastic debris
73
reaching the marine environment, but they are, however, quite substantial (Derraik,
74
2002). The major sources of plastic materials and debris in the sea are fishing fleet
75
(Cawthorn, 1989), and marine recreational activities (Pruter, 1987; Wilber, 1987). Plastic
76
also reaches the sea as litter from land-based sources, carried by rivers and municipal
77
drainage systems (Derraik, 2002; Williams & Simmons, 1997). In the sea, these versatile
78
and non-biodegradable polymers are found in the form of larger items (macroplastics),
79
including hulls of boats and fishing nets many meters long, and tiny fragments (Browne
80
et al., 2008; Canesi et al., 2015). When exposed to UV-B radiation, to the oxidative
81
properties of the atmosphere and to the hydrolytic properties of seawater, these plastics
82
brittle and break into smaller pieces, until they reach micrometres in length
83
(microplastics), and potentially, also the nano-scale level (nanoplastics) (Browne et al.,
84
2008; Canesi et al., 2015).
85
Microplastics are defined as particles with less than 5 mm in diameter, according
86
to the National Oceanic and Atmospheric Administration of the United States of America
87
(NOAA, 2015). Their presence in the ocean is distributed according to the currents
88
(Lusher, 2015). The distinction between primary and secondary microplastics is based on
89
whether these particles were originally manufactured to be that size (primary) or whether
90
they resulted from the breakdown of larger items (secondary) (Kershaw, 2015). The
91
primary source of microplastics includes different typology; polyethylene (PE),
92
polypropylene (PP) and polystyrene (PS) from cleaning products or cosmetics (Fendall
93
& Sewell, 2009), or from industries or industrial effluents (Lusher, 2015). The secondary
94
source is the degradation of plastics under marine conditions, that dramatically reduces
95
the molecular weight of these polymers (Andrady, 2011). Ideally, these particles may also
96
undergo further degradation by microbial action, releasing carbon (Andrady, 2011).
97
Although microplastics greatly exceed large plastic items in marine systems, they are still
98
only a small proportion of the total mass of plastics in the ocean. Therefore, microplastics
4
became a growing issue in such a way that the Marine Strategy Framework Directive
100
(MSFD Nº 2008/56/EC) highlights microplastics and their associated chemicals as one
101
of the major policy descriptors whose impact need to be assessed in the marine
102
environment (Zarfl et al., 2011).
103
The presence of microplastics is documented in most habitats in the open ocean,
104
seas and beaches, surface waters, the water column and in the deep ocean (Lusher, 2015),
105
and recently, in freshwater systems (Eerkes-Medrano et al., 2015). In Portugal, 62% of
106
microplastics were identified in the North Atlantic by trawling, with a density of 580 000
107
particles per km2. 61% of the water samples collected in the Portuguese coast contained
108
microplastics and the concentration was higher in the Vicentina Coast and Lisbon (0.036
109
and 0.033 particles m-3, respectively) than in the Algarve and Aveiro areas (0.014 and
110
0.002 particles per m3, respectively) (Lusher, 2015).
111
The occurrence of plastic in the ocean and the potential impact to marine
112
organisms are of growing concern (Canesi et al., 2015). The fact that microplastics have
113
such a small size and different shapes actively contributes to their bioavailability and
114
accumulation in organisms of lower trophic levels. As the particles interact with plankton
115
and sediments, both organisms that feed on suspended particles and the ones that feed on
116
the bottom are at risk of, accidentally or selectively, ingesting plastic (Lusher, 2015).
117
Particles with less than 20 µm are likely to be ingested and egested (Lee et al., 2013) by
118
small organisms (Thompson et al., 2004; Wright et al., 2013b). Microplastics with size
119
between 1 and 5 mm can compromise the nutrition and digestion (Codina-García et al.,
120
2013). The ingestion of plastics with a greater size can cause serious external and internal
121
injuries, ulcers, digestive tract blockage, false sense of fullness, loss of feeding capacity,
122
impairment and inability to avoid predators or death (Gall & Thompson, 2015).
123
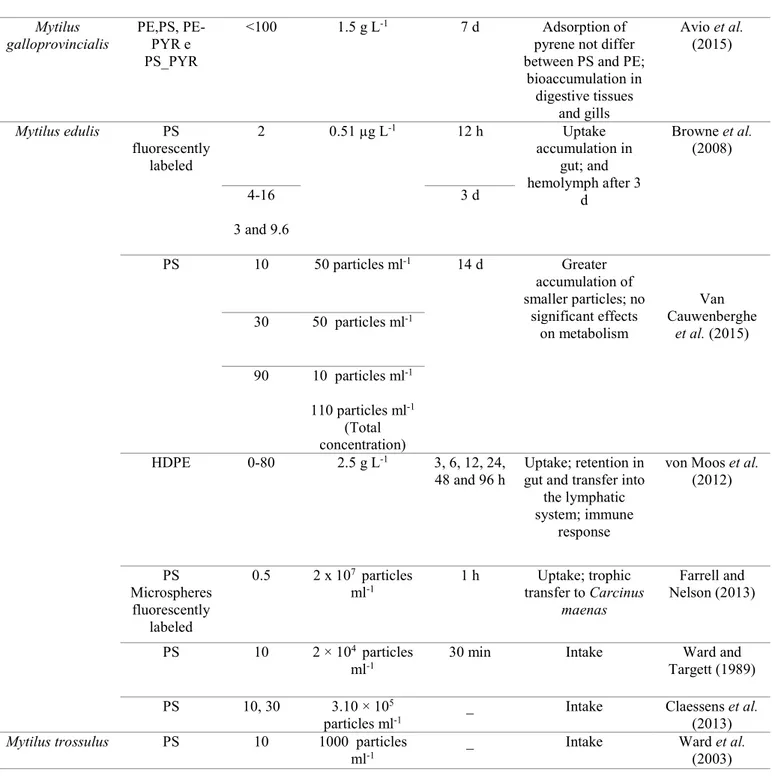
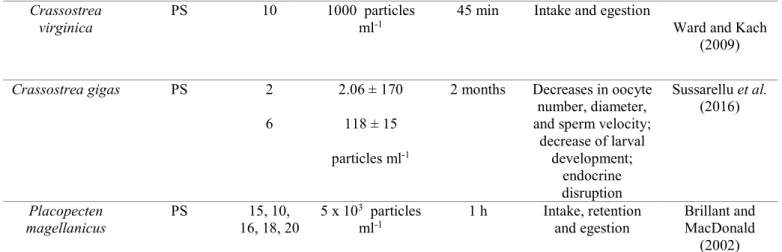
Microplastics ingestion was documented for a wide range of marine vertebrates
124
and invertebrates for wild populations (Table 1). Whilst it is apparent that microplastics
125
have become widespread and ubiquitous in the marine environment, the information on
126
accumulation, mode of action and biological impact of this emerging contaminant in
127
marine organisms is still scarce (Wright et al., 2013b). Microparticles are inert and, after
128
ingestion, pass through the cell membrane and are incorporated into tissues, particularly
129
in the gut cavity (Wright et al., 2013b). After passing to the circulatory system they are
130
transferred to other organs, via hemolymph, where they are retained for several weeks in
131
several organs and cause adverse effects (Browne et al., 2008). Experiments with
5
different sizes (Mazurais et al., 2015), shapes (Graham & Thompson, 2009) and types
133
(Green et al., 2016) were conducted in order to mimic a more realistic scenario and truly
134
assess the effects of microplastics. Table 2 summarizes the information about the
135
ecotoxicological effects of microplastics in several bivalves that include weight loss,
136
reduced feeding activity, increased phagocytic activity, transference to the lysosomal
137
system, accumulation and inhibition of acetylcholinesterase (AChE) activity (e.g. Avio
138
et al., 2015a; von Moos et al., 2012; Van Cauwenberghe et al., 2015).
139
The aim of this study was to investigate the presence and mode of action of
140
polystyrene microparticles (one of the most largely used plastic worldwide, with a density
141
of 1.09 g cm-3) in different tissues of the peppery furrow shell Scrobicularia plana and
142
assess the potential ecotoxicological risk of this emerging contaminant in this species.
143
The presence of microplastics in gills and digestive gland of S. plana was evaluated by
144
infrared spectroscopy in diffuse reflectance mode and their effects by using a battery of
145
biomarkers of oxidative stress (superoxide dismutase (SOD), catalase (CAT), glutathione
146
peroxidases (GPx), biotransformation (glutathione-S-transferases (GST)), genotoxicity,
147
neurotoxicity and oxidative damage.
148 149 150
Materials and methods
151 152
Microplastics characterization
153
Monodisperse PS microplastics were obtained from Sigma-Aldrich (Germany)
154
with the particle size 20 µm and density 1.05 g cm-3. Two stock solutions (100 mg L-1)
155
were prepared: one in ultrapure water (18 MΩ/ cm) and another in natural seawater (S =
156
35), both maintained in constant aeration.
157
The microplastics size was determined by optical microscopy (OM) and dynamic
158
light scattering (DLS), and the surface charge (zeta potential) by electrophoretic light
159
scattering (ELS), for both PS solutions. The zeta potential of the microparticles was
160
determined by electrophoresis mobility measurements at 25ºC using a DLS particle sizer
161
(ZetaSizer Nano ZS90, Malvern Inc.) in a disposable polycarbonate capillary cell
162
(DTS1061).
6
The sedimentation rate (SR) was measured by the change of turbidity with time
164
(0-24 h), as described in Sousa and Teixeira (2013). The SR relates to the normalized
165
microparticle turbidity C/C0, where C is the turbidity at time t and C0 the initial turbidity
166
at time 0. Then, the SR is given by the expression δ(C/C0)/δt, estimated from the decrease
167
in turbidity (C/C0), which occurred within the first two hours for the fast sedimentation
168
(fast SR) conditions and within 3-24 h for slow sedimentation (slow SR) conditions
169
(Keller et al., 2010).
170 171
Laboratory exposure assay
172
Scrobicularia plana (38 ± 5 mm shell length) were collected in Cabanas de Tavira,
173
Ribeira do Almargem (South of Portugal) (N 37º7'59.75'' W 7 36'34.95'') and transferred
174
to the laboratory, where they were acclimated for 7 days at constant aeration, with a
175
photoperiod of 12h light and 12h darkness. Three replicate aquaria were used for each
176
control and exposed group to 1 mg L-1 of PS microplastics which corresponded to around
177
4 particles ml-1. This value is below the concentrations used in previous laboratory
178
exposure experiments (summarized in Table 2) although higher than environmentally
179
relevant concentrations of microplastics found in seawater in regions highly
180
contaminated, e.g. ~0.5 particles mL-1 in South Korea (Song et al., 2014) or 0.1 particles
181
mL-1 (Norén, 2007).
182
Sixty clams were placed in each glass aquaria filled with 20 L of natural seawater
183
with constant aeration and no sediments were added. Glass Pasteur pipettes were used to
184
provide aeration and the use of plastic material was avoided during the experiment.
185
Exposure ran for 14 days, followed by 7 days of depuration. The water was changed every
186
24 hours with subsequent addition of PS microplastics. Immediately before addition of
187
PS microplastics, the 100 mg L-1 stock solution in ultra-pure water was sonicated for 30
188
minutes (Ultrasonic bath VWR International, 230 V, 200 W, 45 kHz frequency). During
189
the experiment abiotic parameters were checked in all tanks by measuring temperature
190
(18.0 ± 1 ºC), salinity (35 ± 0.2), percentage of oxygen saturation (93.0 %) and pH (7.8),
191
with the multiparametric probe TRIPOD (from PONSEL). Clams were not fed to avoid
192
any interaction of microplastics and food.
193
Unexposed and exposed clams were collected after 0, 3, 7 and 14 days of
194
exposure, and after the 7 days of depuration. The hemolymph was immediately collected
195
by gently prying the shell open approximately 2 to 3 mm with a scalpel and the shell was
7
held open with forceps. Then, the posterior adductor muscle of the S. plana was gently
197
penetrated with a sterile hypodermic syringe 1 ml (12 mm x 12:33) and the hemolymph
198
easily collected using intermittent suction. To avoid potential contamination of the
199
haemolymph, the water inside the shell was drained from each clam prior to hemolymph
200
extraction, and a new syringe was used for each replicate of each treatment and each
201
sampling day. Gills and digestive gland were dissected and stored at -80 ºC until analysis.
202
No significant mortality was observed between treatments, during the accumulation and
203
depuration periods (p >0.05).
204 205 206
Qualitative assessment of microplastics accumulation
207
A qualitative assessment of microplastics accumulation and transport to different
208
tissues was conducted by optical microscopy (OM) analysis of the hemolymph of control
209
and exposed clams at day 14. In addition, gills and digestive gland tissues collected at
210
different times of exposure were lyophilized at -40 ºC, during approximately 48 hours
211
with a Modulyo freeze dryer and analysed by infrared spectroscopy. This analysis was
212
performed in a Mattson RS1 Fourier transform infrared spectrophotometer, with a wide
213
band MCT (mercury cadmium telluride) detector, in the range 400-4000 cm-1, at 4 cm-1
214
resolution. Since the samples were powders, in order to avoid compressing the tissues to
215
the high pressures needed to prepare disks, the most convenient mode for obtaining the
216
spectra was in diffuse reflectance (DRIFT). Each lyophilized sample was diluted (~1:4)
217
in KBr (from Aldrich, FTIR grade) and finely grinded in an agate mortar, to reduce
218
particle size and thus decreases diffuse Fresnel reflectance. This mixture was placed in a
219
11 mm diameter sample cup and pressed to obtain a very smooth surface. The cup was
220
filled, in order to attain a so-called infinite thickness (all the light is reflected or absorbed
221
by the sample) and mounted in a Graseby/Specac Selector accessory, to collect all the
222
diffusely reflected radiation, excluding specular reflection. Each DRIFT spectrum
223
resulted from the ratio of 500 single-beam scans obtained for the sample to the same
224
number of background scans for pure KBr.
225
The spectra in reflectance (R∞) were transformed into Kubelka-Munk units [f(R∞)]
226
using the FIRST software, according to the Kubelka-Munk equation (Mitchell, 1993;
227
Stuart, 2005)
8
( ) =(1 − )
2
229
The spectra were baseline corrected, normalized to a typical band of the tissues
230
not overlapped with a PS band, and the average of 10 samples was calculated.
231 232 233
Condition index
234
To assess the physiological status of control and PS exposed clams, soft tissues
235
and shells were weighted, and the condition index (CI) determined as the percentage (%)
236
of the ratio between drained weight of the soft tissues (g) and total weight (g), according
237 to Gomes et al. (2013). 238 239 Biomarker analysis 240 241 Antioxidant enzymes 242 243
Prior to the analysis of the enzymatic activities, the tissues (gills and digestive
244
glands) of control and microplastic exposed clams (6 replicates of individual tissues) were
245
weighed and rapidly buffered in Tris-HCl buffer (50 mM Tris-HCl, 250 mM Sucrose,
246
5mM MgCl2, 1mM DTT, pH=7.6) (the tissue-to-buffer ratio was 1:3 wet weight
247
tissue/volume of buffer), homogenized in an ice bath and centrifuged at 10000 g, for 10
248
minutes, at 4 ºC, using a biofuge stratus 230 V centrifuge (Thermo scientific, Germany).
249
Both the soluble and pellet fractions were stored at -80 ºC for future analysis. Enzyme
250
activities were measured in the cytosolic fraction. To determine SOD activity, the
251
reduction of cytochrome c by the system xanthine oxidase/hypoxanthine was measured
252
at 550nm (McCord & Fridovich, 1969) and results expressed in U mg−1 of total protein
253
concentration. CAT activity was determined by the decrease in absorbance at 240nm due
254
to H2O2 consumption, with a molar extinction coefficient of 40 M−1 cm−1 (Greenwald,
255
1987) and results expressed as µmol min−1 mg−1 of total protein concentration. GP X
256
activity was measured through NADPH oxidation in the presence of excess glutathione
257
reductase, reduced glutathione and hydroperoxide as substrate, at 340nm (Lawrence &
258
Burk, 1978) and results expressed as nmol min−1 mg−1 of total protein concentration. GST
259
activity was measured by the conjugation of 1-chloro-2,4-dinitrobenzene (CDNB) with
9
reduced glutathione (GSH) and the increase of absorbance measured at 340 nm (Ԑ 340
261
(CDNB) = 9.6 mM-1 cm-1) (Habig et al., 1974). The results are expressed in µmol CDNB
262 min-1 mg protein-1. 263 264 265 Oxidative damage 266
Before the analysis of oxidative damage, gills and digestive gland (6 replicates of
267
individual tissues per treatment) were weighed and rapidly buffered in 0.02M Tris-HCl
268
(0.1 M HCl, 0.2 M Tris, pH=8.6) (the tissue-to-buffer ratio was 1:3 wet weight
269
tissue/volume of buffer). Then, 10 µl of BHT (Butylated hydroxytoluene) was added, per
270
each ml of Tris-HCl [0.02M]. The samples were homogenized in an ice bath and
271
centrifuged at 30000 g, for 45 minutes, at 4 ºC, using a biofuge stratus 230 V centrifuge
272
(Thermo scientific, Germany). Both the cytosolic and mitochondrial fractions were stored
273
at -80 ºC for future analysis. Lipid peroxidation (LPO) was quantified based on the
274
method described by Erdelmeier et al. (1998) - determining malondialdehyde (MDA) and
275
4-hydroxyalkenals (4-HNE) concentrations upon the decomposition by polyunsaturated
276
fatty acid peroxides. The tissue supernatant (200 μL) was incubated at 45 ºC, for 60
277
minutes, with 650 μL of 1-methyl-2-phenylindone diluted in methanol and 150 μL of
278
methanesulfonic acid. The absorbance was measured at 586 nm and LPO levels are
279
expressed as nmol malondialdehyde (MDA) + 4-HNE g−1 per mg of protein.
280 281
AChE activity
282
Gills (6 replicates of individual tissues per treatment) were homogenized on ice in
283
five volumes of a Tris-HCl buffer (100 mM, pH 8.0) containing 10% Triton X-100 and
284
centrifuged at 12000g, for 30 minutes, at 4º C. Anti-cholinesterase activity was measured
285
by the modified Ellman’s colorimetric method (Ellman et al., 1961), assessed by the
286
addition of Ellman’s reagent – DTNB - using AChEI (acetylcholine) as substrate, for the
287
estimation of respective thiocholine (ChE). The absorbance is measured, at 405 nm
288
(coefficient of extinction of = 13.6 mM-1.cm-1), to estimate the amount of ChE liberated
289
by the reaction, which is proportional to the AChE activity (Colovic et al., 2013). The
290
results are expressed by nmol AChEI min-1 mg protein-1.
291 292
10
Genotoxicity
293
Genotoxicity was estimated using the comet assay in a slightly modified version
294
of Singh et al. (1988) and described in Almeida et al. (2011). Microscopic slides were
295
coated with 0.65% normal melting point agarose (NMA), in Tris-acetate EDTA. After
296
collection, hemolymph cells were centrifuged at 3000 rpm for 3 min (4 ºC), and the pellets
297
with isolated cells suspended in 0.65% low melting point agarose (LMA) in Kenny’ s salt
298
solution, and casted on the microscope slides. Afterwards, the slides with the embedded
299
cells were immersed in a lysis buffer (2.5 M NaCl, 100 mM EDTA, 10 mM Tris, 1%
300
Triton X-100, 10% Dimethylsulfoxide, 1% Sarcosil, pH 10, 4 ºC), for the diffusion of
301
cellular components and DNA immobilization in agarose. Following the lysis step, slides
302
were placed in an electrophoresis chamber containing electrophoresis buffer (300 mM
303
NaOH, 1 mM EDTA, adjusted at pH 13, 4 ºC), gently submerged and left in this solution
304
for 15 minutes, to permit DNA unwinding. The electrophoresis was carried out and, once
305
concluded, the slides were removed and immersed in a neutralizing solution (0.4 mM
306
Tris, pH 7.5) and rinsed with ultrapure water. Then, the slides were allowed to dry for 48
307
hours, from which the analysis in fluorescence microscope was possible. The slides were
308
stained with 4,6-diamidino-2- phenylindole (DAPI, 1 mg mL-1) and the presence of
309
comets analysed using an optical fluorescence microscope (Axiovert S100) coupled to a
310
camera (Sony). Fifty randomly chosen cells for each slide (25 in each gel from each
311
organism) of nine organisms were scored with the Komet 5.5 image analysis system
312
(Kinetic Imaging Ltd) at a total magnification of x400. Different parameters of the comet,
313
including the olive tail moment (OTM), comet tail length and amount of DNA in the
314
comet tail (Tail DNA %) were measured, and results are expressed as mean ± STD.
315 316
Statistical analysis
317 318
Statistical differences between treatments, time of exposure/depuration and
319
tissues were assessed using parametric tests (two-way ANOVA, followed by the Tukey's
320
test) and non-parametric tests (Kruskal-Wallis, followed by multiple comparisons), after
321
normality (Shapiro-Wilk W test) and homogeneity of variances verified (Levene's test).
322
Principal component analysis (PCA) for gills and digestive gland was used to evaluate
323
the influence of PS microplastics in the determined biomarkers, in exposed clams, along
11
the period of exposure and assess the overall results. Statistical significance was defined
325 at p <0.05. 326 327 Results 328 329 PS microplastics characterization 330 331
PS microplastics characterization is summarized in Table 3. DLS measurements
332
show that dh (hydrodynamic diameter) of PS microplastics is 18.4 ± 1.33 µm, which is
333
similar to the size specified by the manufacturer. ζ - potential measurements show that
334
PS microplastics have highest negative surface charge in seawater (-12.4 ± 2.36 mV) than
335
in Milli-Q water (-52.6 ± 2.34 mV) (p <0.05), showing the tendency of these PS
336
microplastics to aggregate in seawater.
337
Turbidity (C/C0) of PS microplastics suspension was measured to assess the
338
sedimentation rate (SR) (Figure 1). The SR is faster during the first two hours, estimated
339
from the initial 5% decrease in normalised particle turbidity and slows down after this
340
period of time. No significant differences in turbidity decrease were observed between
341
Mili-Q water (97.94%) and seawater (94.65 %) over time (24 h) (p > 0.05). However, a
342
sharp decrease in turbidity is observed in MQ water during the first 2 hours (1.68 x 10⁻¹
343
h-1) although higher when compared to seawater (1.04 x 10⁻¹ h-1) (p <0.05), while for the
344
last 22 hours there is a higher decrease in SR for MQ water (3.05 x 10⁻⁴ h-1) compared to
345
seawater (1.16 x 10⁻³ h-1) indicating that, after the initial time, PS microplastics tend to
346
sediment faster in natural seawater (p < 0.05).
347 348
Condition index
349
The condition index at the beginning of the experiment (time 0) was 36.01 ± 4.04
350
%. No significant changes were observed between unexposed and exposed organisms
351
after 14 days (unexposed: 33.05 ± 4.76 %; exposed: 31.53 ± 5.30 %; p>0.05) and in the
352
elimination period (unexposed: 31.31 ± 4.58 % exposed: 31.83 ± 4.72 %; p>0.05),
353
indicating that the organisms were in good health throughout the duration of the
354
experiment.
355 356
Qualitative assessment for microplastics accumulation
12
In order to corroborate the presence of PS in the clams exposed to the aquatic
358
environment containing microplastic, optical microscopy and infrared data were
359
analysed.
360
The PS microplastics present in the hemolymph observed under the OM are in Figure
361
2. The presence of a small aggregate of PS microplastics is observed in image A and two
362
polystyrene particles in image B (highlighted by circles) indicating that, like for seawater,
363
there is a tendency for the PS microplastics to form small aggregates/agglomerates in the
364
hemolymph.
365
The diversity of the tissue samples implies variations of the infrared spectra from
366
individual specimens in the same conditions. Moreover, due to the amount of PS
367
microplastics expected to accumulate during a 14 days exposure, the spectral analysis is
368
not intended as quantitative, but only as a proof of detection of PS in the gills and digestive
369
gland of the clams. It consisted in a comparison of the average spectra of unexposed clams
370
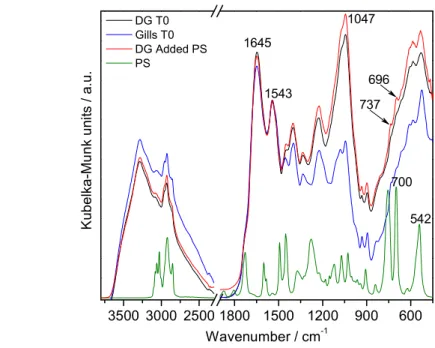
with clams exposed to PS microplastics.
371
In Figure 3, the DRIFT spectra of digestive gland and gills from clams not exposed
372
to PS microplastics (DG T0 and Gills T0, respectively) are compared to that of digestive
373
gland from specimens into which microplastics were directly added in vitro, in a known
374
amount (50 µl). The spectrum of the same PS microplastics is also included in Figure 3
375
for comparison. In order to allow the comparison of the relative intensities of the bands,
376
the spectra were normalized to the amide II mode (C-N stretching), at 1543 cm-1
377
(Matthäus et al., 2008), common to all of them, and not overlapped with any PS band or
378
the water deformation mode. The average spectra of the digestive gland and gills are
379
similar, with some features specific to the gills: a small band at 3060 cm-1, a clear splitting
380
of the bands at 1082/1047 cm-1 and at 609/588 cm-1. On the other hand, the region below
381
1200 cm-1 is much stronger (relatively to the amide II band) for the digestive gland. The
382
average spectrum of digestive gland with added microplastics (DG Added PS) shows a
383
general increase of relative intensities in the regions overlapped with PS bands; new small
384
bands appear at 696 and 737 cm-1 that may be assigned to the strongest bands of the
385
polymer, slightly shifted due to interactions with the specimen tissues. In the spectrum of
386
PS microplastic these bands appear at 700 and 756 cm-1, and are related to out of plane
387
C-H deformation modes of the benzene rings (Holland-Moritz & Siesler, 1976; Koenig,
388
1999; Liang & Krimm, 1958).
389
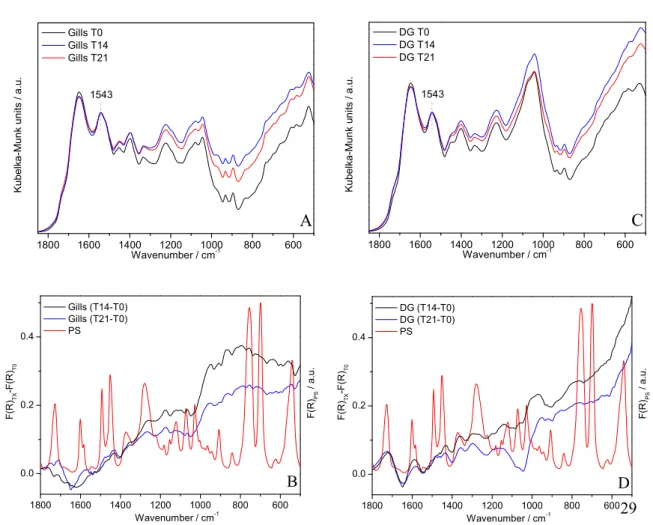
The average DRIFT spectra of samples obtained before exposure to PS
390
microplastics (T0) were compared to those exposed for 14 days (T14) and after 7
13
depuration days (T21) (Figures 4A and C for gills and digestive gland, respectively). Both
392
for gills and digestive gland the spectral region where PS absorbs mostly is stronger after
393
the exposure period and decreases during depuration, not achieving the initial relative
394
intensities.
395
The spectral subtractions (T14-T0) and (T21-T0) were calculated and compared
396
to the spectrum of PS microplasctics (Figures 4B and D for gills and digestive gland,
397
respectively). The differences (T14-T0) are generally positive for both tissues, evidencing
398
the accumulation of PS microplastics during exposure. For the gills, the region where PS
399
absorbs more strongly (below 1000 cm-1) corresponds to larger differences between T14
400
and T0, and some relative maxima observed in the high wavenumber region are
401
coincident with (or slightly shifted from) PS bands. For the digestive gland, clear maxima
402
in T14-T0 differences are coincident with PS bands, at 1725, 1590, 1435, 1360 and 1275
403
cm-1. In the low wavenumber region, the spectra at 0 and 14 days are both strong,
404
rendering the definition of eventual PS bands more difficult. A partial elimination of PS
405
during the depuration period is unambiguous from the spectral differences (T21-T0) that
406
remain positive for both tissues, although smaller than (T14-T0).
407 408 409
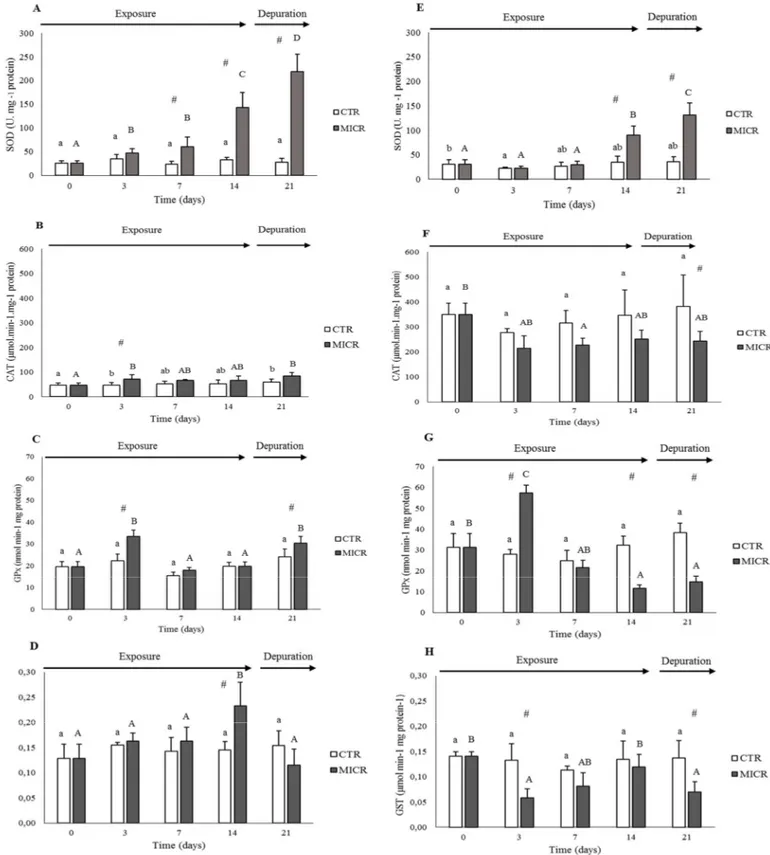
Enzymatic activity
410
The antioxidant enzymes (SOD, CAT, GPx) and GST activities in the gills and
411
digestive gland of S. plana are presented in Figure 5. Only CAT shows a tissue specific
412
response with higher activity in the digestive gland when compared to the gills (p <0.05).
413
In the gills, the exposure to PS microplastics induces a significant increase in SOD
414
activity after 7 days of exposure that continues in the depuration period (p<0.05) (Figure
415
5A), while for CAT activity there was a significant increase only after three days of
416
exposure (p<0.05)(Figure 5B). Similarly, in PS exposed clams, GPx activity increases in
417
clams exposed to PS microplastics after the 3rd day of exposure (p <0.05) and similarly
418
to SOD, GPx continues to increase at the end of the depuration period (p <0.05) (Figure
419
5C). Moreover, exposure to PS microplastics induces an enhancement of GST activity at
420
the end of the exposure period (p <0.05), but it decreases in the depuration period (p
421
<0.05) (Figure 5D).
14
In the digestive gland, the SOD activity, like in the gills, increases with time of
423
exposure, but this increase was only significant at the end of the exposure period (day 14,
424
p <0.05). Similarly to the gills, SOD activity in the digestive gland also increases at the
425
end of the depuration period (p <0.05) (Figure 5E). On the other hand, CAT activity in
426
PS contaminated clams decreased (p <0.05) with no differences in the depuration period
427
(p >0.05) (Figure 5F). GPx activity, however, showed a bell shape behaviour with a
428
significant increase after the 3rd day of exposure and a decrease in the remaining period
429
(Figure 5G). In clams exposed to PS microplastics, GST activity only significantly
430
decreased after the 3rd day of exposure (p <0.05). This decrease was similar at the end of
431
the depuration period (p <0.05) (Figure 5H).
432 433
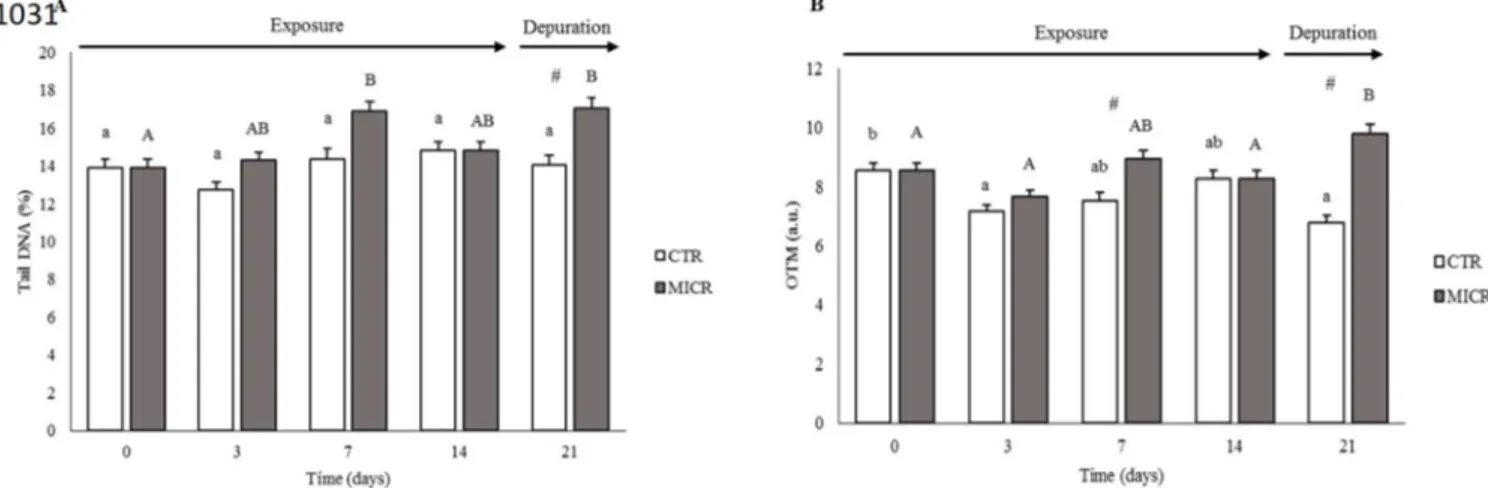
Comet assay
434
Genotoxic effects for both treatments (CTR and PS exposed clams), analysed by
435
the comet assay and expressed as % of tail DNA and Olive Tail Moment are in Figure
436
6A-B, respectively. No significant changes were observed for the % of tail and OTM
437
between controls and exposed clams except for day 7 where a significant increase
438
occurred for OTM in exposed clams (p <0.05). In the depuration period, significant
439
differences were detected between control and clams previously exposed to PS
440
microplastics (p <0.05) for both parameters.
441 442
AChE activity
443
The activity of AChE in the gills is in Figure 7. In PS exposed group the AChE
444
activity significantly decreased (p <0.05) on day 3 when compared to T0. AChE activity
445
was also significantly lower on day 3 and 14 of exposure and after the depuration period,
446
when compared to non-exposed clams (p <0.05).
447 448
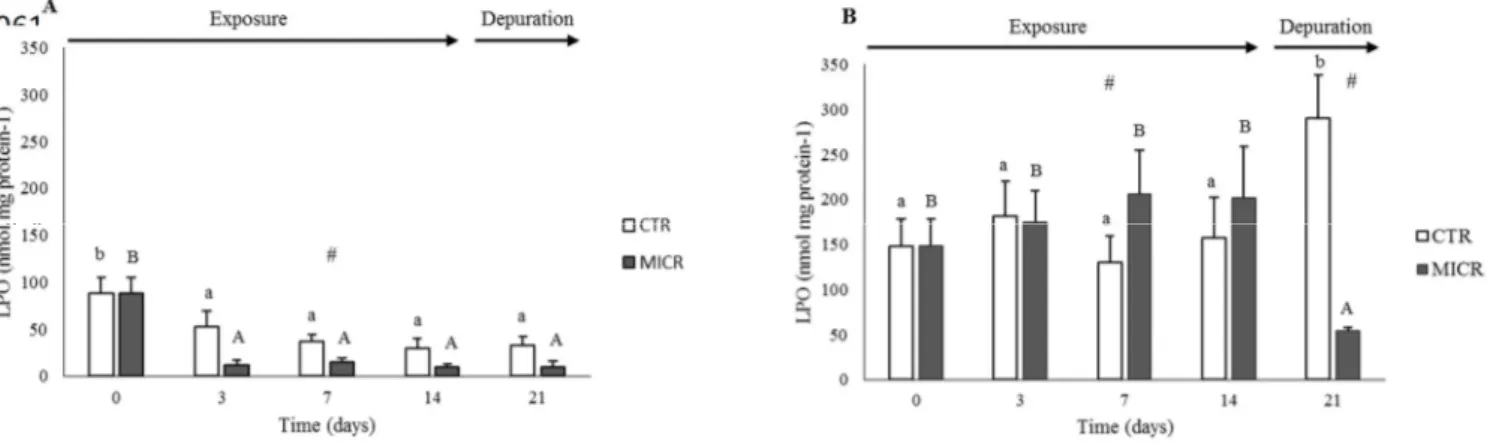
Oxidative damage
449
LPO levels were significantly higher in the digestive gland then in the gills ((p
450
<0.05; Figure 8A-B). In the gills of PS exposed clams, although LPO levels remained
451
unchanged through time, they significantly decreased compared to those at the beginning
452
of the experiment (day 0) and to the other sampling days (p <0.05) while in the digestive
453
gland, in PS exposed clams, LPO levels significantly increased after 7 days of exposure
15
compared to controls (p <0.05). In the elimination period, in the digestive gland of PS
455
exposed clams LPO levels significantly decreased when compared to controls (p <0.05).
456 457 458
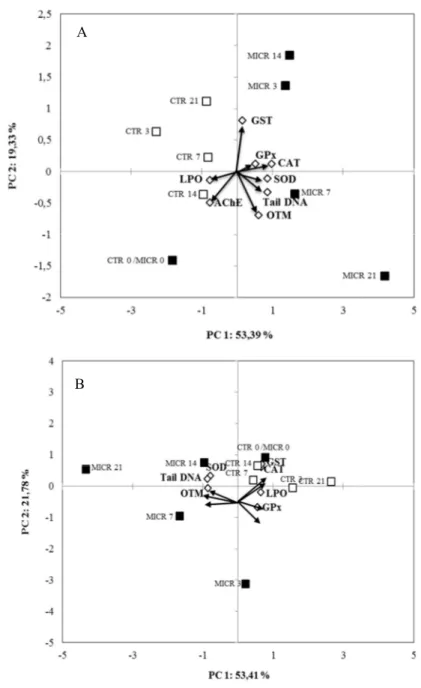
Principal Component Analysis
459
PCA was applied to all the data for the gills and digestive gland to explain the
460
effects of PS microplastics on biomarkers responses (Figure 9). Regarding the gills, the
461
two principal components represent 72.7 % of total variance, with PC1 representing 53.4
462
% and PC2 19.3 % (Figure 9 A). PCA indicates a clear separation between the initial time
463
of the experiment (T0) and the remaining days, between exposed clams and controls and
464
also a clear separation of the depuration period in exposed clams (T21) comparing to
465
others. SOD, CAT, GPx and the genotoxic parameters are in the positive part of PC1,
466
closely related with PS exposed clams, principally after 7 days of exposure (MICR 7).
467
LPO and AChE are negatively related to the other biomarkers in PC1 and are more
468
influenced by non-exposed clams. In PC2, SOD, LPO, AChE and genotoxicity are in the
469
negative part, with SOD and genotoxic parameters being more influenced by exposed
470
clams on day 7 and after depuration (MICR 21). CAT, GPx and GST are in the positive
471
part of PC2, with particularly GST being more influenced by exposed organisms at days
472
3 and 14.
473
In the digestive gland, the two principal components represent 75.2 % of total variance,
474
with PC1 representing 53.4 % and PC2 21.8 % (Figure 9 B). In this case, there is a clear
475
separation between unexposed and exposed clams, where all the non-exposed clams are
476
in the positive part of the PC1. SOD and the genotoxic parameters are in the negative part
477
of PC1 and more related to exposed clams at days 7 and 14 together with the MICR 21,
478
while CAT, GPx, GST and LPO are on the positive side and more related to non-exposed
479
clams. PC2 clearly isolates exposed clams at day 3 (MICR 3) from the rest, although
480
exposed clams from day 7 also fall in the negative part of PC2. Also in the negative part
481
of PC2 are LPO and GPx, with GST, CAT and SOD and Tail DNA in the positive side.
482 483
Discussion
484 485
The presence and mode of action of polystyrene microparticles in the gills and
486
digestive gland of the peppery furrow shell S. plana and the potential ecotoxicological
16
risk of this emerging contaminant was evaluated by characterizing the type of
488
microplastics used and identifying their presence using infrared spectroscopy in diffuse
489
reflectance mode, and by assessing their effects using a battery of biomarkers. These
490
biomarkers were chosen to evaluate the possible effects that come from the physical
491
damage caused by the microparticles, namely: oxidative stress and oxidative damage
492
(through enzymatic activity and LPO), which in turn can lead to genotoxicity and/or
493
neurotoxicity (analysed through the comet assay and the AChE activity).
494
One of the questions that arise from laboratory experiments is whether they are
495
able to really mimic the natural environment (Phuong et al., 2016) in terms of
496
environmental relevant exposure concentrations. Higher concentrations of microplastics
497
have been found in sediments, 3.3 particles g-1 (Rhine estuary; Leslie et al., 2013) or 62
498
particles g-1 (Wadden sea islands; Liebezeit & Dubaish, 2012). A major concern is the
499
lack of information on the environmental concentrations for plastic particles smaller than
500
50 µm, with only a few exceptions reported and where it was noted that the smaller
501
particles were much more abundant than the larger ones (Song et al., 2014). For these
502
reasons, it was considered that the concentration of 1 mg L-1 (4 particles ml-1) was a good
503
compromise between measured environmental concentrations taking into account, both
504
the water and sediment compartments, acknowledging also the lack of data on the
505
concentration for smaller sized particles and their potential to exist in the environment in
506
higher concentrations than those currently detected for larger particles.
507
The combination of multiple analytical techniques (OM, DLS, ELS) to
508
characterize PS microplastics using both natural seawater and ultrapure water (Milli-Q)
509
(Table 3 and Figure 1) provide an insight about the hazard and risk of these microparticles
510
in the aquatic environment. Size and density are important proxies for microplastics
511
bioavailability that can also be enhanced by biological factors (Wright et al., 2013b). The
512
PS microplastics used had a density of 1.09 g/cm3 and took 24 hours to sediment. Data
513
indicated that the particles start reaching the bottom after 2 hours of exposure and thus
514
are available to the organisms present therein. The PS microparticles used in this assay
515
are spherical in shape and of the same size (20 µm) and tend to form small aggregates in
516
seawater (Table 3). Similarly, the ingestion of PS spheres (100 nm) in suspension-feeders
517
bivalve molluscs increased when they were fed with microplastics aggregates generated
518
manually in the laboratory (Wright et al., 2013a). Therefore it is hypothesised that the
519
effects of PS microplastics might be caused by the formation of aggregates when
520
accumulated in clam tissues, although it could be different if the microparticles were
17
heterogeneous and not of the same shape and size (Frias, 2015). Most of the microplastics
522
found in the marine environment are secondary microplastics, resulting from the
523
degradation of larger pieces, and thus, with different sizes, shape and sharp edges, that
524
may contribute to injuries in the digestive tract (Browne et al., 2008; von Moos et al.,
525
2012).
526
S. plana is able to accumulate PS microplastics from seawater in the gills and
527
digestive gland (Figures 3 and 4). Bivalves are able to select particles before ingestion
528
but not after ingestion (Wright et al., 2013b). The presence of microplastics in the gills
529
was noted after 14 days of exposure, with a partial recovery during the depuration period.
530
This suggests that PS microplastics are trapped in this organ, the first in contact with the
531
polymer. The microparticles are also ingested through the inhalant siphon and
532
subsequently transported to the mouth and to the digestive gland for intracellular
533
digestion (Hughes, 1969). This was noted by the presence of PS microparticles in S. plana
534
digestive gland (Figures 4 C-D), where they are likely not digested, and some of them
535
were eliminated. The presence of small aggregates of microplastics in the haemolymph
536
(Figure 2) indicates that PS microplastics were transported into the circulatory system,
537
indicating a possible translocation, where they can be retained for several weeks and then
538
transported to several tissues where they can cause harm. But, the question is if the
539
translocation really occurred or was it a contamination by microplastic while sampling
540
haemolymph? Lambert et al. (2014) discuss whether the presence of microplastics in the
541
circulatory system is due to translocation or contamination due to sampling technique. PS
542
microplastics in M. edulis persisted in the circulatory system for 48 days (Browne et al.,
543
2008), giving an evidence of microplastic translocation. The accumulation, upon
544
ingestion, of 2 µm and 4-16 µm PS fluorescently labelled microplastics (0.51 µg L-1) in
545
the gut cavity and digestive tubules of Mytilus edulis was also observed by Browne et al.
546
(2008), after 12 hours of exposure. The same author identified PS microparticles in the
547
haemolymph and haemocytes of the same mussel species although no toxicity effects
548
were observed. Conversely, in mussels exposed for 48h to microplastics (1-80 µm) an
549
increase in haemocytes and a decrease in lysosomal membrane stability was observed in
550
the same mussel species, indicating the presence of an inflammatory process (Bowmer &
551
Kershaw, 2010). Also, von Moos et al. (2012) shows that HDPE particles (0-80 µm) were
552
transported to the digestive gland where they accumulated in the lysosomal system of M.
553
edulis. However, in oysters C. gigas exposed to fluorescent microplastic beads (of 2 and
554
6 µm), microplastics were only present in the digestive gland (Sussarellu et al., 2016),
18
existing no evidence of transfer from the digestive track to the circulatory system.
556
Although there is some controversy about the translocation of microplastic in the
557
haemolymph of bivalve molluscs, the data reported is only on filter-feeders (Browne et
558
al., 2008; von Moos et al., 2012). It might occur that in the case of suspension-feeders
559
like S. plana, microplastics tend to translocate in the circulatory system but this needs to
560
be confirmed in future studies. In S. plana exposed to gold nanoparticles (Au NPs),
561
nanoparticles were accumulated almost exclusively in the digestive gland, although they
562
were also present in gills. These results highlight the accumulation of both nano and
563
microparticles essentially in the digestive tract of this clam species. The accumulation of
564
microplastics in this tissue might impair the digestive system with a consequent decrease
565
of feeding behaviour. There is very limited information regarding the capacity of aquatic
566
organisms to eliminate microplastics. The present results indicated that after a week of
567
depuration, microplastics were still present in both tissues (Figure 4). Future studies that
568
quantify the amount of microplastics accumulated in clam tissues and assess whether
569
microplastics are eliminated in the pseudo-faeces of S. plana are necessary, in order to
570
increase the knowledge about the accumulation, metabolism and elimination of PS
571
microplastics in this species.
572
A battery of biomarkers was used to assess the biological effects and toxicity of
573
PS microplastics in the gills and digestive gland of S. plana. Results indicate an oxidative
574
stress response in gills and digestive gland cells that are tissue and exposure time
575
dependent (Figures 5A-E). SOD is the first defence line to protect these tissues against
576
oxidative stress probably caused by injuries of PS microplastics in the tissues. SOD
577
activity enhanced in both tissues in the presence of PS microplastics reflects the need to
578
balance the excess of superoxide radical (O2●-) into the less damaging hydrogen peroxide
579
(H2O2) and thus, contribute to prevent cellular oxidative damage (Jo et al., 2008). The
580
same response occurred in marine mussels Mytilus spp. exposed to 32 µg L-1 of PS
581
microplastics (2 and 6 µm) after 14 days (Paul-Pont et al., 2016). CAT is involved in the
582
removal of H2O2 - the main precursor of hydroxyl radical in aquatic organisms - and acts
583
as a defence mechanism toward the exogenous source of H2O2 (Regoli & Giuliani, 2014).
584
However, CAT activity was only enhanced in the gills after three days of exposure and
585
inhibited in the digestive gland after 7 days of exposure (Figure 5B, F) and is apparently
586
not the antioxidant defence mechanism used by S. plana to respond to PS microplastics
587
toxicity. Avio et al. (2015) also noted an inhibition of CAT activity in the digestive tissue
588
of the marine mussel M. galloprovincialis exposed to microplastics. CAT and GPx are
19
both involved in the removal of H2O2. Regarding GPx, an increase in activity after 3 days
590
of exposure, suggests a defence mechanism, but the posterior reduction in GPx activity,
591
particularly in the digestive gland (Figure 5G), may be an indication of an inhibition
592
triggered by excess of ROS and the incapacity to deal with the negative effect of this
593
stressor. Glutathione peroxidases are known to be particularly sensitive in revealing the
594
early onset of a pro-oxidant challenge, even at low levels of environmental disturbance
595
(Regoli & Giuliani, 2014). In S. plana exposed to mercury, a decrease in GPx activity in
596
the whole soft tissues occurred due to the higher toxicity of mercury (Ahmad et al., 2011).
597
Such ROS perturbations were also observed in mussels (M. galloprovincialis) exposed to
598
PS and PE microplastics alone or in combination with pyrene (Avio et al., 2015). The
599
pro-oxidant challenge induced by microplastics on mussels was supported by the lack of
600
significant variation of malondialdehyde, lipofuscin and neutral lipids in digestive tissues.
601
The ROS production led to an inhibition of CAT and Se-GPx in M. galloprovincialis
602
exposed to PS and PE microplastics (Avio et al., 2015). Browne et al. (2013) showed that
603
PVC microparticles induced an oxyradical production in Arenicola marina, and
604
lugworms that ingested sediments with PVC reduce the capacity by more than 30% to
605
deal with oxidative stress. PS microbeads also led to an increase in ROS production in
606
haemocytes and to the enhancement of anti-oxidant and glutathione-related enzymes in
607
mussel tissues (Paul-Pont et al., 2016).
608
GST is usually associated with phase II biotransformation, involved in the
609
metabolism of lipophilic organic compounds by catalysing the conjugation of the reduced
610
form of glutathione (GSH) to xenobiotic substrates, and has also a protective role against
611
oxidative stress (Lesser, 2006). S. plana may be using this detoxification mechanism to
612
deal with the exposure to PS microplastics, by catalysing the conjugation of the reduced
613
form of glutathione (GSH) to xenobiotic substrates, playing a significant role in the
614
detoxification of the reactive products from lipid peroxidation (Lesser, 2006). Gills
615
showed an increase in GST activity after 14 days of exposure (Figure 5D). Similar results
616
were found in gills of M. galloprovincialis after exposure to organic persistent pollutants,
617
such as pp’DDE (2,2-bis-(p-chlorophenyl)-1,1-dichlorethylene) (Hoarau et al., 2002;
618
Khessiba et al., 2001). In the digestive gland, GST activity decreased (Figure 5H), as was
619
previously observed in mussels after PS-exposure for 14 days (Avio et al., 2015).
620
In the depuration period, SOD activity continued to increase in both organs
621
(Figure 5A, E). The increase in enzymatic activity at the end of the depuration period can
622
be due to an impairment of the filtration activity or to the presence of remaining
20
microparticles in the gills and digestive gland, that still induce an enzymatic response
624
(Paul-Pont et al., 2016), suggesting the inability of S. plana to eliminate microplastics,
625
by the mechanical damage caused by the release of the particles from the tissues, or even
626
the lack of capacity to recover after this elimination period. Nevertheless, 7 days of
627
depuration might not be enough for S. plana to completely recover from the exposure of
628
PS microplastics as suggested by the present results (Figure 5). In conclusion, it can be
629
hypothesized that ROS are produced as a result of PS microplastics uptake, and possibly
630
cause injury of gills and/or internalization in the digestive gland cells, since it is known
631
that these microparticles are able to cross cell membranes, leading to cell damage
632
(Browne et al., 2008; Rosenkranz et al., 2009; Van Cauwenberghe et al., 2015).
633
The levels of oxidative damage to lipids decreased in the gills in the PS exposed
634
clams (Figure 8A). This could be linked to antioxidant defences, which consequently limit
635
the attack of ROS to membrane lipids. In the digestive gland, there is a tendency of LPO
636
levels to increase (from day 0 to day 7), but no significant differences were noted (Figure
637
8B). The enzymatic activities measured in this tissue were always lower on day 7, with a
638
recovery after one week of depuration, with the exception of GPx. A significant
639
enhancement of ROS in digestive gland haemocytes of Mytilus spp. after 7 days of
micro-640
PS exposure (mixture of 2 and 6 µm) was previously reported but no antioxidant markers
641
were activated and no sign of lipid peroxidation was observed (Paul-Pont et al., 2016).
642
Ahmad et al. (2011) showed an increase in LPO levels in both gills and digestive gland
643
of S. plana exposed to mercury. When enzymatic defences do not actively respond to the
644
presence of PS microplastics this may result in an inflammation response and a lysosomal
645
membrane destabilization, as a cellular response observed in mussels (M. edulis) exposed
646
to 2.5 g L -1 of a high-density polyethylene (HDPE) particles (> 0−80 µm) for 96 hours
647
(von Moos et al., 2012). Future exposure experiments with S. plana should look at this
648
aspect.
649
The Comet assay is a sensitive, rapid and economic technique for the detection of
650
DNA strand breaks and can be regarded as a good method to assess genotoxicity in
651
aquatic species (Jha, 2008). Moreover, Petridis et al. (2009) demonstrated that the blood
652
cells of S. plana are suitable for screening genotoxic effects, using this method. DNA
653
strand breaks induced in PS exposed haemocytes of S. plana (Figure 6 A,B) are similar
654
to mussels treated with PE microplastics where a significant enhancement of DNA strand
655
breaks was detected (Avio et al., 2015). Regarding the elimination period, there was an
656
increase of both Tail DNA (%) and OTM, in PS exposed organisms. The mechanism of
21
genotoxicity of PS microplastics remains unknown, but it is suggested that it can be
658
related to ROS production and oxidative stress, not handled by the antioxidant defence
659
mechanism, as occurs with nanoparticles (Rocha et al., 2014). Hence, causing damage by
660
covalently binding to DNA (Hossain & Huq, 2002) or by inhibiting DNA synthesis
661
(Hidalgo & Dominguez, 1998) and thus preventing cell division and DNA replication
662
(Singh et al., 1988).
663
PS microplastics inhibit the AChE activity in clam gills at different times of
664
exposure with this effect remaining even after 7 days of depuration (Figure 7). The ability
665
of microplastics to inhibit AChE activity was previously described in juveniles of the
666
common goby Pomatoschistus microps exposed to 18.4 and 184 µg L−1 of PE
667
microspheres (1-5 µm) for 96 hours, alone or in combination with pyrene (Oliveira et al.,
668
2013) or in combination with chromium (Luís et al., 2015).
669
PCA for the gills and digestive gland show different responses that reflect the
670
distinct physiological and metabolic functions of the two tissues (Figure 9A-B). Exposure
671
to PS microplastics in the gills was positively related to an increase in the activity of
672
oxidative stress enzymes and DNA damage, although negatively related to the oxidative
673
damage and to the activity of AChE (inhibition), meaning that there is an inflammation
674
process and a neurotoxic effect and validating the hypothesis that gills had a more
675
effective response against oxidative stress than digestive gland (Figure 9A). In the case
676
of the digestive gland, SOD is the biomarker that best relates to exposure to PS
677
microplastics. As gills are the main tissue involved in filtration, they are in direct contact
678
with the PS microplastics, being more susceptible to oxidative stress than the digestive
679
gland (Figure 9B). Despite existing data about the increasing occurrence of PS
680
microplastics in the marine environment (Andrady, 2011; Cole et al., 2011; Wright et al.,
681
2013b), there is still much to understand about their biological effects. Further studies are
682
needed to investigate the capacity to recover from the potential effects of PS and other
683
microplastics in marine organisms beyond 7 days of depuration. The evaluation of the
684
biological effects of microplastics also requires a molecular-level to understand how they
685
interact with cells in a physiological environment, but up to date the functional
686
implications at cellular level still remains to be elucidated.
687 688 689 Conclusions 690 691
22
PS microplastics were taken up by clams, mainly by the gills where they tend to
692
accumulate, but they were also present in the digestive gland where they seemed to be
693
stored. Tissue-specific sensibility is involved in the clams response to PS exposure by
694
inducing oxidative stress, with the gills providing a more effective response than digestive
695
gland. The genotoxicity of PS microplastics increased with time. Furthermore, the
696
detoxification process of PS microplastics in clams tissues was inefficient for the 7 days
697
duration tested, indicating their potential trophic transfer.
698 699 700
Acknowledgements
701
This work was developed under the project EPHEMARE, JPIOCEANS programme of
702
the EU, funded by the Portuguese Foundation for Science and Technology
703
(JPIOCEANS/0005/2015). This work was also supported by the Portuguese Science
704
Foundation (FCT) through the grant UID/MAR/00350/2013 attributed to CIMA of the
705
University of Algarve. The authors would like to thank V. Sousa and M. R. Teixeira for
706
their help in the characterization of PS microplastics and also T.L. Rocha and C. Cardoso
707
for their helpful discussions and laboratory contributions.
708 709
References
710 711
Ahmad, I., Mohmood, I., Mieiro, C.L., Coelho, J.P., Pacheco, M., Santos, M.A., Duarte, A.C., & 712
Pereira, E. (2011). Lipid peroxidation vs. antioxidant modulation in the bivalve 713
Scrobicularia plana in response to environmental mercury—organ specificities and age 714
effect. Aquatic Toxicology, 103(3), 150-158. 715
Almeida, C., Pereira, C., Gomes, T., Bebianno, M.J., & Cravo, A. (2011). DNA damage as a 716
biomarker of genotoxic contamination in Mytilus galloprovincialis from the south coast 717
of Portugal. Journal of Environmental Monitoring, 13(9), 2559-2567. 718
Andrady, A.L. (2011). Microplastics in the marine environment. Marine Pollution Bulletin, 62(8), 719
1596-1605. 720
Avio, C.G., Gorbi, S., Milan, M., Benedetti, M., Fattorini, D., d'Errico, G., Pauletto, M., 721
Bargelloni, L., & Regoli, F. (2015). Pollutants bioavailability and toxicological risk from 722
microplastics to marine mussels. Environmental Pollution, 198, 211-222. 723
Bowmer, T., & Kershaw, P. (2010). Proceedings of the GESAMP International Workshop on 724
microplastic particles as a vector in transporting persistent, bioaccumulating and toxic 725
substances in the oceans. 28–30th June 2010, UNESCO-IOC, Paris. GESAMP Reports 726
and Studies, 82. 727
Brillant, M., & MacDonald, B. (2002). Postingestive selection in the sea scallop (Placopecten 728
magellanicus) on the basis of chemical properties of particles. Marine Biology, 141(3), 729
457-465. 730
23 Browne, M.A., Dissanayake, A., Galloway, T.S., Lowe, D.M., & Thompson, R.C. (2008). 731
Ingested microscopic plastic translocates to the circulatory system of the mussel, Mytilus 732
edulis (L.). Environmental Science & Technology, 42(13), 5026-5031. 733
Browne, M.A., Niven, S.J., Galloway, T.S., Rowland, S.J., & Thompson, R.C. (2013). 734
Microplastic moves pollutants and additives to worms, reducing functions linked to 735
health and biodiversity. Current Biology, 23(23), 2388-2392. 736
Canesi, L., Ciacci, C., Bergami, E., Monopoli, M., Dawson, K., Papa, S., Canonico, B., & Corsi, 737
I. (2015). Evidence for immunomodulation and apoptotic processes induced by cationic 738
polystyrene nanoparticles in the hemocytes of the marine bivalve Mytilus. Marine 739
Environmental Research, 111, 34-40. 740
Carpenter, E.J., & Smith, K. (1972). Plastics on the Sargasso Sea surface. Science, 175(4027), 741
1240-1241. 742
Cawthorn, M. (1989). Impacts of marine debris on wildlife in New Zealand coastal waters. 743
Proceedings of Marine Debris in New Zealand’s Coastal Waters Workshop, 9, 5-6. 744
Claessens, M., Van Cauwenberghe, L., Vandegehuchte, M.B., & Janssen, C.R. (2013). New 745
techniques for the detection of microplastics in sediments and field collected organisms. 746
Marine Pollution Bulletin, 70(1), 227-233. 747
Codina-García, M., Militão, T., Moreno, J., & González-Solís, J. (2013). Plastic debris in 748
Mediterranean seabirds. Marine Pollution Bulletin, 77(1), 220-226. 749
Cole, M., Lindeque, P., Halsband, C., & Galloway, T.S. (2011). Microplastics as contaminants in 750
the marine environment: a review. Marine pollution bulletin, 62(12), 2588-2597. 751
Colovic, M.B., Krstic, D.Z., Lazarevic-Pasti, T.D., Bondzic, A.M., & Vasic, V.M. (2013). 752
Acetylcholinesterase inhibitors: pharmacology and toxicology. Current 753
Neuropharmacology, 11(3), 315. 754
De Witte, B., Devriese, L., Bekaert, K., Hoffman, S., Vandermeersch, G., Cooreman, K., & 755
Robbens, J. (2014). Quality assessment of the blue mussel (Mytilus edulis): comparison 756
between commercial and wild types. Marine Pollution Bulletin, 85(1), 146-155. 757
Derraik, J.G. (2002). The pollution of the marine environment by plastic debris: a review. Marine 758
Pollution Bulletin, 44(9), 842-852. 759
Devriese, L.I., van der Meulen, M.D., Maes, T., Bekaert, K., Paul-Pont, I., Frère, L., Robbens, J., 760
& Vethaak, A.D. (2015). Microplastic contamination in brown shrimp (Crangon 761
crangon, Linnaeus 1758) from coastal waters of the Southern North Sea and Channel 762
area. Marine Pollution Bulletin, 98(1), 179-187. 763
Eerkes-Medrano, D., Thompson, R.C., & Aldridge, D.C. (2015). Microplastics in freshwater 764
systems: a review of the emerging threats, identification of knowledge gaps and 765
prioritisation of research needs. Water Research, 75, 63-82. 766
Ellman, G.L., Courtney, K.D., Andres, V., & Featherstone, R.M. (1961). A new and rapid 767
colorimetric determination of acetylcholinesterase activity. Biochemical Pharmacology, 768
7(2), 88-95. 769
Erdelmeier, I., Gérard-Monnier, D., Yadan, J.-C., & Chaudiere, J. (1998). Reactions of N-methyl-770
2-phenylindole with malondialdehyde and 4-hydroxyalkenals. Mechanistic aspects of the 771
colorimetric assay of lipid peroxidation. Chemical Research in Toxicology, 11(10), 1184-772
1194. 773
Farrell, P., & Nelson, K. (2013). Trophic level transfer of microplastic: Mytilus edulis (L.) to 774
Carcinus maenas (L.). Environmental Pollution, 177, 1-3. 775
Fendall, L.S., & Sewell, M.A. (2009). Contributing to marine pollution by washing your face: 776
Microplastics in facial cleansers. Marine Pollution Bulletin, 58(8), 1225-1228. 777
Frias, J.P.G.L.d. (2015). Effects of the presence of microplastic particles in portuguese coastal 778
waters and marine mussels. (Doctor of Phylosophy in Environmental Sciences), 779
Universidade Nova de Lisboa, Monte de Caparica. 780
Gall, S., & Thompson, R. (2015). The impact of debris on marine life. Marine Pollution Bulletin, 781
92(1), 170-179. 782
Goldstein, M.C., & Goodwin, D.S. (2013). Gooseneck barnacles (Lepas spp.) ingest microplastic 783
debris in the North Pacific Subtropical Gyre. PeerJ, 1, e184 784
https://doi.org/110.7717/peerj.7184. 785