https://doi.org/10.1177/2059799117703120
Creative Commons Non Commercial CC BY-NC: This article is distributed under the terms of the Creative Commons
Attribution-NonCommercial 4.0 License (http://www.creativecommons.org/licenses/by-nc/4.0/) which permits non-commercial use, reproduction and distribution of the work without further permission provided the original work is attributed as specified on the SAGE and Open Access pages (https://us.sagepub.com/en-us/nam/open-access-at-sage).
Methodological Innovations 2017, Vol. 10(2) 1–12 © The Author(s) 2017 Reprints and permissions: sagepub.co.uk/journalsPermissions.nav
DOI: 10.1177/2059799117703120 journals.sagepub.com/home/mio
Introduction
The primary objective of a Population and Housing Census is to collect data that allow the description, in time and in space, of the structure and characteristics of the entire coun-try’s population and housing. The principal task of any cen-sus operation is to count each and every person without any omissions (Waite, 2007); however, this may be compromised by a number of factors, such as the performance of the human resources involved (e.g. enumerators), the citizens’ level of cooperation with the census and even the specific character-istics of the areas and the populations to be enumerated. The development and implementation of a quality assurance (QA) system to assist the census operation is to a great extent a guarantee that enumeration will follow established proce-dures, that the operation will be correctly monitored so as to ensure predefined rules are met and the data collected reach the predefined quality standards. In short, the aim of a QA system is to anticipate problems in order to avoid or mini-mize errors in the census operation (Bushery et al., 2003; Wroth-Smith et al., 2011).
The Portuguese Population and Housing Census takes place every 10 years, and the last one was in March/April 2011 (the Portuguese Population and Housing Census is referred to herein as Census 2011). Until 2011, the QA
system of Portuguese census operations was designed on a national scale, that is, the processes and sub-processes, indi-cators and standards were defined for a national operation. This meant that the QA activities assisting the monitoring of the operation were the same in all regions. Despite being a small country, Portugal is geographically and demographi-cally very diverse and has heavily urbanized and rural areas, high population density as well as almost abandoned and deserted villages, some regions with predominantly old peo-ple but others with a younger population. This diversity affects the implementation of a census operation because the problems, difficulties and risks of failure vary in line with the particularities of the population and where it is being implemented. Departing from this assumption, the QA sys-tem was redesigned for the Census 2011 in order to custom-ize it to the specificities of the local areas (Statistics Portugal,
Methodology to design a Map of Alert
for population and housing censuses:
The Portuguese case
Elizabeth Reis, Paula Vicente, Álvaro Rosa and Catarina Marques
Abstract
The Portuguese Population and Housing Census is carried out every 10 years by Statistics Portugal. In the Census 2011, a new tool was developed to assist the Quality Assurance system in order to make the monitoring of fieldwork operations more efficient and thus diminish the uncertainties that could cause coverage error in the results. This tool, named as Map of Alert, presents a three-level typology of alert that ensures advance knowledge of the potential risk of each freguesia’s failure to meet the quality standards defined for the enumeration process. This article describes the methodological process that guided the development of the Map of Alert and presents the Map itself.
Keywords
Census, principal component analysis, K-means clustering, finite mixture model
Business Research Unit, Instituto Universitário de Lisboa (ISCTE-IUL), Lisboa, Portugal
Corresponding author:
Paula Vicente, Business Research Unit, Instituto Universitário de Lisboa (ISCTE-IUL), Av. Forças Armadas, 1649-026 Lisboa, Portugal. Email: [email protected]
2007). This was expected to improve efficiency as resources could be targeted to areas with a known higher risk of non-accomplishment.
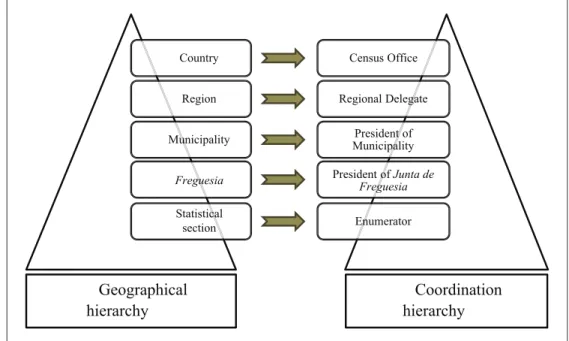
In all, the Census 2011 involved more than 50,000 col-laborators – including coordinating members, enumerators, trainers, logistics partners, training companies, computer hardware and software companies – and a complex system of questionnaire distribution, collection and processing. Portugal is administratively organized in 303 municipalities encompassing 4260 freguesias (freguesia is Portugal’s small-est administrative area). This organization serves as the base for the implementation of the census operations. Specifically, enumerators are the bottom of the organizational model – they collect data in statistical sections (which corresponds to a geographical area within freguesias averaging about 300 dwellings) – and report to the President of Junta de Freguesia (PJF) (Junta de Freguesia is the governing body of each
freguesia). PJF is the lowest level of the operation’s
coordi-nation hierarchy, followed by municipal level coordicoordi-nation, then the regional coordination, and with the national level coordination at the top (Figure 1). The Census Office of Statistics Portugal is responsible for the strategic and national coordination of the entire operation, a regional delegate is given the regional coordination, the President of each Municipality is in charge of the municipal coordination and the PJFs coordinate the freguesias.
The fieldwork stage – which encompasses the recruitment and training/instruction of enumerators, the door-to-door dis-tribution of questionnaires, the collection of the completed questionnaires and the collection of data on all buildings (to be done by enumerators) – is planned and implemented at
freguesia level. This means that the PJFs are responsible for
the planning, organization and execution of all activities
necessary to complete these tasks. The fieldwork stage was identified by Statistics Portugal as the most sensitive part of Census 2011 quality because the process of delivering and collecting the questionnaires involves factors that may cause coverage problems, that is, failing to enumerate some popu-lation units or duplicating the enumeration of others. Difficulty in making contact with households (due to increased mobility of populations, second homes or houses with access control security systems) may result in the omis-sion of some units from the enumeration. Additionally, some specific characteristics of the population, for example, peo-ple with illegal residency, groups or communities that feel disconnected from society, areas with changing and complex household structures and living arrangements (White, 2009), also hamper full coverage. Moreover, the growing reluctance to cooperate with official statistical operations and the bur-den of completing questionnaires often makes citizens react in a hostile manner towards enumerators so it becomes dif-ficult to get their cooperation. Finally, inappropriate handling of procedures and the non-accomplishment of predefined standards either by the enumerators and/or by coordination and supervisory staff undoubtedly lead to errors in the final data set.
The international recommendation (United Nation, 2008: 56) to detect and correct errors during the running of census operations called for the definition of an efficient QA system for the Census 2011 focussing predominantly on the field-work stage of operations. The fieldfield-work process was in fact the central and decisive task of the Census 2011 given its importance to the quality of the Census data. The fieldwork supervision focussed on monitoring and evaluating the implementation of procedures carried out by enumerators in order to avoid errors or detect them in a timely manner.
The Map of Alert was the tool developed to identify the diversity of risk of non-fulfilment of quality standards when implementing the Census across the Portuguese territory and to assist local monitoring of fieldwork operations. The Map of Alert codes freguesias in a three-level typology of risk: low risk, medium risk and high risk. This allowed resources to be targeted to freguesias with a known high risk of non-accomplishment. While low or medium risk freguesias might be treated with the standard QA procedures, specific proce-dures had to be designed and implemented for high-risk
freguesias to suit their local specificities.
This article describes the methodological process that led to the three-level typology of risk of failure. The process involved collecting specific data on the risk of failure of the Census operations and the development of a classification methodology combining finite mixture modelling and non-hierarchical clustering. We present the data in the next sec-tion, before describing the data analysis methodology that led to the design of the Map in section ‘Final considerations’. The Map itself is also presented. The final section discusses the contribution of the Map of Alert to the Census quality.
Data
Before a typology of risk could be built, it was necessary to identify issues that might hinder the exhaustive and accurate count of individuals and dwellings. This entailed understand-ing the local specificities of the freguesias in terms of char-acteristics of the population and of dwellings, and the human resources involved, namely, enumerators and PJF (the local coordinators of the operations). The sources which would be used to obtain this information were identified in the second stage: (1) The Perception of Risk Survey and (2) Census data from the previous census operation in 2001.
The perception of risk survey
A survey of Juntas de freguesia was conducted on the assumption that local authorities are the richest source of information about the characteristics of the population, hous-ing and areas that might cause coverage difficulties for the census. The PJFs were the chosen respondents as they are in close contact with the populations and have in-depth knowl-edge of the problems in the areas they govern.
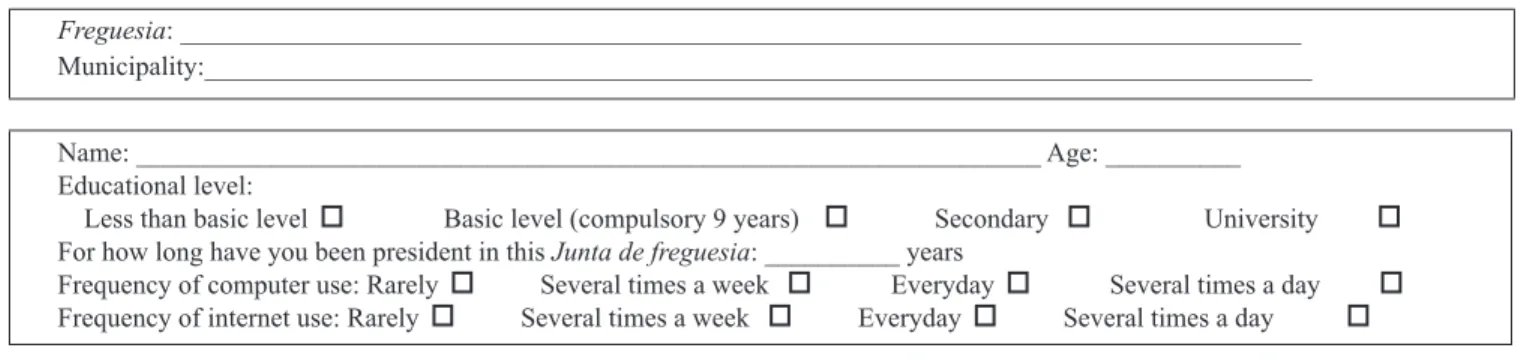
The questionnaire consisted of two blocks of questions.1
The first block addressed the respondent’s age, education, time as PJF, frequency of computer and Internet use, and the identification of the freguesia and municipality. The second block comprised questions on features of the freguesias that could affect the implementation of the census. This block had four sections. The first contained a set of six items on characteristics of the freguesia’s population. Respondents rated their answers on each of the items using a 5-point scale ranging from ‘few’ to ‘many’. The second section contained a set of six items on the characteristics of the buildings and
areas in the freguesia. Again, each of the items was to be answered using a 5-point scale ranging from ‘few’ to ‘many’. The next section contained two items about the recruitment of enumerators to be answered using a 5-point scale ranging from ‘hard’ to ‘easy’. The questionnaire ends with one item on the overall perception about the implementation of the Census 2011 in the freguesia.
The Perception of Risk survey was conducted during the Pilot Study stage of the Census operation (in 2010). The questionnaire was sent by mail, together with a postage-paid return envelope and a cover letter stating the purpose of the survey and highlighting the importance of cooperating. The initial mailing was sent to all the 4260 PJFs, and 10 weeks after the initial mailing, a follow-up was sent to all PJFs who did not respond, containing a cover letter, a second copy of the questionnaire and a postage-paid return envelope. Of the 4260 freguesias, 378 did not respond, corresponding to a nonresponse rate of 8.9%. Nine of the responding freguesias could not be identified because the question on freguesia identification was not answered.
Census 2001 data
Data from previous Census, held in 2001, were used to describe the freguesias based on official information. Although not updated with some variables, this information provided an external data set for comparison with the results obtained from The Perception of Risk Survey. The data obtained from Census 2001 concerned population and dwell-ings, detailed at the freguesia level, namely, population den-sity, percentage of young and old people, percentage of retired people, percentage of literate population, percentage of foreigners, average number of classical households per building, percentage of vacant household lodgings, percent-age of seasonal household lodgings and percentpercent-age of new dwellings.
Methodology to design the Map of Alert
The construction of the Map of Alert involved four main stages: (1) data preparation, (2) definition of freguesia’s clus-ters according to perceptions of risk of failure, (3) descrip-tion of the clusters and (4) definidescrip-tion of a three-level typology of risk. The various stages are described in more detail below.Data preparation
Principal component analysis (PCA) was applied to reduce data dimensionality and standardize the measurement scales of the original variables (Jackson, 1991; Kline, 1994) in the ques-tionnaire of the Perception of Risk survey. Two PCAs were conducted: one using the five questions/variables about the characteristics of the PJF (age, educational level, time as PJF, frequency of computer use and frequency of Internet use); the other PCA was made using the Likert-type questions/variables
about freguesias’ characteristics and recruitment of enumera-tors (Sections 1–3 of the questionnaire).
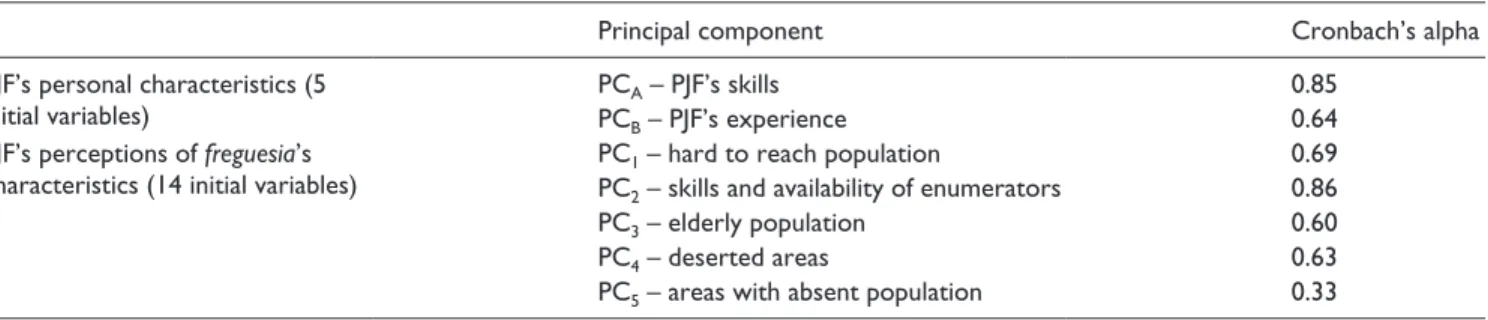
Table 1 presents the main outcomes of the analyses. In the first analysis, two principal components (PC) were retained to describe the five initial variables regarding PJF personal characteristics. Data quality indicators reveal a reasonable level of adequacy (KMO = 0.685, Bartlett’s test of sphericity
p-value = 0.000, and communalities ranging from 0.54 to
0.90). These two components accounted for 77.2% of the ini-tial variance and were named PCA, PJF’s skills, and PCB,
PJF’s experience. Cronbach’s alphas were reasonably good (0.85 and 0.64, respectively for PCA and PCB) (Carmines and
Zeller, 1979).
The second analysis involved the 14 variables on the PJF’s perceptions of the freguesia’s characteristics and recruitment of enumerators; five PC were extracted, account-ing for 61.3% of the initial variance. Data quality indicators indicate a reasonable level of adequacy (KMO = 0.696, Bartlett’s test of sphericity p-value = 0.000, and communali-ties ranging from 0.44 to 0.87). The five components were named PC1, hard-to-reach population; PC2, skills and
avail-ability of enumerators; PC3, elderly population; PC4, deserted
areas; and PC5, areas with absent population (recent
con-struction or vacant houses). The first four PCs have good values of internal consistency (Cronbach’s alpha ranging from 0.60 to 0.86) (Carmines and Zeller, 1979). Only PC5
has a Cronbach’s alpha below the acceptable level; neverthe-less, it was decided to maintain it in the PCA solution because ‘areas with absent population’ is a factor with potential impact on census quality.
Definition of freguesia’s clusters according to
perceptions of risk of failure
The second stage in the process towards the design of a Map of Alert involved classifying each freguesia into a group according to the risk of failure to make an exhaustive and accurate count of individuals and dwellings in the Census operation. A Cluster Analysis was performed for this pur-pose. The basic assumption of a cluster analysis is that the underlying population is partitioned into K homogeneous subsets – the clusters; however, the various clustering meth-ods assign cases to clusters in different ways.
Hierarchical clustering methods begin with a measure of distance (or similarity) to know how far apart (or how close) each pair of cases is to each other; once an observation is assigned to a cluster, it cannot be reassigned to another clus-ter. These methods do not require prior knowledge of the number of clusters to be formed but are difficult to apply and their results very hard to explore from a dendrogram in large data sets. Non-hierarchical clustering methods require previ-ous knowledge about the number of clusters that will be formed, and the initial cluster centres (or initial partition) have to be identified before the technique can proceed. The non-hierarchical clustering algorithms are generally very sensitive to the initial cluster centres and, since different starting partitions can be used, the final solution could result in local optimization of the objective function. For example, the non-hierarchical K-means algorithm performs better when results from other methods, such as hierarchical clus-tering, are used to set the initial partition instead of allowing a random starting partition (Sharma, 1996).
Finite mixture analysis (FMA) is a model-based approach which assumes that a mixture of underlying probability dis-tribution generates the data. If the maximum likelihood method is used for parameter estimation, the allocation of cases to clusters involves the maximization of the log-likeli-hood function. This is similar to K-means clustering in which the allocation should be optimal according to the minimiza-tion of the within-cluster variaminimiza-tion; however, FMA performs better than K-means clustering since it allows cases to be classified into clusters using posterior membership probabil-ities estimated by the Maximum Likelihood method (Magidson and Vermunt, 2002). Moreover, K-means pro-vides no assistance with deciding the number of clusters to be formed while FMA is assisted in the model selection by the information criterion measures.
Given the large size of our data set – N = 3882 freguesias – the FMA could result in a large number of clusters. Therefore, the FMA was combined with the K-means clus-tering to take advantage of the best characteristics of each method. FMA allowed the number of clusters to be obtained and the identification of the initial partition. Consequently, the cluster analysis for the design of the Map of Alert involved two steps: (1) identification of the number of clus-ters and the initial partition for the K-means clustering using
Table 1. Principal component analysis of PJF’s personal characteristics and PJF’s perceptions of freguesia’s characteristics.
Principal component Cronbach’s alpha
PJF’s personal characteristics (5
initial variables) PCPCAB – PJF’s experience – PJF’s skills 0.850.64
PJF’s perceptions of freguesia’s
characteristics (14 initial variables) PCPC12 – hard to reach population – skills and availability of enumerators 0.690.86
PC3 – elderly population 0.60
PC4 – deserted areas 0.63
PC5 – areas with absent population 0.33
finite mixture models and (2) classification of the freguesias into clusters using K-means clustering. The seven PCs on the PJFs’ personal characteristics, their perceptions of the
fregue-sias’ characteristics and recruitment of enumerators were
used as classification variables.
Under finite mixture model analysis, the choice of the optimal partition is based on model performance indicators such as the Akaike’s Information Criterion (AIC) (Akaike, 1973), the Bayesian Information Criterion (BIC) (Schwarz, 1978) and the Corrected AIC with a penalty factor of 3 (AIC3). AIC3 outperforms other model selection criteria for finite mixture models (Dias, 2006). Maximum likelihood was used to estimate several models with a different number of clusters. Latent GOLD software (Vermunt and Magidson, 2000) was used. Table 2 presents the value of the perfor-mance indicators for each cluster solution. The lower the value, the better the model.
As the number of clusters increased, the values of perfor-mance indicators decreased; although this made it difficult to decide on which number of clusters to select as the ‘best’ solution, the model with seven clusters was chosen. Therefore, the initial solution to perform the K-means clus-tering analysis comes from the 7-cluster model of finite mix-ture analysis.
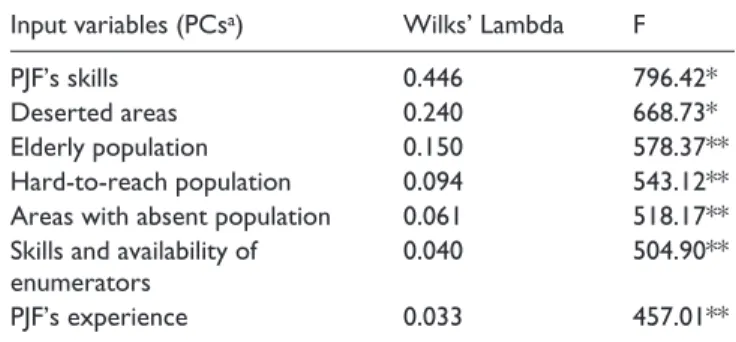
The next step involved classifying the freguesias into seven clusters using K-means clustering. K-means cluster-ing was followed by a Discriminant Analysis – uscluster-ing the seven PCs as input variables – with the aim of validating the final clustering solution. Six discriminant functions were estimated to predict the classification of each
fregue-sia in each cluster. All input variables account to
distin-guish the seven clusters (Table 3), although the three variables with strongest discriminant power – PJF’s skills, Deserted areas and Elderly population – are assumed to be negatively associated with the potential risk of failure in the Census operations, that is, the higher the PJF’s skills, the lower the risk of failure during fieldwork operations; the higher the percentage of deserted areas (areas where no one lives), the lower the risk of failure during fieldwork operations; and the higher the percentage of elderly people, the lower the risk of failure during fieldwork operations, because elderly people stay much time at home and are therefore easy to be contacted.
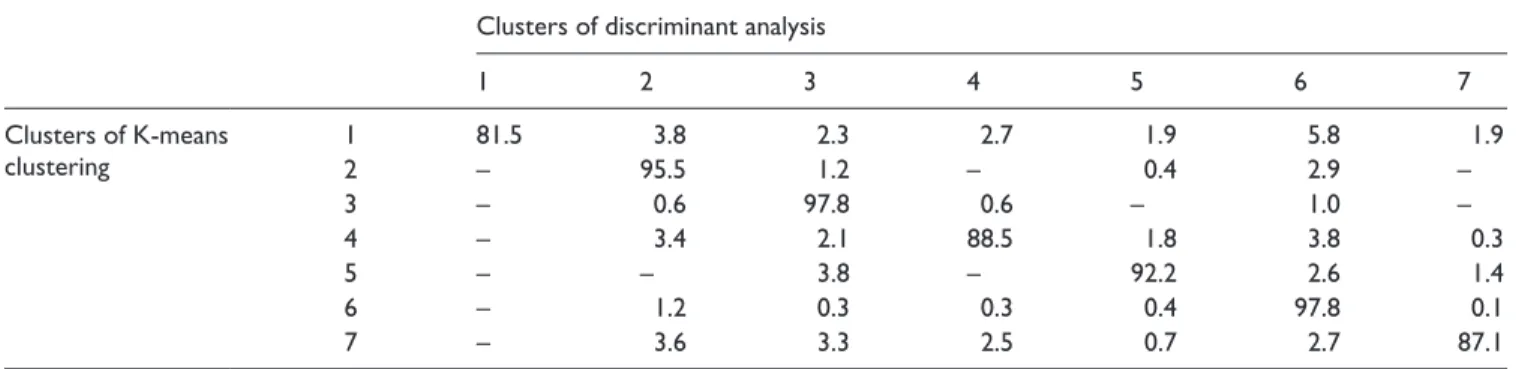
Table 4 presents a cross-classification of the freguesias into seven clusters (numbered from 1 to 7) according to both methods – K-means and Discriminant Analysis.
The percentage of freguesias classified equally by both methods ranges from 81.5% (cluster 1) to 97.8% (clusters 3 and 6) and, overall, 92.7%2 were classified equally. Clusters
1 and 7 portray the most marked differences between the two solutions but, in general, these results indicate that the K-means Cluster Analysis consistently revealed the segmen-tation structure of the data.
Description of the clusters
In this section, the seven clusters are described in terms of size, dimensions of PJF personal characteristics, dimensions of PJF perceptions of risk and percentage of PJFs consider-ing the Census operation would be ‘easy’ (last question of the questionnaire). Table 5 presents the mean value of each PC per cluster. The profile of each cluster is briefly described and the characteristics with most extreme mean values (either positive or negative) are also highlighted. A level of risk could be assigned to 3873 freguesias, which is the total num-ber of freguesias that answered the identification question.
•
• Cluster 1. Has a high mean value in PC1 – hard-to-reach population (+2.2) – which means that freguesias in this cluster are perceived as having a high percent-age of people who are difficult to contact (live in con-dominiums or dormitories areas, foreigners, live in newly urbanized areas, illiterate and socially under-privileged); the strongest negative mean value is in PC5 – areas with absent population (−0.6), which
means that these freguesias are perceived to have a small percentage of areas with absent population. PJFs are highly skilled and have an average level of experience in census operations but almost 40% of them view Census 2011 operation as a difficult task. •
• Cluster 2. Has a high mean value in PC2 – skills and availability of enumerators (+0.8) – which means that PJFs admit it will be easy to find well-prepared staff
Table 2. Model performance indicators – AIC, BIC and AIC3 – for each cluster solution in finite mixture analysis.
Model BIC AIC AIC3
3-Cluster 72,143.54 71,868.52 71,912.52
4-Cluster 71,166.03 70,797.26 70,856.26
5-Cluster 65,374.03 64,911.51 64,985.51
6-Cluster 64,426.75 63,870.47 63,959.47
7-Cluster 64,129.10 63,479.06 63,583.06
BIC: Bayesian Information Criterion; AIC: Akaike’s Information Criterion; AIC3: Corrected AIC with a penalty factor of 3.
Table 3. Discriminant power of each risk dimension. Input variables (PCsa) Wilks’ Lambda F
PJF’s skills 0.446 796.42*
Deserted areas 0.240 668.73*
Elderly population 0.150 578.37**
Hard-to-reach population 0.094 543.12**
Areas with absent population 0.061 518.17** Skills and availability of
enumerators 0.040 504.90**
PJF’s experience 0.033 457.01**
PC: principal component; PJF: President of Junta de freguesia.
aPCs are presented in the entering order.
to collaborate with the Census; the smallest mean value is in PC5 – areas with absent population (−0.5)
– which means that these freguesias are perceived to have a small percentage of areas with absent popula-tion and no areas with a hard-to-reach populapopula-tion. PJFs are highly skilled and highly experienced in cen-sus operations, and 84.4% of PJFs regard the imple-mentation of Census 2011 as ‘easy’.
•
• Cluster 3. Has a high negative mean in PCA – PJF’s skills (−1.7) – which means that PJFs admit they have limited skills (low educational level, low frequency of Internet and computer usage) and little experience with census operations. They acknowledge it is not easy to recruit skilled enumerators, but also that they do not have a hard-to-reach population. Nevertheless, 30% of them regard the implementation of Census 2011 as difficult.
•
• Cluster 4. Has a high positive mean value in PC5 – areas with absent population (+1.3) – meaning these
freguesias are perceived to have areas containing
newly constructed dwellings, non-residents and absent population (emigrants, owners/families of occasional and seasonal houses). PJFs are highly skilled, have little experience with census operations
and state it is easy to recruit skilled enumerators. Census 2011 operation is regarded as easy by 80.9% of them.
•
• Cluster 5. Has a high positive mean in PC4 – deserted areas (+1.9) – revealing the freguesias in this cluster are perceived as having many rural and abandoned areas (deserted areas). PJFs state they have little expe-rience with census operations and that it will not be easy to recruit skilled enumerators. Census 2011 is regarded as difficult by almost half of the PJFs (52.2%).
•
• Cluster 6. Has a high positive mean value in PCA – PJF’s skills (+0.4) – meaning PJFs have a high educa-tional level and high frequency of Internet and computer usage; it also has a high negative mean value in PC3 – Elderly people (−1.0) – so these
fregue-sias are perceived as having a low percentage of older
population. PJFs state they are highly skilled but have little experience with census operations and that it will be difficult to recruit skilled enumerators. Census 2011 is regarded as difficult by almost 40% of them. •
• Cluster 7. Has a high positive mean value in PC3 – elderly people (+0.7) – meaning these freguesias are perceived as having many old people; it also has a
Table 5. Profile of each cluster.
PCsa 1 2 3 4 5 6 7
PCA – PJF’s skills +0.4 +0.3 −1.7 +0.3 +0.0 +0.4 +0.0
PCB – PJF’s experience +0.0 +0.7 +0.0 −0.2 −0.3 −0.2 −0.1
PC1 – hard-to-reach population +2.2 −0.4 −0.2 −0.1 +0.0 +0.2 −0.4
PC2 – skills and availability of enumerators +0.1 +0.8 −0.1 +0.5 −0.1 −0.3 −1.1
PC3 – elderly population +0.5 −0.2 −0.1 +0.5 +0.4 −1.0 +0.7
PC4 – deserted areas −0.5 −0.3 −0.2 −0.1 +1.9 −0.1 −0.5
PC5 – areas with absent population −0.6 −0.5 +0.0 +1.3 −0.3 +0.0 −0.2
% PJFs consider Census operation ‘easy’ 61.2% 84.4% 69.7% 80.9% 52.2% 61.3% 50.7%
Number of freguesias 143 1323 288 1094 247 456 322
3.7% 34.2% 7.4% 28.2% 6.4% 11.8% 8.3%
PC: principal component; PJF: President of Junta de freguesia.
aPCs are standardized variables with mean 0 and standard deviation 1.
Table 4. Crosstabulation of clusters using K-means and discriminant analysisa (%). Clusters of discriminant analysis
1 2 3 4 5 6 7 Clusters of K-means clustering 12 81.5– 95.53.8 2.31.2 –2.7 1.90.4 2.95.8 –1.9 3 – 0.6 97.8 0.6 – 1.0 – 4 – 3.4 2.1 88.5 1.8 3.8 0.3 5 – – 3.8 – 92.2 2.6 1.4 6 – 1.2 0.3 0.3 0.4 97.8 0.1 7 – 3.6 3.3 2.5 0.7 2.7 87.1
high negative mean value in PC2 – Skills and
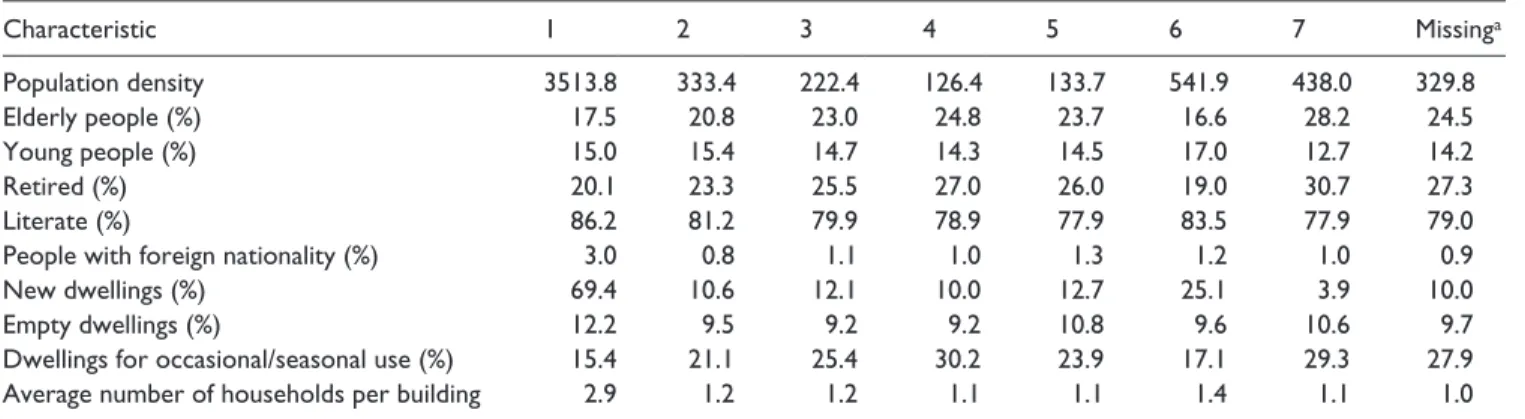
availa-bility of enumerators (−1.1) – which means that PJFs admit it is difficult to find well-prepared staff to col-laborate with the census. PJFs have average skills and experience and acknowledge it will be difficult to recruit skilled enumerators. Half of them regard the implementation of census 2011 to be a difficult task. We now turn to the description of the clusters using the 2001 Census data. Although some variables may be out of date, the Census 2001 data serve as an external confirmation of the profile of each cluster. Table 6 presents the mean value of several indicators for each cluster obtained from Census 2001.
•
• Cluster 1_Census 2001. Has a high percentage of young people (15%) and foreigners (3%) and a low percentage of elderly (17.5%) and retired (20.1%); it has a high percentage of empty dwellings (12.2%), the highest percentage of new dwellings (69.4%) and the highest average number of households per building (2.9); this cluster has the highest population density (3513.8)
•
• Cluster 2_Census 2001 and Cluster 3_Census 2001. These clusters have an average profile in all indicators. •
• Cluster 4_Census 2001. Has a low population density (126.4), a high percentage of elderly people (24.8%) and a high percentage of retired people (27%); it is the cluster with highest percentage of dwellings for occa-sional/seasonal use (30.2%).
•
• Cluster 5_Census 2001. Has a high percentage of elderly people (23.7%) and a low percentage of liter-ate people (77.9%); has a low population density (133.7).
•
• Cluster 6_Census 2001. Has a low percentage of elderly people (16.6%) and a high percentage of young people (17%), it has a high percentage of liter-ate people (83.5%), and quite a high percentage of newly constructed dwellings (25.1%).
•
• Cluster 7_Cluster 2001. Has the highest percentage of elderly people (28.2%), retired people (30.7%) and the lowest percentage of young people (12.7%); it has the lowest percentage of new dwellings (3.9%) and a high percentage of dwellings for seasonal use (29.3%). Census 2001 data also made it possible to characterize the freguesias in which the Presidents did not respond to the Perception of Risk Survey (378 freguesias) or missed the identification question (9 freguesias). In terms of geo-graphical location, the non-responding freguesias are mainly located in rural areas and 2001 data indicate they have a very similar profile to that of cluster 4, that is, a high percentage of elderly people (24.5%), retired people (27.3%) and a high percentage of dwellings for occasional/ seasonal use (27.9%).
Definition of a three-level typology of risk
The description of the profile of each cluster in the previous section clearly demonstrated that important differences exist between clusters, and that some clusters have a higher risk than others of failing the complete and exhaustive enu-meration of the population and housing during the field-work operation. However, both the research team and Statistics Portugal coordinators considered a seven-level typology of risk to be of little help as a QA tool because the reasons for classifying the risk of a freguesia are exces-sively detailed. Moreover, a closer analysis of the cluster profiles revealed similarities between them, that is, some clusters have a similar level of risk although the reasons for this risk level differ. In light of this and in order to make the Map of Alert a more comprehensive instrument, the seven clusters were grouped to create a three-level typology of risk with the following categories: ‘low risk’, ‘medium risk’ and ‘high risk’.
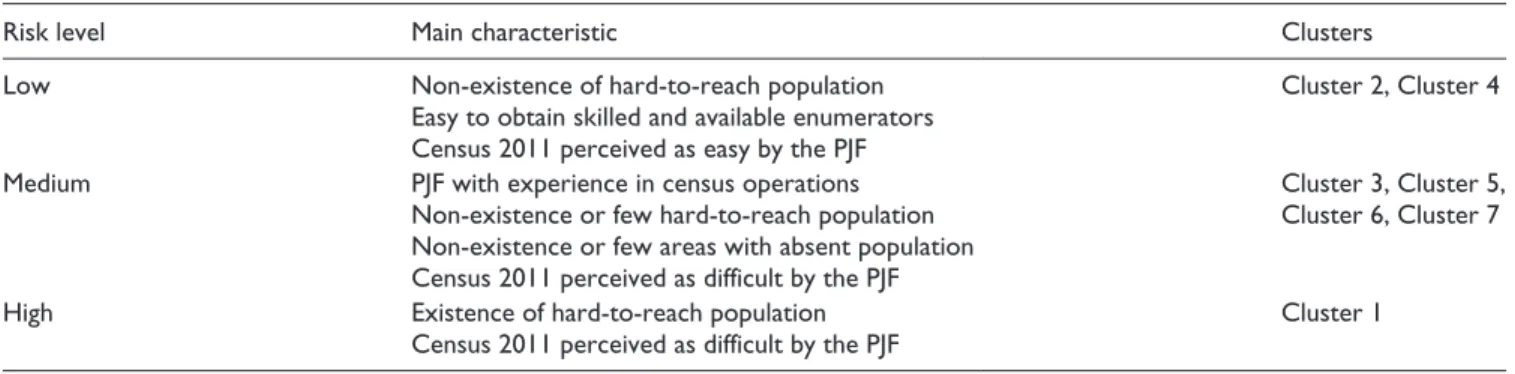
Table 7 presents the profile of each level of risk and the clusters classified in each one.
Each level of risk can be described as follows:
Table 6. Profile of each cluster according to Census 2001 data (mean values).
Characteristic 1 2 3 4 5 6 7 Missinga Population density 3513.8 333.4 222.4 126.4 133.7 541.9 438.0 329.8 Elderly people (%) 17.5 20.8 23.0 24.8 23.7 16.6 28.2 24.5 Young people (%) 15.0 15.4 14.7 14.3 14.5 17.0 12.7 14.2 Retired (%) 20.1 23.3 25.5 27.0 26.0 19.0 30.7 27.3 Literate (%) 86.2 81.2 79.9 78.9 77.9 83.5 77.9 79.0
People with foreign nationality (%) 3.0 0.8 1.1 1.0 1.3 1.2 1.0 0.9
New dwellings (%) 69.4 10.6 12.1 10.0 12.7 25.1 3.9 10.0
Empty dwellings (%) 12.2 9.5 9.2 9.2 10.8 9.6 10.6 9.7
Dwellings for occasional/seasonal use (%) 15.4 21.1 25.4 30.2 23.9 17.1 29.3 27.9
Average number of households per building 2.9 1.2 1.2 1.1 1.1 1.4 1.1 1.0
•
• Low risk. Freguesias in this category tend to have low percentages of hard-to-reach population, and PJF believes it is easy to find skilled and available enu-merators to collaborate with the Census; PJF per-ceives the Census implementation to be easy. Clusters 2 and 4 match this profile.
•
• Medium risk. Freguesias in this category tend to have PJF with experience in census operations, a very low percentage of hard-to-reach population and almost non-existent areas with absent population; the PJF perceives the Census 2011 implementation to be dif-ficult. Clusters 3, 5, 6 and 7 match this profile. •
• High risk. This category includes freguesias with high percentages of hard-to-reach population, which is the factor that puts a complete and accurate enumeration of the population most at risk. Cluster 1 is classified in this category.
Table 8 presents the size of each risk level in the Map of Alert. Out of the 3873 freguesias with an assigned risk level, 3.7% were considered as having a high risk of not fulfilling the quality standards in fieldwork operations, representing 22.7% of the population (in 2001). The medium- and low-risk clusters include 33.9% and 62.4% of the freguesias, and 44.9% and 32.4% of inhabitants (in 2001), respectively.
Figure 2 in the Appendix 1 represents the Map of Alert for Portugal with the three levels of risk: low risk (in green), medium risk (in orange) and high risk (in red). Freguesias that did not respond to the Perception of Risk survey or missed the question on identification could not be assigned a level of risk. They are identified in black in the Map.
Final considerations
The Map of Alert was an ambitious and innovative tool for the QA system of the Census 2011 designed with the main objective of improving overall coverage of population and housing. Freguesias were categorized in terms of their poten-tial difficulty of enumeration to support a stratified approach to QA activities. The Map allowed local QA activities to be tailored to the level of risk assigned to the freguesia, that is, more extensive and frequent checks were made in more prob-lematic freguesias. This customized approach to QA aimed to ensure that the right balance was maintained between the sev-eral dimensions of data quality, and enabled the prompt iden-tification of major systematic problems so they could be addressed and resolved during the fieldwork stage.
As the monitoring and supervising task of the fieldwork operation was performed by the municipal coordinator, the Map of Alert was given to all municipality supervisors of the Census in order to inform them in advance of the challenges they faced and help them organize specific coordinating measures suitable for the risk level of their areas of responsi-bility. High-risk freguesias would be prioritized during the Census operation. Different monitoring of the freguesia’s deployment of the fieldwork was recommended for each of the three alert levels.
The Map of Alert reveals that 143 freguesias had a high risk of failing to conform to the Census fieldwork quality standards and were classified with a red alert code. This cor-responded to 3.7% of the 3873 freguesias with an assigned risk level and to 22.7% of the enumerated population in 2001. The factors that contributed most to such a high risk
Table 7. Profile of each risk level based on dimensions of risk and PJF perception of 2011 Census implementation.
Risk level Main characteristic Clusters
Low Non-existence of hard-to-reach population
Easy to obtain skilled and available enumerators Census 2011 perceived as easy by the PJF
Cluster 2, Cluster 4
Medium PJF with experience in census operations
Non-existence or few hard-to-reach population Non-existence or few areas with absent population Census 2011 perceived as difficult by the PJF
Cluster 3, Cluster 5, Cluster 6, Cluster 7
High Existence of hard-to-reach population
Census 2011 perceived as difficult by the PJF Cluster 1
PJF: President of Junta de freguesia.
Table 8. Size of risk levels in the Map of Alert.
High (Red) Medium (Orange) Low (Green)
Number of freguesiasa 143 1313 2417
% of freguesias 3.7% 33.9% 62.4%
Population (2001 Census) 2,346,657 4,647,852 3,361,608
% of population (2001 Census) 22.7% 44.9% 32.4%
level were the existence of hard-to-reach population (the illiterate, the socially underprivileged, those living in condo-miniums or in dormitories areas, foreigners and those living in newly urbanized areas) and the fact that PJFs admitted some difficulty in deploying the Census fieldwork operation. According to 2001 Census, the same cluster (cluster 1) encompassed high population density levels – typical of heavily urbanized areas – high percentages of young persons and foreigners, high percentages of empty dwellings and one of the highest scores for the average number of recent con-structions for dwellings. This profile is coherent with diffi-culty in finding people at home, which Statistics Portugal gave as the biggest obstacle to the smooth running of census operations. The red alert code of this cluster implied the recruitment of more highly skilled enumerators, who would be given more intensive training and be subject to more intensive checks from both the municipal coordinators and the PJF during the Census fieldwork operation.
Prior to 2011, the QA system of Census operations was designed with standardized nationwide procedures, that is, standards, indicators, processes and sub-processes were defined at national level and this also meant that all regions used the same QA activities for monitoring purposes. This approach restricted the opportunity to integrate the QA into the production process and drastically reduced the capabili-ties and effectiveness of the QA system. This was manifested above all in the inability to get real-time information and provide feedback to the production sector in order to facili-tate corrective actions and make timely improvements. For a QA system to be truly effective, it must be capable of address-ing all aspects of the operation that could be exposed to error or failure. The Map of Alert was given to municipal coordi-nators before the beginning of the fieldwork operations which allowed them to know in advance the level of control to apply in each freguesia in order to assure the appropriate standards of quality. In the census literature, the quality focus is on the net undercount of enumeration units, as studied by Isaki et al. (1988), by Biemer et al. (2001) and by Redfern (2003) who tackled specific undercount issues in census such as migration. However, these are all based on post- enumeration surveys. In the context of census operations, the Map of Alert is therefore an innovation since it is based on survey data collected prior to the fieldwork operations, thus enabling the QA and production operations to be conceived simultaneously so that the vulnerabilities within the census operation could be foreseen and addressed in an appropriate and timely manner.
Although Portugal is a small country, it is geographically and demographically very diverse with heavily urbanized as well as rural areas, very densely populated areas and also vil-lages that are almost abandoned and deserted, regions with predominately old people and other much younger regions. This diversity affects differently the implementation of a cen-sus operation as the problems, difficulties and risk of failure are not uniform, but vary according to the specificities of the
population and the areas where the Census is being imple-mented. In such a scenario, it was necessary to use a method-ology capable of uncovering different profiles of risk of failure and at the same time link each freguesia to each profile of risk. Cluster analysis appeared as the most appropriate methodology for this purpose, since it can reveal the charac-teristics of patterns present in a multivariate set of data and to place objects into groups, such that objects in a given group tend to be similar to each other in some sense, and objects in different groups tend to be dissimilar (Everitt et al., 2010).
Although cluster analysis revealed seven groups of
freguesias with distinct characteristics, a decision was made
to condense them into three levels of risk, thus making the map simpler but more effective. This decision was mostly based on the expertise and sensibility of the Census Office of Statistics Portugal and proves the importance of ‘calibrating’ the outcomes of statistical methods with qualitative informa-tion, namely, in contexts of great operational complexity as it is the case of population and housing censuses.
Acknowledgements
This article is part of the project Programa de Controlo e Avaliação
da Qualidade dos Censos 2011, a joint project of Statistics Portugal
and Instituto Universitário de Lisboa (ISCTE-IUL).
Declaration of conflicting interests
The author(s) declared no potential conflicts of interest with respect to the research, authorship and/or publication of this article.
Funding
The author(s) received no financial support for the research, author-ship and/or publication of this article.
Notes
1. The questionnaire is presented in Figure 2 of Appendix 1. 2. Cross-validation in which each case is classified according to
discriminant functions estimated with all the cases and exclud-ing the one under analysis.
References
Akaike H (1973) Information theory and an extension of the maxi-mum likelihood principle. In: Petrov BN and Csaki F (eds) 2nd
International Symposium on Information Theory. Budapest:
Akademiai Kiado, pp. 267–281.
Biemer P, Woltmann H, Raglin D, et al. (2001) Enumeration accu-racy in a population census: An evaluation using latent class analysis. Journal of Official Statistics 17: 129–148.
Bushery J, Reichert J and Blass R (2003) U.S. census 2010 qual-ity assurance strategy. In: Joint statistical meetings – Section
on survey research methods, San Francisco, California, 3–7
August, pp. 749–754.
Carmines E and Zeller R (1979) Reliability and Validity Assessment. Beverly Hills: SAGE.
Dias J (2006) Latent class analysis and model selection. In: Spiliopoulou M, Kruse R, Borgelt C, et al. (eds) From Data
and Information Analysis to Knowledge Engineering. Berlin:
Springer-Verlag, pp. 95–102.
Everitt B, Landau S, Leese M, et al. (2010) Cluster Analysis (5th edn). New York: John Wiley & Sons.
Isaki C, Schultz L, Diffendal G, et al. (1988) On estimating cen-sus undercount in small areas. Journal of Official Statistics 4: 95–112.
Jackson J (1991) A User’s Guide to Principal Components. New York: John Wiley & Sons.
Kline P (1994) An Easy Guide to Factor Analysis. London: Routledge.
Magidson J and Vermunt J (2002) Latent class models for clus-tering: A comparison with K-means. Canadian Journal of
Marketing Research 20: 37–44.
Redfern P (2003) Estimating census undercount by demographic analysis: New approaches to the emigrant component. Journal
of Official Statistics 19: 421–448.
Schwarz G (1978) Estimating the dimension of a model. Annals of
Statistics 6: 461–464.
Sharma S (1996) Applied Multivariate Techniques. New York: John Wiley & Sons.
Statistics Portugal (2007) Programa de Acção para os Censos
2011. Gabinete dos Censos, Statistics Portugal, June.
United Nations (2008) Principles and recommendations for
population and housing censuses. Statistical Papers Series
M. no. 067/Rev 2. Available at: https://unstats.un.org/unsd/ publication/seriesm/seriesm_67rev2e.pdf
Vermunt J and Magidson J (2000) Latent GOLD 2.0. User’s Guide. Belmont, MA: Statistical Innovations Inc.
Waite P (2007) State, Local and Tribal Governments Benefit by
Early Participation in the 2010 Census. Washington, DC: US
Census Bureau Press Release.
White I (2009) The 2011 census taking shape: Methodological and technological developments. Population Trends 136: 64–72.
Wroth-Smith J, Abbott O, Compton G, et al. (2011) Quality assur-ing the 2011 Census population estimates. Population Trends 143: 13–21.
Author biographies
Elizabeth Reis, PhD, Full Professor of Statistics and Data Analysis at Instituto Universitário de Lisboa (ISCTE-IUL). Main areas of research: Multivariate Statistics, Segmentation Methods, Survey and Census Methodology.
Paula Vicente, PhD, Assistant Professor of Statistics and Data Analysis at Instituto Universitário de Lisboa (ISCTE-IUL). Main areas of research: Survey and Census Methodology, Market and Social Research.
Álvaro Rosa, PhD, Assistant Professor of Management at Instituto Universitário de Lisboa (ISCTE-IUL). Main areas of research: Quality Management, Strategy, Corporate Governance, International Management.
Catarina Marques, PhD, Assistant Professor of Statistics and Data Analysis at Instituto Universitário de Lisboa (ISCTE-IUL). Main areas of research: Structural Equation Modelling, Segmentation Methods.
Appendix 1
Perception of Risk Survey
Questionnaire to Presidents of Juntas de freguesia as part of the Pilot Test of the 2011 Census IDENTIFICATION
Freguesia: ___________________________________________________________________________________
Municipality:__________________________________________________________________________________ Name: ___________________________________________________________________ Age: __________ Educational level:
Less than basic level Basic level (compulsory 9 years) Secondary University For how long have you been president in this Junta de freguesia: __________ years
Frequency of computer use: Rarely Several times a week Everyday Several times a day Frequency of internet use: Rarely Several times a week Everyday Several times a day PERCEPTION OF FREGUESIA’S FEATURES
Rate your responses using a 1 to 5 scale for the following items regarding the Freguesia. Mark the number corresponding to your choice with X.
1 POPULATION
1. Existence of elderly population (age ≥65 years) Few 1 2 3 4 5 Many
2. Existence of illiterate population
(cannot read or write) Few 1 2 3 4 5 Many
3. Existence of population living in social housing
neighbourhoods Few 1 2 3 4 5 Many
4. Existence of emigrant population Few 1 2 3 4 5 Many
5. Existence of immigrant population Few 1 2 3 4 5 Many
6. Existence of homeless population Few 1 2 3 4 5 Many
2 HOUSING AND AREAS
1. Existence of areas with predominantly closed
condo-miniums Few 1 2 3 4 5 Many
2. Existence of areas with predominantly second or
summer homes Few 1 2 3 4 5 Many
3. Existence of areas with predominantly recently built
residential housing Few 1 2 3 4 5 Many
4. Existence of areas with difficult access (e.g. no
tar-mac roads, no lighting, …) Few 1 2 3 4 5 Many
5. Existence of areas with dispersed housing Few 1 2 3 4 5 Many
6. Existence of predominantly dormitory areas Few 1 2 3 4 5 Many
3 HUMAN RESOURCES
1. How difficult will it be to recruit suitably skilled
enumerators Hard 1 2 3 4 5 Easy
2. How difficult will it be to recruit enumerators with
availability Hard 1 2 3 4 5 Easy
4 OVERALL OPINION ABOUT THE CENSUS How difficult will it be to implement the Census 2011
operation in the freguesia Hard 1 2 3 4 5 Easy