Accessing
Planktothrix species
diversity and
associated toxins
using quantitative
real-time PCR in
natural waters
Catarina Isabel Prata Pereira Leitão Churro
Doutoramento em Biologia
Departamento Biologia 2015
Orientador
Vitor Manuel de Oliveira e Vasconcelos, Professor Catedrático Faculdade de Ciências
Accessing Planktothrix species diversity and associated toxins using quantitative real-time PCR in natural waters
The research presented in this thesis was supported by the Portuguese Foundation for Science and Technology (FCT, I.P.) national funds through the project PPCDT/AMB/67075/2006 and through the individual Ph.D. research grant SFRH/BD65706/2009 to Catarina Churro co-funded by the European Social Fund (Fundo Social Europeu, FSE), through Programa Operacional Potencial Humano – Quadro de Referência Estratégico Nacional (POPH – QREN) and Foundation for Science and Technology (FCT).
The research was performed in the host institutions: National Institute of Health Dr. Ricardo Jorge (INSA, I.P.), Lisboa; Interdisciplinary Centre of Marine and Environmental Research (CIIMAR), Porto and Centre for Microbial Resources (CREM - FCT/UNL), Caparica that provided the laboratories, materials, regents, equipment’s and logistics to perform the experiments.
Accessing Planktothrix species diversity and associated toxins using quantitative real-time PCR in natural waters
ACKNOWLEDGMENTS
I would like to express my gratitude to my supervisor Professor Vitor Vasconcelos for accepting to embark in this research and supervising this project and without whom this work would not be possible. I am also greatly thankful to my co-supervisor Elisabete Valério for the encouragement in pursuing a graduate program and for accompanying me all the way through it. Appreciation also goes to my co-supervisor Paulo Pereira for accepting me in his Lab., for his understanding and patience and for always pushing me to reach my limits. I also acknowledge Professor Octávio Paulo for his guidance and help with the phylogenetic analysis.
A very special thanks goes to Elsa Dias and Carina Menezes for their assistance in the laboratory and help along the way, for their motivation and encouragement, exchanges of knowledge and skills, for proofreading this thesis, “Twilight zone” moments and venting of frustration, and also, for the fruitful scientific discussions, which helped to enrich the experience.
I would like to thank all who contributed to the work described in this thesis. To Bruno Silva who helped me with the plasmid constructs and introduce me to the world of cloning. To Andreia Penado that provided me with assistance in statistical analysis at times of critical need. To Carina Menezes and Elsa Dias for all the culture extracts and toxin analysis with HPLC. To Joana Martins and Vitor Ramos, from CIIMAR, for providing me with Planktothrix strains. To Cristina Almeida, José Grossinho, Manuela Silva, João Sousa and Helena Rebelo for the assistance in the measurements of the environmental chemical parameters.
Recognition is also given to the financial support provided for this research from the Foundation of Science and Technology through the project PPCDT/AMB/67075/2006 and PhD grant SFRH/BD65706/2009. I must also acknowledge all the institutions and laboratories that have received me and/or provided logistic support and equipment to conduct the experiments: National Institute of Health Dr. Ricardo Jorge, Interdisciplinary Centre of Marine and Environmental Research and Centre for Microbial Resources; the departments of: Environmental Health, Genetics, Food and Nutrition, Infectious Diseases from the National Institute of Health Dr. Ricardo Jorge.
RESUMO
Em Portugal, as cianotoxinas mais frequentes em águas doces são as microcistinas e a sua ocorrência tem sido sobretudo associada a cianobactérias do género Microcystis. No entanto, e mais recentemente, tem vindo a ser descrita a produção destas toxinas por espécies do género Planktothrix, sugerindo que este género é, também, um produtor importante de microcistinas nas águas doces superficiais portuguesas. Porém, e contrariamente às espécies de Microcystis, o conhecimento acerca da ocorrência, distribuição e toxigénese de Planktothrix é ainda limitado.
As espécies de Planktothrix apresentam algumas particularidades que dificultam a sua amostragem e identificação/quantificação em amostras naturais - Capítulo 2. Em particular, a morfologia das colónias de Planktothrix não permite distinguir facilmente as células individualizadas, o que torna a sua identificação e quantificação particularmente difíceis por microscopia óptica, o método geralmente usado na monitorização de cianobactérias no ambiente. Por outro lado, os métodos usados na detecção de microcistinas (ELISA, HPLC) não identificam as espécies produtoras. Estas estirpes podem ser identificadas por PCR convencional, mas este método não permite quantificar a sua densidade. Em suma, não está ainda disponível um método que, simultaneamente, identifique e quantifique as estirpes produtoras de microcistinas. Neste trabalho pretendeu-se desenvolver um método de PCR em tempo real aplicado à monitorização de espécies tóxicas de Planktothrix em reservatórios de água doce superficial destinados ao consumo humano e actividades recreativas.
O trabalho experimental desenvolveu-se de acordo com as fases que seguidamente se enumeram.
Numa primeira fase realizaram-se estudos de campo de forma a avaliar a ocorrência e distribuição de Planktothrix em diversas albufeiras - Capítulo 3. Concluiu-se que o
Planktothrix tem uma distribuição abrangente e que a espécie Planktothrix agardhii é a
mais comum. Foi identificada a produção de microcistinas em isolados desta espécie. Numa segunda fase, foi desenvolvido um método de detecção e quantificação de
Planktothrix agardhii, baseado na metodologia de PCR em tempo real - Capítulo 4. A
metodologia de PCR em tempo real é bastante promissora para a investigação em cianobactérias, bem como para a sua monitorização no ambiente. A principal vantagem desta técnica, relativamente ao PCR convencional, é a possibilidade de quantificar o número de cópias do gene-alvo numa amostra. Assim, para além de identificar estirpes de Planktothrix, o PCR em tempo real é simultaneamente um método de quantificação,
Accessing Planktothrix species diversity and associated toxins using quantitative real-time PCR in natural waters
o que constitui uma vantagem relativamente aos procedimentos de rotina utilizados na monitorização de cianobactérias. De salientar que a determinação da densidade celular é fundamental na avaliação de risco de ocorrência de cianobactérias tóxicas, visto que os valores guia para as cianotoxinas se baseiam nas concentrações cianobacterianas e na quota de cianotoxina por célula.
Outro aspecto importante na monitorização de cianobactérias é a utilização de amostras preservadas. A preservação é utilizada para manter as características morfológicas para posterior identificação e quantificação celulares e, também, para evitar a degradação do material biológico durante o transporte da amostra. Neste trabalho foi também avaliada a aplicabilidade do método de PCR em tempo real previamente desenvolvido, na amplificação de ADN de amostras preservadas - Capítulo 5. Os resultados indicam que o PCR em tempo real é uma técnica robusta e aplicável àquele tipo de amostras mas que os métodos mais comuns de preservação (Solução de Lugol, Formaldeído e Gluteraldeído) reduzem a quantidade/qualidade/disponibilidade de ADN. Como o ADN se degrada rapidamente após fixação das amostras, foi avaliada a aplicação do PCR em tempo real a amostras preservadas por outro método de preservação - Capítulo 6. A preservação em metanol 100% a -20ºC permitiu manter a integridade das amostras quer para análises morfológicas quer para análises moleculares até dois anos de preservação.
O último capítulo desta tese reporta o resultado de dois anos de monitorização de uma albufeira que apresenta uma florescência persistente de P. agardhii tóxico (Capítulo 2,
Anexo A: Pág. 187) – Capítulo 7. Nesta albufeira, densidades celulares elevadas nem
sempre correspondiam a quantidades elevadas de toxina e vice-versa. Utilizando a técnica de PCR em tempo real foi possível verificar que estão presentes estirpes tóxicas e não tóxicas e que podem florescer em alturas diferentes. Foi também detectado uma segunda espécie não pertencente ao género Planktothrix que poderá estar também a contribuir para a concentração de microcistinas. Durante a monitorização foi observado um parasita quitrídeo que infectava os filamentos de Planktothrix (Anexo A: Pág. 191). A densidade deste parasita foi também quantificada através de PCR em tempo real e verificou-se que o seu aparecimento e desenvolvimento coincidia com o aumento de estirpes tóxicas e concentração de microcistinas.
Palavras-chave
Cianobactérias, florescências, qPCR em tempo real, quitrídeos, mcyA, microcistinas, monitorização, Planktothrix, preservação, Rhizophydium megarrhizum, rpoC1.
ABSTRACT
The most common cyanotoxins in Portuguese freshwaters are microcystins and their occurrence has been mainly attributed to cyanobacteria from the Microcystis genus. However, most recently, it has been described the production of these toxins by species of Planktothrix, suggesting that this genus is also a major producer of microcystin in Portuguese surface waters. Nevertheless, and conversely to the Microcystis species, the knowledge on the occurrence, distribution and toxigenesis of Planktothrix is still limited.
Planktothrix species exhibits some particularities that difficult their sampling,
identification, quantification and toxigenic characterization in natural samples - Chapter
2. Particularly, the morphology of Planktothrix colonies does not allow distinguishing
easily the individual cells. This makes their identification and quantification by optical microscopy a very difficult task, although this is the method generally used in cyanobacteria monitoring. Moreover, the most common methods for the detection of microcystins (ELISA, HPLC) do not identify the producer strains. These strains can be identified by conventional PCR, but this method doesn’t enable to quantify them. In resume, there is not yet available a method that allow simultaneously identify and quantify microcystin-producing strains.
This work aimed to develop a method based on Real-Time PCR applied to the monitoring of toxic species of Planktothrix in surface freshwater reservoirs used as drinking water supply and for recreational activities.
The experimental work was developed according to several phases that are listed and explained below.
In a first approach, field surveys were conducted to access the occurrence and distribution of Planktothrix – Chapter 3. It was observed that Planktothrix has a wide distribution in Portuguese lakes and that Planktothrix agardhii is the most commonly found species. Furthermore microcystin production was detected in isolates from this species.
In a second stage, it was developed a method based on real-time PCR to detect and quantify Planktothrix agardhii - Chapter 4. The real-time PCR is a promising technique for cyanobacteria research and monitoring. The main advantage of real-time PCR over conventional PCR is the ability to quantify the target gene copy numbers on a sample. Thus, in addition to identifying Planktothrix strains, the real-time PCR also enables to quantify those strains, which constitutes an advantage over the procedures used in the routine monitoring of cyanobacteria. It should be noted that the determination of the cell
Accessing Planktothrix species diversity and associated toxins using quantitative real-time PCR in natural waters
density is critical in the risk assessment of toxic cyanobacteria, as the guideline values for cyanotoxins are based on cyanobacterial concentrations as well as on toxin cell quota.
Another important aspect in cyanobacteria monitoring is the use of preserved samples. Preservation is used to maintain the morphologic features of cyanobacterial cells to further be used in their identification/quantification and also to avoid sample degradation during transport. In this work, the applicability of the real-time PCR technique in the amplification of DNA from preserved samples was evaluated, by using the method previously developed for cell quantification – Chapter 5. The results indicate that real-time PCR is a robust technique applicable to those types of samples but that the most common preservation methods (Lugol’s solution, formaldehyde, glutaraldehyde) reduce the DNA quantity and quality. Since DNA degrades fast in those samples, the applicability of real-time PCR on preserved samples was tested using other preservation procedure – Chapter 6. The preservation in methanol 100% at -20ºC allowed maintaining the integrity of the samples both for morphologic and molecular analysis up to two years after preservation.
The last chapter of this thesis reports the result of two years of monitoring a water reservoir having a persistent bloom of toxic P. agardhii (Chapter 2, Appendix A: Pág. 187) - Chapter 7. In this reservoir, high cell densities did not always correspond to high amounts of toxin and vice versa. Using the real-time PCR it was demonstrated that both toxic and non-toxic strains are present within the reservoir and that they can flourish at different times. It was also detected a specie from another genus that also contributes to the production of microcystins. During the monitoring it was observed a chytrid parasite that infected the filaments of Planktothrix (Appendix A: Pág. 191). The density of this parasite was also quantified by real-time PCR and the results showed that its development coincides with the increase of toxic Planktotrhix strains and of microcystin levels in the reservoir.
Key-Words
Cyanobacteria, blooms, chytrids, mcyA, microcystins, monitoring, Planktothrix, preservation, Real-time qPCR, Rhizophydium megarrhizum, rpoC1.
CONTENTS
Front matter_
Pages IV
Acknowledgments Pages VII VIII
Resumo
Pages IX X
Abstract
Pages XI XII
Contents
Pages XIII XIV
List of tables
Pages XV XX
List of figures
Pages XXI XXII
Abbreviations list
Pages XXIII XXIV
Epigraph
_End matter
Pages 167 184 References Pages 185 198 Appendix A Pages 199 203 Appendix B Pages 205 207 Appendix CAccessing Planktothrix species diversity and associated toxins using quantitative real-time PCR in natural waters
01
Pages 1 General Introduction 1202
Pages 13 Risk assessment of cyanobacteria and cyanotoxins, the particularities and 46 challenges of Planktothrix spp. Monitoring03
Pages 47 Profiling the cyanobacteria Planktothrix from Portuguese freshwaters: 70 Identification, occurrence, distribution, and PhylogenyPages 71 90
Species-specific real-time PCR cell number quantification of the bloom forming cyanobacterium Planktothrix agardhii.
04
Pages 91 112
Applicability of the real-time PCR assay in the amplification of cyanobacterial DNA from preserved samples.
05
Pages 113 136
Evaluation of methanol preservation for molecular and morphological studies in cyanobacteria using Planktothrix agardhii.
06
07
Pages 161 166 Final Considerations08
Pages 137 160Monitoring the variability of mcyA gene and microcystin concentration of a
Planktothrix agardhii bloom – Do chytrid parasitism play a role on bloom
LIST OF TABLES
CHAPTER 2
Table 1 Cyanotoxins detected and correspondent taxa from which have been isolated
as well as their primary target in mammals. Based on the information from (Chorus et al., 2000; Carmichael, 2001; Codd et al., 2005; Stewart et al., 2006; van Apeldoom et al., 2007; Bláha et al., 2009; Valério et al., 2010; Mihali et al., 2009). * - The dose needed to kill 50% of mice 19 Table 2 WHO guideline values for safe practice in managing bathing waters that may
contain cyanobacterial cells, according to the level of probability of adverse health effects (WHO, 2003) 23 Table 3 Guideline values (GV) estimated for cyanobacterial toxins in drinking water. Nd
– not determined 28 Table 4 Lakes were Planktothrix spp. has been reported to form recurrent blooms. (a)
Bloom Sample/Environmental sample, (b) Filaments isolated from bloom samples, (c) anti-Adda ELISA Kit, (d) HPLC, (e) protein phosphatase 2A inhibition assay (PP2A), (f) Mean depth., (---) Information not available 31 - 33
CHAPTER 3
Table 1 Currently described Planktothrix species based on Suda et al. 2002, Komárek
and Komárková 2004, Komárek and Anagnostidis 2005, Liu et al. 2013 and Gaget et al. 2015 51 Table 2 Portuguese Lakes sampled during field surveys from 2007 to 2013 52 Table 3 Planktothrix cultures used in the study 56 Table 4 Morphologic characteristics of Planktothrix isolates from Portuguese Lakes 58
CHAPTER 4
Table 1 Real-time PCR standard curve equations and reaction amplification efficiencies
of 2-sets of 10-fold dilutions of the same sample subject to different DNA extraction methods based on predetermined cell concentrations and for three different strains of P.
Accessing Planktothrix species diversity and associated toxins using quantitative real-time PCR in natural waters
CHAPTER 5
Table 1 Real-time PCR standard curve and reaction amplification efficiencies 98 Table 2 Genomic DNA quality. The values are present in the range of the OD260/OD280
and OD260/OD230 values that were obtained in the three experiments. The reference ratio values for good-quality DNA are OD260/280 = 1.8 and OD260/230 = 2.0 101
CHAPTER 6
Table 1 Genomic DNA quality determination by means of optical density ratios of
non-preserved and non-preserved methanol samples. The reference ratio values for good-quality
DNA are OD260/280 = 1.8 and OD260/230 = 2.0 122 Table 2 Quality assessment of nucleotide sequences of the rpoC1 fragment of 224 bp
retrieved from non-preserved and preserved methanol samples. The values are given in number of nucleotides, with low quality values (QV), medium QV and high QV, based on base call accuracy. LOR is the length of reading of the nucleotide sequence 124 Table 3 Morphometry of Planktothrix agardhii (LMECYA 256) cells in non-preserved
samples (fresh sample), 24 h methanol 100% preserved samples and samples preserved with Lugols’s iodine solution. The asterisk denotes significant differences between fresh and preserved samples, z-test, p < 0.01 126
CHAPTER 7
Table 1 Target genes, primer sequences and target organisms used in this study. Tann
– Primer annealing temperature. The Fragment length includes the primers 143 Table 2 Primer specificity. (+) Target DNA fragment amplification, (-) Lack of target DNA
fragment amplification, (nt) not tested. MCYS – microcystins, PST – paralytic shellfish poisoning toxins, SXT – Saxitonin, CYLIND – Cylindrospermopsin 144
APPENDIX B
Number of rpoC1, 16s rRNA and phycocyanin gene copies present in cyanobacteria genomes 201-202
APPENDIX C
Nucleotide alignment of the rpoC1 sequences retrieved from non-preserved samples and samples preserved in methanol for 6, 18 and 24 months 207
LIST OF FIGURES
EPIGRAPH
Photo “This is as close as you’ll be to water in a few years” Awareness campaign “Stop
Global Warming”, Postal Free, Young & Rubicam Redcell, Corbis, PubliCards, ACT
CHAPTER 1
Cover photo Planktothrix agardhii and Microcystis aeruginosa bloom at Magos Lake,
Portugal, October 2012 1 Figure 1 Cyanobacteria blooms in Portuguese lakes. A – Fish mortality in Patudos lake
undergoing a cyanobacterial bloom (source: Publico newspaper by Marisa Soares, September 9th, 2014); B – Aphanizomenon bloom in central Portugal, May 2015; C –
Planktothrix bloom in Roxo Lake, September 2005; D – Aphanizomenon and Microcystis
bloom in Alvito Lake, September 2005; E – Microcystis bloom in Magos Lake, October 2012; F – Planktothrix bloom in Patudos Lake, October 2012 5 Figure 2 Occurrence and distribution of Planktothrix in European Lakes 7 Figure 3 Representation of the microcystin synthetase gene cluster (mcy) in Planktothrix
(Christiansen et al. 2003), Microcystis (Tillett et al. 2000), Anabaena (Rouhiainen et al. 2004) and Nostoc (Fewer et al. 2013). Adapted from Kurmayer and Christiansen (2009) and Fewer et al. (2013). The arrows indicate the transcription direction 9 Figure 4 Mode of action of the fluorophores used in real-time PCR, SYBR® Green and
TaqMan® assays. R – reporter, Q – quencher 10
CHAPTER 2
Figure 1 Optical microscopy photographs of cyanobacteria presenting different
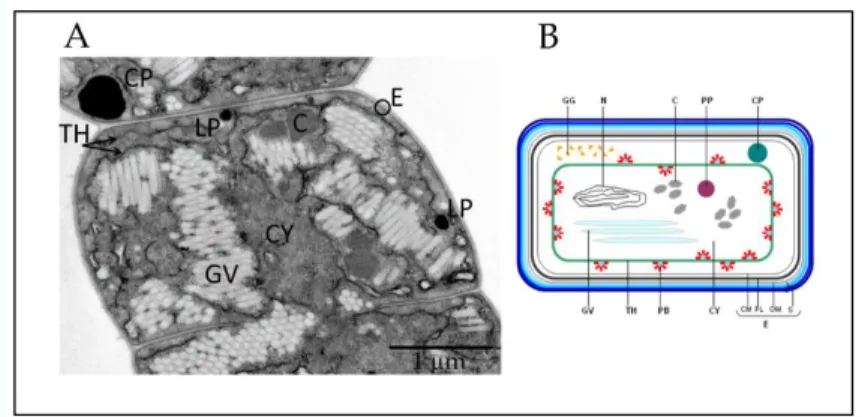
morphologies. The arrow indicates the heterocyst cell in Anabena circinalis 16 Figure 2 Cyanobacteria cell structure. (A)Transmission electron micrographs showing
the ultrastructure of an Anabena circinalis vegetative cell; (B) Schematic diagram of a cyanobacterial vegetative cell. S: external 4-layered cell wall; OM: outer membrane; PL: peptidoglycan layer; CM: cytoplasmic membrane; CW: cell wall; E: cell envelope; TH: thylakoid; PB: phycobilisome; CY: cytoplasm; GV: gas vesicle; GG: glycogen granules;
Accessing Planktothrix species diversity and associated toxins using quantitative real-time PCR in natural waters
N: nucleoplasmic region; C: carboxysome; PP: polyphosphate granule; CP: cyanophycin
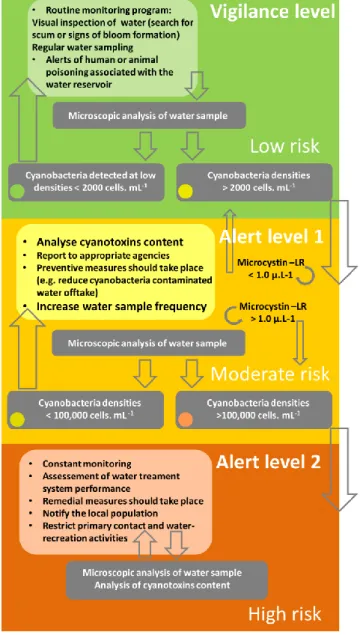
granule; LP: lipid droplets (adapted from van den Hoek et al., 1995; Castenholz, 2001)16 Figure 3 Organizational chart of the steps involved in risk assessment (adapted from
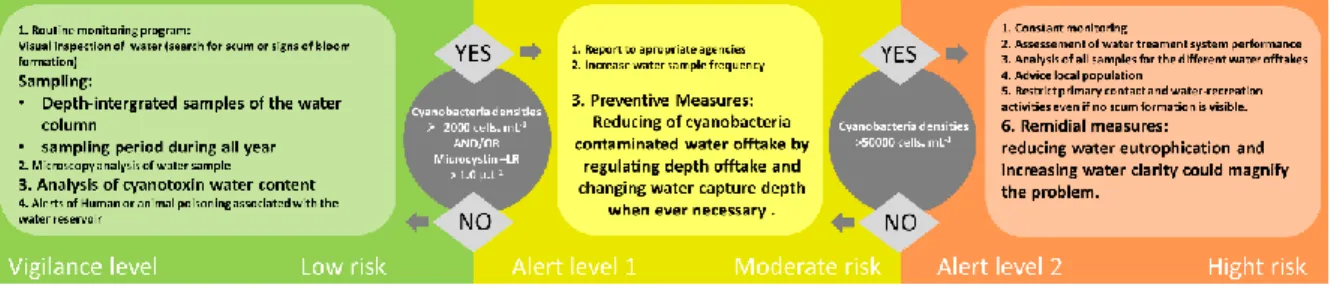
Dolah et al. 2001) 20 Figure 4 Organizational chart of the steps involved in cyanobacteria risk management
(adapted from Bartram et al. 1999) 24 Figure 5 Planktothrix occurrence in a freshwater reservoir located in the center of
Portugal and microcystin-LR concentration in raw water over the same sampling period (---- microcystin concentration in µg.mL -1, light blue bars represent Planktothrix spp. cell concentration in nºcells.mL-1, black bars represent total phytoplankton cell concentration in nºcells.mL-1)
34 Figure 6 Scheme of the steps involved in Planktothrix risk management 36
CHAPTER 3
Cover photo Scanning electron microscopy microphotograph of the microscystin
producer Planktothrix rubescens LMECYA203 amplified 400x. Scale bar 100 m, Phenom Pro microscope 47 Figure 1 Light microscopy photographs of Planktothrix strains isolated from Portuguese
freshwater reservoirs. A – C: P. agardhii CHURRO10; D: P. agardhii CHURRO23; E: P.
agardhii CHURRO29; F-G: P. agardhii CHURRO5; H-J: P. pseudoagardhii LMECYA162;
K-M: P. rubescens LMECYA203; N-O: P. mougeotii LEGE 06226. The arrow indicates the calyptra in N and the necredia in O 59 Figure 2 Scanning electron micrographs of four Planktothrix strains representing the
cylindrical shape of the filaments and the surface morphology of the different filament ends. A and B - P. agardhii (CHURRO10); C and D – P. rubescens (LMECYA203); E and F – P. pseudoagardhii (LMECYA162); G and H – P. mougeotii (LEGE 06226). The arrow indicates the calyptra in G and the necredia in H 58 Figure 3 Bayesian tree based on rpoC1 sequences of Planktothrix isolates in this study.
Sequences from GenBank are indicated with strain numbers. Planktothrix isolates are shown in bold letters 60 Figure 4 Planktothrix occurrence in Portuguese Lakes, based on observations of field
Pereira 2001, Pereira et al. 2001, Galvão et al. 2008; Valério et al. 2008; Paulino et al. 2009; Paulino et al. 2009a, Martins et al. 2010; Bellém et al. 2012; Galvão et al. 2012; Kurmayer et al. 2015, http://acoi.ci.uc.pt). WWTP – Waste Water Treatment Plant 61
CHAPTER 4
Figure 1 Information regarding the water reservoirs sampled during this study and their
schematic location. (---) Information not available 79 Figure 2 Comparison between average Ct values of 2-sets of 10-fold dilutions of the
same P. agardhii sample subjected to different DNA extraction methods (light grey - phenol-chloroform extraction; dark grey: mechanical treatment) based on predetermined cell concentrations for three P. agardhii strains (a) P. agardhii LMECYA 153B, (b) LMECYA 153C and (c) P. agardhii LMECYA 155. The bars represent the standard deviation. The * denotes the cell concentration that presents significant differences between Ct values for the two DNA extraction methods, t-student test, df = 4, P<0.05 80 Figure 3 Correlation between Ct values and log cell numbers from serial dilutions of DNA
extracts from P. agardhii strain LMECYA 153B 81 Figure 4 Correlation between optical light microscopy cell count numbers and real-time
qPCR estimative cell concentration for a serial 10-fold dilutions range between 79102 to 8 cells µL-1 of P. agardhii strain LMECYA 153B cells
82
CHAPTER 5
Figure 1 Diagram describing the method that was used for culture and field sample
preservation 96 Figure 2 Stability of the control samples. (A) Ct values and (B) DNA concentrations at
the time of preservation (0 M) and over a 6-month period (6 M). White bar – positive control, grey bar – control (filter with no treatment). The lines represent the standard deviation. No significant differences, Student’s t test, df = 4, p < 0.05 97 Figure 3 Migration of gDNA that was extracted from the preserved and control samples
in 0.6 % (w/v) agarose gel electrophoresis at 85 V in TBE buffer for 45 min. (1) Unpreserved sample – control; (2) 15 % Lugol’s-iodine-solution-preserved samples; (3) 4 % formaldehyde-preserved samples; and (4) 25 % glutaraldehyde-preserved samples. Ladder: GeneRuler™ DNA Ladder Mix (Fermentas) 100 Figure 4 Total genomic DNA that was extracted from short-term- (0 months – 0 M grey
Accessing Planktothrix species diversity and associated toxins using quantitative real-time PCR in natural waters
independent experiments - (A) Planktothrix agardhii strain LMECYA 153A, (B and C) P.
agardhii strain LMECYA 155. PC – positive control (no treatment), C – control (filter with
no treatment), L – 15 % Lugol’s iodine solution, F – 4 % formaldehyde, G – 25 % glutaraldehyde 101 Figure 5 Comparison between the average Ct values that were obtained from the
real-time amplification of non-preserved and preserved samples with 15 % Lugol’s iodine solution, 4 % formaldehyde and 25 % glutaraldehyde in recently and six-month-preserved samples in three independent experiments - (A) Planktothrix agardhii strain LMECYA 153A (189 692 cells/reaction) and (B and C) P. agardhii strain LMECYA 155 (92 698 and 60 828 cells/reaction, respectively). The asterisk denotes significant differences, Student’s t test, df = 4, p < 0.05, between the Ct values of the preserved samples and the Ct values of the control at the time of preservation. The lines represent the standard deviation 102 Figure 6 Sensitivity of the real-time PCR to target the rpoC1 gene in DNA that was
extracted from P. agardhii strain LMECYA 153A when preserved in 15 % Lugol’s iodine solution, 4 % formaldehyde and 25 % glutaraldehyde. The plotted bars represent the average Ct values of 5 serial 10-Logarithmic dilutions for each fixative solution. The lines represent the standard deviation 103 Figure 7 Gel image of conventional PCR showing the amplification of the rpoC1 gene
target sequence of the P. agardhii strain LMECYA 153A DNA that was extracted from (A) control samples and samples that were preserved with (B) 15 % Lugol’s iodine solution, (C) 4 % formaldehyde and (D) 25 % glutaraldehyde. Lanes 1 to 5 refer to the 5 serial 10-fold dilutions of template DNA equivalent to 379 384 to 38 cells/reaction. Ladder: GeneRuler™ DNA Ladder Mix (Fermentas); NTC: no-template control 104 Figure 8 Comparison of the average Ct values that were obtained from the real-time
amplification of environmental samples that were not preserved or preserved with 15 % Lugol’s iodine solution, 4 % formaldehyde and 25 % glutaraldehyde in recently (0 M) and six-month-(6 M) preserved samples. The asterisk denotes significant differences, Student’s t test, df = 4, p < 0.05, between the Ct values of the preserved samples and the Ct values of the control at the time of preservation. The lines represent the standard deviation 105
CHAPTER 6
Figure 1 Comparative graphical representation of the total genomic DNA concentration
culture experiments over time. Non-preserved samples – white bars; samples preserved in 100% methanol methanol (24 h preservation - dark grey; 6 months after – soft grey; 12, 18 and 24 months after – light grey). A – P. agardhii culture LMECYA 155; B - P.
agardhii culture LMECYA 153A; C - P. agardhii culture LMECYA 153B 122
Figure 2 Photograph of the electrophoresis gel showing the amplification of the rpoC1
gene target sequence in non-preserved and methanol preserved samples. Lanes 1 to 3
P. agardhii LMECYA 153A; lanes 4 to 6 P. agardhii LMECYA 153B. Lane 1 and 4 –
non-preserved sample; lane 2 and 5 – six months non-preserved samples; lane 3 – 18 months preserved sample; lane 6 – 24 months preserved sample. M – 1Kb plus DNA Ladder, Invitrogen™; ntc - no-template control 123 Figure 3 Average Ct values obtained from the real-time qPCR amplification of
non-preserved and methanol non-preserved samples in the three independent culture experiments. Non-preserved samples – white bars; samples preserved in 100% methanol – (24 h preservation - dark grey; 6 months after – soft grey; 12, 18 and 24 months after – light grey). A – P. agardhii culture LMECYA 155; B - P. agardhii culture LMECYA 153A; C - P. agardhii culture LMECYA 153B. The asterisk denotes significant differences, Student’s t test, df = 4, p < 0.05, between the Ct values of the preserved and non-preserved samples 125 Figure 4 Representative morphology of filaments in non-preserved and 24 h preserved
samples of P. agardhii – LMECYA 256: A - non-preserved sample; B - 100% methanol preserved sample; C - Lugols’s iodine preserved sample. Scale bar 5 µm, 1000x magnification 125 Figure 5 Total genomic DNA concentration (A) and average Ct values obtained from the
real-time PCR amplification of the rpoC1 fragment (B) in the environmental bloom sample. Non-preserved samples – white bars; samples preserved in 100% methanol – (24 h preservation - dark grey; 6 months after – soft grey; 12, 18 and 24 months after – light grey). The asterisk denotes significant differences, Student’s t test, df = 4, p < 0.05, between the Ct values of the preserved and non-preserved samples 127 Figure 6 Representative morphology of filaments from the bloom sample preserved in
100 % methanol for 24 months. A - P. agardhii culture (LMECYA 153B); B – P. agardhii from environmental sample. The arrow indicates the calyptra in P. agardhii apical cell. C to E – M. aeruginosa from environmental sample; D – Pseudoanabaena mucicola filaments inside a M. aeruginosa colony. Scale bar 5 µm, 1000x magnification 128
Accessing Planktothrix species diversity and associated toxins using quantitative real-time PCR in natural waters
CHAPTER 7
Cover Photo Planktothrix culture infected with a chytrid parasite 137
Figure 1 Planktothrix monitoring. A – Microscopy quantification of total cyanobacteria by
the Utermöhl technique (dark grey areas) and Planktothrix agardhii (light grey area); dashed line represents microcystin concentrations obtained by ELISA. B – rpoC1 gene copy numbers targeting P. agardhii obtained by real-time PCR (ligh grey bars); dashed line represents microcystin concentrations obtained by ELISA. C – microcystin syntethase gene (mcyA) targeting Planktothrix obtained by real-time PCR (light grey bars), dashed line represents microcystin concentrations obtained by ELISA. D - microcystin syntethase gene (mcyA) targeting microcystin producers obtained by real-time PCR (light grey bars), dashed line represents microcystin concentrations obtained by ELISA. E- 18s rDNA gene targeting chytrid parasites obtained by real-time PCR (light grey bars), dashed line represents microcystin concentrations obtained by ELISA 148 Figure 2 Nitrates concentration over the sampling period 149
CHAPTER 8
Cover photo Planktothrix agardhii bloom at Patudos Lake 161
APPENDIX A
Cover photo Microcystis aeruginosa colonies from a bloom at Agolada de Baixo Lake
October 2012 185
APPENDIX B
Cover photo Scums and foam at shoreline from a M. aeruginosa bloom at Magos Lake
October 2012. 199
Online Resource 2 Amplification curves by real-time PCR of serial 10-fold dilutions of
DNA extracts from P. agardhii 203
APPENDIX C
Cover photo Microcystis aeruginosa colonies from a bloom at Magos Lake October 2012. 205
ABREVIATIONS LIST
Ct – Threshold Cycle
CCALA – Acronym of cyanobacteria cultures from Culture Collection of Autotrophic Organisms
CREM - Centro de Recursos Microbiológicos
CIIMAR – Centro Interdisciplinar de Investigação Marinha e Ambiental. Interdisciplinary Centre of Marine and Environmental Research
DNA – Deoxyribonucleic acid
EDTA - Ethylenediamine tetraacetic acid ELISA – Enzyme-linked immunosorbent assay EN - European Standard
FCT – Fundação para a Ciência e Tecnologia/Foundation for Science and Technology. GV - Guideline Values
HPLC-DAD – High Performance Liquid Chromatography with Diode Array Detector ISO – International Organization for Standardization
LBE - Laboratory of Biology and Ecotoxicology
LC-MS/MS – Liquid Chromatography–Mass Spectrometry LD50% - Lethal Dose, the dose needed to kill 50%.
LEGE – Laboratório Ecotoxicologia Genomica e Evolução. Acronym of cyanobacteria cultures from Cianoteca LEGE culture collection
LM - Light Microscopy
LMECYA – Laboratório Microbiologia Experimental Cyanobacteria. Acronym of cyanobacteria cultures from the Estela Sousa e Silva algal culture collection
LOAEL – Lowest Observed Adverse Effect Level LPS – Lipopolysaccharide
Accessing Planktothrix species diversity and associated toxins using quantitative real-time PCR in natural waters
MC – Microcystin
MCMC – Markov Chain Monte Carlo NIH – National Institute of Health
NOAEL – No Observed Adverse Effect Level
NRPS – Non-Ribosomal Peptide Synthesis, involving peptide synthetases
NRPS/PKS – Non-Ribosomal Peptide Synthesis, involving peptide synthetases and polyketide synthases
NTC – No Template Control OD – Optical Density
PCR – Polymerase chain reaction PVPP - Polyvinypyrrolidone Qpcr – Quantitative PCR
RBA – Receptor Binding Assays RNA – Ribonucleic Acid
RT-qPCR – Reverse transcription quantitative polymerase chain reaction RuBisCO – ribulose 1,5-bisphosphate carboxylase-oxygenase
SDS - sodium dodecyl sulfate SEM – Scnaing Electron Microscopy STX - Saxitoxin
TBE - Tris-borate EDTA TNA - Taq Nuclease Assay TDI - Tolerable Daily Intake TE – Tris EDTA
Tris – (hydroxymethyl)aminomethane WHO – World Health Organization WWTP – Waste Water Treatment Plant
WATER
A transparent and odorless liquid formed simply by two atoms of hydrogen and one of oxygen is essential to sustain life. The increased thirst for water influenced human migration since the beginning of times and shaped human distribution and agglomeration. Water necessity as changed landscapes – see the case of the Aral Sea a 68,000 km2 that dried in 20 years. From the water that the earth contains approximately 96% is on the oceans and only 3% is fresh water1a. From these 3% about two-thirds is in glaciers and permanent ice cover1a. Believed to fall from the sky, water was taken for granted and one could not forecast the problems related with the need for water. Approximately 2300 people die per day from water related diseases; one child every minute and one in nine people lack access to safe water1b. With the increasing human population, anthropogenic and climate changes the water is becoming scarce and is no longer a common good.
“All people, whatever their stage of development and their social and economic conditions, have the right to have access to an adequate supply of safe drinking water.”1c
__________________________
1
Poster: Awareness campaign “Stop Global Warming”, Postal Free, Young & Rubicam Redcell, Corbis, PubliCards, ACT.
a http://water.usgs.gov/edu/earthwherewater.html b http://water.org c World Health Organization, Cyanobacterial
toxins: Microcystin-LR in Drinking-water, Guidelines for drinking-water quality 2nd ed. Health criteria and other supporting information, Geneva, 1998.
Accessing Planktothrix species diversity and associated toxins using quantitative real-time PCR in natural waters
“
Water
is the driving force of all nature”
Leonardo da Vinci
“No
water
, no life. No blue, no green”
Sylvia Earle
“Ocean, a body of
water
occupying about two-thirds of a world made for man —
who has no gills.”
Ambrose Bierce
“Thousands have lived without love, not one without
water
”
W. H. Auden
“We never know the worth of
water
till the well is dry.”
Thomas Fuller
“It is life, I think, to watch the
water
.
A man can learn so many things.”
Nicholas Sparks
“We forget that the
water
cycle and the life cycle are one.”
01_
Chapter
Accessing Planktothrix species diversity and associated toxins using quantitative real-time PCR in natural waters
The Organism_
Cyanobacterial Blooms
Cyanobacteria are an integral part of phytoplankton and primary production in aquatic systems. They are ubiquitous, well-adapted, microscopic oxygenic prokaryotic phototrophs. The adaptation ability that cyanobacteria possess dictates their success in the water column. These organisms require low light intensities and exhibit optimal growth rates at relatively high temperatures in comparison with other microalgae (Reynolds 1984, Paerl et al. 2011, Paerl & Paul 2012). They also have a higher ability to uptake nutrients, phosphorous and nitrogen, than for many other photosynthetic organisms (Paerl et al. 2011, Paerl & Paul 2012). They possess storage capacity for phosphorous and are capable of nitrogen fixation. This means that they can compete with other phytoplankton under conditions of nutrient limitation (Mur et al. 1999, Briand et al. 2003, Sunda et al. 2006). Their success is also due to the presence of gas vacuoles that provide buoyancy regulation in stratified waters. They can migrate in the water column and regulate their vertical position, accessing light in the surface layers and nutrients near the sediment (Mur et al. 1999, Paerl et al. 2011, Paerl & Paul 2012). They uptake CO2 efficiently and have high tolerance to UV radiation (Paerl & Paul 2012). Furthermore cyanobacteria also produce active substances that inhibit the growth algae competitors and grazers (Mur et al. 1999, Briand et al. 2003, Sunda et al. 2006, Apeldoorn et al. 2007). This robustness of cyanobacteria allows them to develop, dominate and persist in freshwater lakes. The development of cyanobacteria is, most of the times, excessive resulting in nuisance blooms. Cyanobacterial blooms have a negative impact in water ecosystems: i) they accumulate in the surface and restrict light penetration in the water, which can impair the growth of other phytoplankton, benthic microalgae and aquatic macrophytes: ii) they induce oxygen depletion and clogging of the fish gills, causing massive fish killing; iii) they produce secondary metabolites that are toxic for other organisms. In sum, cyanobacteria blooms decreases aquatic biodiversity and can disrupt the entire water ecosystem.
From a public health perspective, cyanobacteria are a health risk because they produce secondary metabolites that are harmful for humans that can be exposed
through drinking/recreational waters and through the food web due to toxin accumulation in aquatic animals.
Cyanobacterial Toxins
"A thick scum like green oil paint, some two to six inches thick unwholesome for cattle and other animals to drink at the surface, bringing on a rapid and sometimes terrible death" from Francis (1878) in Chorus & Salas (1997).
Cyanobacteria produce multiple toxic compounds that are grouped according to their primary target organ - hepatotoxins, neurotoxins, cytotoxins and lipopolysaccharide endotoxins. Detailed information about cyanobacteria toxins, such as, the types of toxins, the producer species, the effects and lethal doses can be found in Chapter 2. Microcystin is one of the most common cyanotoxins found in freshwaters. It is a hepatotoxin and it has over 100 variants that differ in structure and toxicity (Tonk et al. 2005, Welker & Döhren 2006, del Campo & Quahid 2010, Bortoli & Volmer 2014; Qi et al. 2015). Microcystins are produced by several bloom forming cyanobacteria such as:
Microcystis, Planktothrix, Anabaena, Hapalosiphon, Phormidium and Nostoc (Haider et
al. 2003, Oksanen et al. 2004, Codd et al. 2005, Quiblier et al. 2013). The most severe case of human intoxication by microcystins took place in Caruaru, Brazil, which resulted in 60 deaths in patients from a hemodialysis unit (Pouria et al. 1998, Jochimsen et al. 1998). In China (Ueno et al. 1996) and recently in Serbia (Damjana et al. 2011) the high incidence of primary liver cancer has also been attributed to microcystins-contaminated drinking water. More recently, Ohio, in USA, was declared a state of emergency as a result of elevated levels of microcystins in tap water (Jetoo et al. 2015). An advisory “do not drink” was imposed for 3 days, to the population, which became known as the “Toledo water crisis” (Jetoo et al. 2015).
Therefore, cyanobacterial blooms and their toxins represent a serious threat to human health and to the quality and sustainability of freshwater resources through contamination of water supplies.
Cyanobacteria in Portugal
Cyanobacterial blooms are frequent worldwide and Portuguese inland waters are no exception, with toxic blooms being a recurrent phenomenon (Vasconcelos 1999) (Fig.1). Blooms have been reported throughout the country (Vasconcelos 1999, Caetano et al. 2001, Saker et al. 2004, Pereira et al. 2004, Teles et al. 2006, Galvão et al. 2008, Figueiredo et al. 2010, Vasconcelos et al. 2011, Bellém et al. 2013). The
Accessing Planktothrix species diversity and associated toxins using quantitative real-time PCR in natural waters
species accounting for most of the blooms and toxic events in Portugal are
Dolichospermum (former Anabaena), Aphanizomenon, Cylindrospermopsis,
Microcystis and Planktothrix (Saker et al. 2004, Figueiredo et al. 2006, Pereira et al.
2004, Vasconcelos 1999, Churro et al. 2012 – Chapter 2). Furthermore, most cyanobacterial toxins have also been detected in those blooms or in cultured strains isolated from natural samples, such as microcystins (Vasconcelos et al. 1995; 1996), saxitoxins (Pereira et al. 2000; 2004, Ferreira et al. 2001) and anatoxin (Osswald et al. 2009).
Fig. 1 - Cyanobacteria blooms in Portuguese lakes. A – Fish mortality in Patudos lake undergoing a cyanobacterial bloom (source: Publico newspaper by Marisa Soares, September 9th, 2014); B – Aphanizomenon bloom in central Portugal, May 2015; C – Planktothrix bloom in Roxo Lake, September 2005; D – Aphanizomenon and Microcystis bloom in Alvito Lake, September 2005; E – Microcystis bloom in Magos Lake, October 2012; F – Planktothrix bloom in Patudos Lake, October 2012.
Planktothrix
Planktothrix is one of the most widespread bloom forming cyanobacteria genera in
Europe (Fig. 2). From the fourteen species described, four - Planktothrix agardhii, P.
rubescens, P. prolifica and P. suspensa - have been reported to cause toxic blooms. P. agardhii and P. rubescens are the most commonly reported species and are both
P. agardhii is frequently found in shallow eutrophic to hypereutrophic lakes all across
middle Europe. In France is one of the most frequently found species (Catherine et al. 2008) and was also found as a dominant species in 40% of Czech fishponds (Poulícková et al. 2004). Toxic blooms are also common in Poland, Hungary and Germany (Budzyńska et al. 2009, Pawlik-Skowroμska et al. 2008, Farkas et al. 2014). This cyanobacterium tolerates a wide range of temperatures and light intensities so it can prevail all year around. It is generally mixed in the water but it can also form metalimnetic blooms, survive under ice-covered lakes and tolerate shade from other phytoplankton under eutrophic conditions (Rücker et al. 1997, Hašler and Poulícková 2003, Halstvedt et al. 2007, Pawlik-Skowroμska et al. 2008, Bonilla et al. 2012).
P. rubescens is found in deep meso to oligotrophic lakes, all across the north and
midle European lakes especially in alpine Lakes (Legnani et al. 2005, Halstvedt et al. 2007, Bogialli et al. 2012). This species has the ability to grow at low irradiances, tolerates lower temperatures and have stronger gas vacuoles when compared to other cyanobacteria, so this species usually forms perennial and metalimnetic blooms (Walsby et al. 1998, Walsby and Schanz 2002, Akçaalan et al. 2014). However, P.
rubescens blooms can also occur in eutrophic lakes since concentration of
phytoplankton in the upper water layer increases the light attenuation (Walsby and Schanz 2002). Furthermore, a shallow lake dominated by P. rubescens was reported in Hungary (Vasas et al. 2013).
P. agardhii and P. rubescens occupy different ecological niches and experiments have
showed that some strains segregate each other (Oberhaus et al. 2008). Nevertheless, although rare, there are some reports on the co-occurrence of these species (Davis and Walsby 2002, Halstvedt et al. 2007, Oberhaus et al. 2008). In Lake Steinsfjorden, southeastern Norway P. rubescens and P. agardhii, had similar depth distributions and both formed metalimnetic blooms (Halstvedt et al. 2007). In addition, Fastner et al. (1999) reported that Planktothrix blooms produce the highest level of toxins per biomass when compared to Microcystis and Anabaena and that P. rubescens is more toxic then P. agardhii (Fastner et al., 1999, Akçaalan et al. 2006).
In Portugal, P. agardhii and P. rubescens have been pointed out to cause blooms associated with microcystin production (Churro et al. 2012 – Chapter 2, Paulino et al. 2009). However little is known about the occurrence, distribution and toxin production of these harmful bloom-forming cyanbacteria in southwest European lakes and in particular, in Portugal (Fig. 2).
Accessing Planktothrix species diversity and associated toxins using quantitative real-time PCR in natural waters
Fig. 2 - Occurrence and distribution of Planktothrix in European Lakes. The arrow indicates the co-occurrence of P.
agardhii and P. rubescens. (Rojo and Cobelas 1994; Montealegre et al. 1995; Rücker et al. 1997; Rudi et al 1998;
Lindholm et al. 1999; Bettinetti et al. 2000; Salmaso 2000; Bright & Walsby 2000; Davis & Walsby 2002; Buzzi 2002, Morabito et al. 2002, Viaggiu et al. 2003,Davis et al. 2003; PoulíČková et al. 2004; Almodóvar et al. 2004; Barco et al. 2004; Kurmayer et al. 2004, Hoyos et al 2004; Viaggiu et al. 2004; Briand et al. 2005; Nõges & Kangro 2005; Kangro et al. 2005, Briand et al. 2005, Jacquet et al. 2005, Rudi et al. 2005, Mbedi et al 2005; Legnani et al. 2005; Stefaniak et al. 2005, Messineo et al. 2006; Akcaalan et al. 2006; Kurmayer & Gumpenberger 2006; Yéprémian et al. 2007, Halstved et al. 2007; Honti et al. 2007; Naselli-Flores et al. 2007; Catherine et al. 2008; Baumann and Juttner 2008; Vareli et al. 2009; Ernst et al. 2009; Budzyńska et al. 2009; Paulino et al. 2009; Manganelli et al. 2010; Salmaso 2010; Kormas et al. 2011; Al-Tebrineh et al. 2011; D’Alelio et al. 2011; D’Alelio and Salmaso 2011; Mankiewicz-Boczek et al. 2011; Bogialli et al. 2012; Messyasz et al. 2012; Vasas et al. 2013; Akçaalan et al. 2014; Grabowska and Mazur-Marzec 2014; Larson et al. 2014; Kurmayer et al. 2015, NIVA Culture Collection of Algae Catalog).
Cyanobacteria and cyanotoxins monitoring
After the Caruaru incident most countries became aware of the risks posed by the contamination of drinking water with toxic cyanobacteria. Consequently, many implemented regulatory programs and guidelines for the monitoring of cyanobacteria and cyanotoxins, particularly microcystins (see Chapter 2). Cyanobacteria are identified by optical microscopy, using classical taxonomy based on morphological features. The cell quantification is determined by counting individual cells in
sedimentation chambers using the Utermöhl method (Lund et al. 1958). This process is highly dependent on the operator’s extensive knowledge of taxonomy, which ensures a correct identification of the species. Furthermore, some cyanobacterial species are difficult to distinguish, even for an experienced taxonomist, and sometimes it is also difficult to distinguish the limits between cells, which compromise the correct determination of cell densities. This is an important aspect because the cyanobacterial concentration is a parameter used to define the guideline levels.
The detection and quantification of many cyanotoxins (microcystin, cylindrospermopsin, anatoxin and saxitoxin) can be done using enzyme-linked immunosorbent assay (ELISA) (An & Carmichael 1994), receptor binding assays (RBA) (Rubio et al. 2014) and protein phosphatase inhibition assay (PPIA) (An & Carmichael 1994, Metacalf et al. 2001). These assays are based in the recognition and binding of the toxins to specific antibodies or receptors. These methods are fast and sensitive but nonspecific reactions may occur leading to an overestimation of the amount of toxin (Merel et al. 2013). The high-performance liquid chromatography (HPLC) and liquid chromatography–mass spectrometry (LC-MS/MS) enables in-depth study of toxins and its variants (Lawton et al. 1994, Draper et al. 2013, Guzmán-Guillén et al. 2012, Sanchez et al. 2014). However these methods require extensive processing of the sample and standards for each specific toxin and/or variants (Merel et al. 2013, Metcalf and Codd 2014).
Genetic base of microcystin production
Microcystins are cyclic peptides that are assembled non-ribosomically by peptide synthetases (NRPS) and polyketide synthases (NRPS/PKS) coded by nine to eleven genes organized in a cluster named mcy (Welker and Döhren 2006) (Fig. 3). The mcy gene clusters are large in size, have approximately 48 to 57 kb, and were already sequenced in the cyanobacteria Microcystis (Tillett et al. 2000), Planktothrix (Christiansen et al. 2003), Anabaena (Rouhiainen et al. 2004) and Nostoc (Fewer et al. 2013). The Planktothrix mcy gene cluster is the one that possesses major differences in its organization when compared to the other three genera, lacking the genes coding for an aspartate racemase and a dehydrogenase (mcyI and F) and having the mcyT that encodes a putative thioesterase which is only found in this genus (Christiansen et al. 2003, Kurmayer and Christiansen, 2009) (Fig.3). The organization of mcy genes also differs between genera. In Microcystis, Anabaena and Nostoc the genes are transcribed bidirectional from a central promoter region, while almost all the genes in
Accessing Planktothrix species diversity and associated toxins using quantitative real-time PCR in natural waters
the genus Planktothrix are unidirectional transcribed from a promoter located upstream of the gene mcyD (Christiansen et al. 2003, Kurmayer and Christiansen 2009).
Fig. 3 - Representation of the microcystin synthetase gene cluster (mcy) in Planktothrix (Christiansen et al. 2003),
Microcystis (Tillett et al. 2000), Anabaena (Rouhiainen et al. 2004) and Nostoc (Fewer et al. 2013). Adapted from Kurmayer and Christiansen (2009) and Fewer et al. (2013). The arrows indicate the transcription direction.
The Method_
Real-time PCR
Real-time Polymerase Chain Reaction (Real-time PCR) is similar to a conventional PCR with the exception that the progress of the reaction is monitored as it occurs, meaning, in “real-time” (Heid et al. 1996). The data is collected, through fluorescence, during the DNA fragment amplification at each cycle, rather than at the end of the reaction when the amount of fragments accumulates. This means that by monitoring the PCR reaction it is possible to quantify the initial number of copies of the target fragment since the amplification is exponential. Furthermore, the technique is highly sensitive and can be tailored according to the desired specificity that is determined by primer and probe target sequence. These primers and probes can be designed either for specific DNA sequences or for conserved regions. Since the reaction is performed in a closed vessel reaction and all the PCR reagents can be bought together in a mastermix, and since, there is no need of post handling of PCR products, this technique is less prone to contaminations (Espy et al. 2006).
There are several fluorophores that can be used in real-time PCR, the most common are Intercalating fluorescent dyes – SYBR green - and fluorescent probes - Taqman. The SYBR green dye emits fluorescence when intercalates with dsDNA
(Fig. 4). The Taqman probes are DNA sequences complementary of the target fragment, labeled with a fluorescent reporter dye at one end and a quencher dye at the other. When the Taq polymerase cleaves the 5’ end of the probe releases the reporter dye that emits fluorescence (Fig. 4).
Fig. 4 - Mode of action of the fluorophores used in real-time PCR, SYBR Green and TaqMan assays. R – reporter, Q – quencher.
For the past two decades the real-time PCR technique has been used across multiple fields of biological research and is nowadays broadly applied in routine monitoring and diagnostics. It is commonly used in the quantification of viral and bacterial loads (Mackay et al. 2002, Maurin 2012), food authentication (Mafra et al. 2008), detection of genetically modified organisms (Lin and Pan in press), food (Postollec et al. 2011) and water (Ramírez-Castillo et al. 2015) borne pathogens.
Likewise, in cyanobacteria research the real-time qPCR has proved useful in studies involving cyanobacteria population dynamics and distribution permitting gene quantification in environmental communities (Kurmayer and Kutzenberger 2003, Rantala et al. 2006, Hoto et al. 2008, Davis et al. 2009, Tai and Palenik 2009, Orr et al. 2010). Tailored real-time qPCR reactions have been developed for the detection and quantification of genotypes related to several toxins, such as, microcystins (Furukawa et al. 2006, Al-Tebrineh et al. 2011, Baxa et al. 2010, Hautala et al. 2013), nodularins (Koskenniemi et al. 2007, Al-Tebrineh et al. 2011), cylindrospermopsin (Rasmussen et al. 2008, Marbun et al. 2012, Orr et al. 2010), saxitoxin (Al-Tebrineh et al. 2010) and multiplex real-time PCR targeting genes involved in the production of the previously mentioned toxins (Al-Tebrineh et al. 2012). Protocols have also been developed for the
Accessing Planktothrix species diversity and associated toxins using quantitative real-time PCR in natural waters
detection and quantification of potentially toxic cyanobacteria species, such as,
Microcystis (Baker et al. 2002, Baxa et al. 2010), Anabena (Baker et al. 2002, Rueckert
et al. 2007, Al-Tebrineh et al. 2010), Cylindrospermopsis (Rasmussen et al. 2008, Orr et al. 2010) and Planktothrix (Schober & Kurmayer 2006, Ostermaier and Kurmayer 2009). Furthermore, studies using real-time PCR are applied in quantification of nucleotide variations responsible for microcystin variants (Ostermaier and Kurmayer 2010), non-toxic mutants caring microcystin related genes (Ostermaier and Kurmayer 2009) and detection of cyanobacteria genes from sediments (Savichtcheva et al. 2011, 2015, Kyle et al. 2015). The aforementioned quantitative real-time PCR assays are robust, reliable and sensitive, with low gene copy number detection limits. These studies showed promising results in the simplification of cyanobacteria identification and enumeration for routine monitoring programs (Pearson and Neilan 2008, Humbert et al. 2010, Martins and Vasconcelos 2011). The characteristics of the real-time PCR make it an appealing tool for cyanobacteria research and monitoring, although, is not yet applied in monitoring.
The Aims_
The main objective of this thesis was to develop a qPCR technique applied to cyanobacteria monitoring, focused in the Planktothrix species. The specific goals of this study were:
1.
To develop a protocol for the specific detection and quantification of the commonly found Planktothrix agardhii, thus contributing for the simplification of common cell counting procedures;2.
To test the applicability of the real-time PCR in the amplification of target DNA from preserved samples, which can be useful in retrospective analyses of samples;3.
To monitor through real-time PCR the Planktothrix agardhii in environmental samples;4.
To increase the knowledge on the occurrence, toxin production and bloom dynamics of Planktothrix in Portuguese inland waters.02_
This chapter was published as book chapter in:
Catarina Churro, Elsa Dias and Elisabete Valério (2012). Risk Assessment of Cyanobacteria and Cyanotoxins, the Particularities and Challenges of Planktothrix spp. Monitoring, Novel Approaches and Their Applications in Risk Assessment, Dr. Yuzhou Luo (Ed.), ISBN: 978-953-51-0519-0, InTech, DOI: 10.5772/37910
Accessing Planktothrix species diversity and associated toxins using quantitative real-time PCR in natural waters
RISK ASSESSMENT OF CYANOBACTERIA AND
CYANOTOXINS, THE PARTICULARITIES AND
CHALLENGES
OF
PLANKTOTHRIX
SPP.
MONITORING
Catarina Churro1,2, Elsa Dias1, Elisabete Valério2
1 Laboratório de Biologia e Ecotoxicologia, Departamento de Saúde Ambiental, Instituto Nacional de Saúde Dr. Ricardo
Jorge. Avenida Padre Cruz, 1649-016 Lisboa, Portugal.
2 Centro de Recursos Microbiológicos (CREM), Faculdade de Ciências e Tecnologia, Universidade Nova de Lisboa.
Quinta da Torre 2829-516 Caparica, Portugal.
Introduction
Cyanobacteria are a diverse well-adapted group of organisms that presents amazing morphological diversity. Cyanobacteria can be unicellular or colonial (filamentous, spherical or amorphous) (Fig. 1). Since cyanobacteria have cells larger than normal bacterial cells and behavior more similar to algae; they were classified under the microalgae for a long time and acquire the name of blue-green algae or Cyanophyta (Whitton & Potts 2000). Cyanobacteria are a phylum of bacteria that obtain their energy through photosynthesis. The name "cyanobacteria" comes from their coloration (cyano = blue). The vegetative cell wall is of Gram-negative type and in some species the peptidoglycan layer is considerably thicker than in other bacteria. Many unicellular and filamentous cyanobacteria possess an “envelope” outside the lipopolysaccharide (LPS) “outer membrane”, which is called: sheath, glycocalyx, or capsule, and depending on the consistency, gel, mucilage or slime. The sheaths of cyanobacteria are predominantly polysaccharide, but a part of its weight may be polypeptides, and depending on the species, some types of sugar residues may be involved (Castenholz, 2001). Cyanobacteria are autotrophs and possess all the photosynthetic pigment (chlorophyll a, carotenoids, allophycocyanin, phycobilins, phycoeritrins) except chlorophyll b (Castenholz, 2001). Prochlorophytes are also cyanobacteria that contain chlorophyll a and b, but, opposing to other cyanobacteria, lack phycobiliproteins (Castenholz, 2001). Cyanobacteria have the ability to use low light intensities effectively, since they are able to produce the accessory pigments needed to adsorb light most efficiently in the habitat in which they are present, providing them a great advantage for the colonization of a wide range of ecological niches (van den Hoek et al., 1995; WHO, 1999).
Fig. 1 - Optical microscopy photographs of cyanobacteria presenting different morphologies. The arrow indicates the heterocyst cell in Anabena circinalis.
Phycobiliprotein synthesis is particularly susceptible to environmental influences, especially light quality. The chromatic adaptation is largely attributable to a change in the ratio between phycocyanin and phycoerythrin in the phycobilisomes. The photosynthetic pigments are located in thylakoids that are free in the cytoplasm near the cell periphery (Fig. 2). Cell colors vary from blue-green to violet-red due to the chlorophyll a masking by the carotenoids and accessory pigments. The pigments are involved in phycobilisomes, which are found in rows on the outer surface of the thylakoids (Fig. 2) (WHO, 1999).
Fig. 2 - Cyanobacteria cell structure. (A)Transmission electron micrographs showing the ultrastructure of an Anabena
circinalis vegetative cell; (B) Schematic diagram of a cyanobacterial vegetative cell. S: external 4-layered cell wall; OM:
outer membrane; PL: peptidoglycan layer; CM: cytoplasmic membrane; CW: cell wall; E: cell envelope; TH: thylakoid; PB: phycobilisome; CY: cytoplasm; GV: gas vesicle; GG: glycogen granules; N: nucleoplasmic region; C: carboxysome; PP: polyphosphate granule; CP: cyanophycin granule; LP: lipid droplets (adapted from van den Hoek et al., 1995; Castenholz, 2001).
Cyanobacteria are also able of storing essential nutrients and metabolites within their cytoplasm. Prominent cytoplasmic inclusions such as glycogen and cyanophycin granules (polymers of the amino acids arginine and asparagine), polyphosphate bodies, carboxysomes (containing the primary enzyme for photosynthetic CO2 fixation, ribulose 1,5-bisphosphate carboxylase-oxygenase: RuBisCO) and gas vacuoles (Fig. 2) can be observed by electron microscopy. The occurrence of fimbriae (pili) is abundant in many cyanobacteria with varying patterns. Some filamentous forms are also able of gliding (sliding) (van den Hoek et al., 1995; WHO, 1999; Castenholz,
Accessing Planktothrix species diversity and associated toxins using quantitative real-time PCR in natural waters
2001). Cyanobacteria can be found in the most diverse environments like hot springs, salt marshes, soils, fresh, brackish, and marine waters (Sze, 1986). In sum, cyanobacteria are ubiquitous oxygenic photosynthetic prokaryotes.
Why the surveillance on Cyanobacteria?
Cyanobacteria are common constituents of the phytoplankton in aquatic environments. In optimal conditions these phytoplankton’s can develop massively and form blooms, becoming the dominant organism in the water column and creating serious problems in water quality (Cood, 2000; Vasconcelos, 2006). The water quality deterioration produced by cyanobacterial blooms includes foul odors and tastes, deoxygenation of bottom waters (hypoxia and anoxia), fish kills, food web alterations and toxicity. Other threatening characteristic of these organisms is their ability to produce toxins that affects other living organisms and humans (Carmichael, 2001). The capacity of mass development together with the ability to produce potent toxins enlightens the importance of implementing regular monitoring programs for cyanobacteria and cyanotoxins in freshwater environments, in order to minimize potential health risks to animal and human populations that results from exposure through drinking and recreational activities. The implementation of surveillance programs on cyanobacteria involves understanding the ecophysiology of cyanobacteria, bloom dynamics, conditions that promote blooms, production of toxins and their impact in human and animal health (McPhail & Jarema, 2005). Cyanobacteria possess some ecostrategies that allows them to overcome other organism and become dominant. In general there are four constraints on cyanobacteria growth as pre-requisites for bloom enhancement: light, nutrients, temperature and stability of the water column. Cyanobacteria require low light intensities for growth, compared with algae, which provides competitive advantages in lakes which are turbid due to growth of other phytoplankton. They also have a higher affinity for uptake phosphorous and nitrogen than many other photosynthetic organisms and they have a substantial storage capacity for phosphorous (Mur et al., 1999). Some genera like Anabaena, Aphanizomenon,
Cylindrospermopsis, Nodularia and Nostoc have specialized cells (heterocysts) (Fig. 1)
for nitrogen fixation and blooms of these genera can often be related with periodic nitrogen limitation. This means that they can compete other phytoplankton under conditions of phosphorous and nitrogen limitation (Briand et al., 2003; Sunda et al., 2006). The success of some cyanobacteria is also due to the presence of gas vacuoles that provide buoyancy regulation. During water stratification conditions cyanobacteria can migrate in the water column, accessing light in the surface layers and nutrients