CULTURE AND PROFITABILITY: EMPIRICAL
EVIDENCE AT A EUROPEAN LEVEL
! " # $ % ! & ' ( )$*+ , - , . / & 0 , 1 # & 2
3 4 55 67 8 9:8 ; < => ?@9A = 8 9B C8 D9:97 96 E 8 :F =@D:9G@:6 H = I :DJ 6 ? KCL M N O PQR S TU V W R PQR S U X Y Z[\ ] ^ _
Organizational cultures distinguish different organizations within the same country or countries. When comparing the organizations within the same country differences in national cultures are not relevant but become relevant in comparison between different countries. This paper intends to evidence whether the profitability of companies can be influenced by the national culture. In order to characterize the culture of each country, we used the Hofstede measure of cultural dimensions (1. Power Distance (PDI); 2. Uncertainty Avoidance (UAI); 3. Individualism (IDV); 4. Masculinity (MAS); 5. Long-Term Orientation (LTO); and 6. Indulgence vs Restraint (IND)). Sample was based on the 500 largest European companies rated by the Financial Times 2015. Profitability was measured by the ratios Return on Assets (ROA) and Return on Equity (ROE). Statistical tests were performed to test whether the means of the variables used to measure profitability are statistically equal. The results indicate that companies with higher profitability are from countries with lower Power Distance, lower Uncertainty Avoidance, Long-Term Orientation, and Higher Indulgence.
Culture, Cultural Dimension, National Culture, Profitability
Cultural differences between nations are reflected mainly in their values. Differences in culture have considerable influence on both the personal and corporate domains of society. In organizations, cultural differences are noted primarily in their practices and have been recognized as one of the most influential factors when considering organizational performance. In this scope, Sagiv and Schwartz (2007) concluded in their research that company’s values are more important than those of market forces. This improved importance of culture for researchers in organisational studies has become a source in the development of different theories, frameworks and models in order to clarifying organizational culture.
The relationship between organizational culture and performance has been underlined by several authors, such as Rousseau (1990), Kotter and Heskett (1992), Marcoulides and Heck (1993), Ogbonna and Harris (2000), Ehtesham et al. (2011), and Ahmad (2012)). Furthermore, national culture is another important consideration due to its deeply rooted connection with values, rooted in our daily life. The changes in national values are a matter of generation power; cultural values are part of our daily life. Similarly behaviour is produced by the adopted cultural values. Therefore, it is appropriate to say that national values have an impact on organizational culture as well. Hofstede (1991) states that behaviour at work is a continuation of behaviour learned earlier. Some managers have realized that any organization also has its own corporate culture. Thus, cultural values strongly affect all who are involved in the organization. Those values are almost invisible, but if we would
like to improve performance and profitability, cultural values are the first question to be considered. Several papers have underlined the influence of culture on finance. Stulz and Williamson (2003) have demonstrated the effect of national culture on protection of creditor rights.
This paper aims to investigate the association between the national culture and the profitability of European companies. We focus on the role of national culture in explaining cross-country differences in profitability. There is considerable empirical support for the importance of country-level variables such as creditor rights and financial structure and firm-level variables such as firm size as determinants of profitability around the world (see, for example, Cho et al., 2014; Ozgulbas et al., 2006). In this paper, we introduce the cultural variable and we pretend to know that there is an association between each of the six dimensions of culture defined by Hofstede (2010) and the profitability.
It is organized as follows. Next section addresses the prior research and hypotheses while Section 3 describes the methodology and methods used in the research. Section 4 is dedicated to empirical results and discussion while final remarks and expected future outcomes are stated in the last section.
One of the more important questions in management has been why some organizations are well succeeded while others failed. It has been essential for managers to know which factors influence the organization’s performance in order for to implement the appropriate strategies. Cohen
et al. (1992) provide a framework for the examination of cultural and socioeconomic factors that could impede the acceptance and implementation of a profession's international code of conduct. Han et al. (2010) have studied whether the degree in which managers exercise earnings discretion relates to their culture, as well as the institutional features of their country. They found that Uncertainty Avoidance and Individualism dimensions of national culture explain managers’ earnings discretion across countries and that this association varies with the strength of investor protection code of conduct. With a growing interest in how different cultural backgrounds affect markets, Curtis et al. (2012) have examined the impact of national culture on ethical decision making. To understand and to predict the behaviour of individuals with different cultural roots should lead not only to changes in the organizational structure but also change the practices in the world market. Probably these changes and practices will lead to more efficient and effective business practices (Curtis et al., 2012).
Chan and Cheung (2012) examines the differences in corporate governance practices in firms across different countries using the concept of ethical sensitivity and found that Hofstede’s cultural dimensions can explain the differences in corporate governance practices. Furthermore, the results demonstrate the influence of culture on ethical sensitivity, which eventually determines the corporate governance practices in different regions. In essence, organisational practices are based on culture and most organisations avoid cultural risks to manage their businesses (Kanungo, 2006). Differences in culture comprise an important subject in the management area. Such differences affect almost every aspect of business particularly the strategic and organizational aspects.
Hofstede (1991) initially developed four dimensions of culture values, namely Power
Distance, uncertainty avoidance, Individualism
versus Collectivism and Masculinity versus
Femininity; and later added two dimensions, long
term versus short term orientation and Indulgence versus Restraint. Since then, researchers have used the Hofstede’s measures to evaluate the different dimensions of a society’s culture. Those measures have not been free from criticism and are definitely not exact or perfect measures of culture. However, it is fair to say that they have become the support of study of culture and their differences. This study has adopted the Hofstede’s model once it is seen as the one that accurately fits with culture. Thus, it internationally used in a wide variety of empirical studies (Kirkmanet al. 2006). The model integrates several dimensions, namely:
· Power Distance - The extent to which the
less powerful members of an organization accept that power is unequally distributed. It suggests that a society's level of inequality is endorsed by the followers as much as by the leaders. Power and inequality are extremely fundamental facts of any society and anybody with some international experience will be aware that all societies are unequal, but some are more unequal than others.
· Uncertainty avoidance - The extent to which
people feel threatened by ambiguous situations and
avoid. The fundamental issue here is how a society deals with the fact that the future can never be known: should we try to control the future or just let it happen? Countries exhibiting strong UAI maintain rigid codes of beliefs and behaviours, and are intolerant of unorthodox behaviour and ideas. They are usually countries with a long history, the population is not multicultural, i.e. homogenous, risks, even calculated, are avoided in business and new ideas and concepts are more difficult to introduce People in Uncertainty Avoidance countries are also more emotional, and motivated by inner nervous energy. Weak UAI societies maintain a more relaxed attitude in which practice counts more than principles. Some of the common traits found in countries that score low on the Uncertainty
Avoidance scale are usually a country with a young
history, the population is much more diverse due to waves of immigration, risk is embraced as part of business and innovation and pushing boundaries is encouraged. People are more tolerant of opinions different from what they are used to; they try to have as few rules as possible, and on the philosophical and religious level they are relativist and allow many currents to flow side by side, are more phlegmatic and contemplative, and not expected by their environment to express emotions. · Individualism – Individualism versus
Collectivism. It embodies the degree to which
individuals are integrated into groups. This dimension reflects an ethnic position of the culture, in which people are supposed to look after themselves and their immediate families, or a situation in which people belong to groups or collectives which are supposed to look after them in exchange for loyalty. A society's position on this dimension is reflected in whether people’s self-image is defined in terms of “I” or “we”. On the individualist side we find societies in which the ties between individuals are loose, a person's identity revolves around the "I". It is acceptable to pursue individual goals at the expense of others.
Individualism is encouraged whether it is personality, clothes or music tastes. On the collectivist side, we find societies in which people from birth onwards are integrated into strong, cohesive in-groups which continue protecting them in exchange for unquestioning loyalty, "We" is more important that "I", conformity is expected and perceived positively, Individual's desires and aspirations should be limited if necessary for the good of the group, the rights of the family are more important, rules provide stability, order and obedience.
· Masculinity - Masculinity versus Femininity.
It refers to the distribution of emotional roles between the genders which is another fundamental issue for any society to which a range of solutions are found. The Masculinity side of this dimension represents a preference in society for achievement, heroism, assertiveness and material rewards for success. Society at large is more competitive. Its opposite, Femininity, stands for a preference for cooperation, modesty, caring for the weak and quality of life. Society at large is more consensus-oriented. In the business context Masculinity versus
Femininity is sometimes also related to as "tough
achievement, wealth and expansion, it is acceptable to settle conflicts through aggressive means, women and men have different roles in society and professionals often "live to work", meaning longer work hours and short vacations. In countries that score low on the Masculinity in life the main priorities are the family, relationships and quality of life, conflicts should ideally be solved through negotiation, men and women should share equal positions in society and professionals "work to live", meaning longer vacations and flexible working hours
· Long-Term Orientation - Long-term oriented
societies promotes pragmatic virtues oriented towards future rewards, in particular thrift, persistence, and adapting to changing circumstances. Short-term oriented societies promotes virtues related to the past and present such as national pride, respect for tradition, preservation of "face", and fulfilling social obligations. Countries that score low on this dimension prefer to maintain time-honoured traditions and norms while viewing societal change with suspicion. Those with a culture which scores high take a more pragmatic approach: they encourage thrift and efforts in modern education as a way to prepare for the future. In the business context this dimension is related to as normative (short term) versus pragmatic (long term) ".
· Indulgence versus Restraint - Indulgence
stands for a society that allows relatively free gratification of basic and natural human drives related to enjoying life and having fun. Restraint stands for a society that suppresses gratification of needs and regulates it by means of strict social norms.
Table 1 evidences the six dimensions of national culture values and the consequences of each dimension to organizations. According to Blaško et al. (2000), cross-border mergers are more difficult and trickier to manage than domestic mergers due to divergences in corporate culture, reward systems and organizational structures, which are influenced by the national culture.
Taylor and Wilson (2012) analyses several independent datasets of culture and innovation from 62 countries and confirm that high-levels of cultural Individualism correlate with national innovation rates, implying that Individualism generally helps, and Collectivism generally damage, rates of technology patenting and scientific research publication.
The researches of Gerecke and House (2013) examined the demographic characteristics of the 57 TMTs, in the 2006 Fortune Global 500 banking sector, relative to their companies’ change in return-on-assets from 2007 through 2009.Changes in corporate profitability during this period were found to be significantly correlated with Hofstede’s national culture dimensions of LTO (+), IDV (-) and MAS (-).
Lievenbrück and Schmid (2013) examine whether cultural differences between countries help in explaining firms' hedging decisions. The analysis reveals a strong impact of a country's Long-Term
Orientation, which reduces the probability for
hedging and the hedged volume. Moreover, hedging
with options is less common in countries with a high level of Masculinity. Overall, the results reveal that culture has a strong impact on the hedging behaviour of firms.
Shao et al. (2013) find that Individualism is positively associated with firms’ risk taking behaviours, the firms in individualistic countries invest more in long-term (risky) than in short-term (safe) assets.
Griffin et al. (2015) examined why corporate governance varies widely across countries and across firms, and why such variation matters and find that the national cultural dimension of
Individualism is positively associated with, whereas
the national cultural dimension of Uncertainty
Avoidance is negatively associated with, firm-level
corporate governance practices.
Ahem et al. (2015) find strong evidence that three key dimensions of national culture (trust, hierarchy, and Individualism) affect merger volume and synergy gains. The volume of cross-border mergers is lower when countries are more culturally distant. In addition, greater cultural distance in trust and Individualism leads to lower combined announcement returns.
Using three of Hofstede’s cultural value dimensions (Individualism, Long-Term Orientation, and Indulgence) Shi and Veenstra (2015) investigates how firm financial performance is affected by corporate social performance initiatives and national cultural values and find that the interactions between corporate social performance measures and Individualism/Indulgence negatively affect firm value whereas the interactions between corporate social performance measures and
Long-Term Orientation positively impact firm value.
Based on the assumptions that culture can influence companies’ performance indicators, we formulate our hypotheses as follows:
H1: Companies from countries with higher
Power Distance has a different profitability of
companies from countries with lower Power
Distance.
H2: Companies from countries with higher
Uncertainty Avoidance has a different profitability
of companies from countries with lower Uncertainty
Avoidance.
H3: Companies from countries with higher
Individualism has a different profitability of
companies from countries with lower Individualism. H4: Companies from countries with higher
Masculinity has a different profitability of companies from countries with lower Masculinity.
H5: Companies from countries with higher
Long-Term Orientation has a different profitability
of companies from countries with Long-Term
Orientation.
H6: Companies from countries with higher
Indulgence has a different profitability of companies
Table 1. Six dimensions According to Hofstede and their Organizational Consequences Power Distance
Low (Austria, Denmark, Finland, Ireland, Norway, Sweden and Switzerland)
High (Belgium, France, Poland, Portugal, Romania, Russia and Turkey)
· Less centralization
· Smaller wage differentials
· Structure in which manual and clerical workers are in
equal jobs.
· Subordinates expect to be consulted
· The ideal boss is a resourceful democrat
· Greater centralization · Large wage differentials
· Structure in which white-collar jobs are valued more than
blue-collar jobs.
· Subordinates expect clear guidance from superiors · The ideal boss is a benevolent autocrat, or “good father
Uncertainty Avoidance
Low (Denmark, Ireland, Netherlands, Norway, Romania, Sweden, and UK)
High (Belgium, France, Poland, Portugal, Russia, Spain and Turkey)
· Managers are more involved in strategy
· Managers are more interpersonal oriented and flexible in the styles
· Managers are more willing to make individual and risky decisions
· Lower satisfaction scores
· Less power through control of uncertainty · Fewer written rules
· Variability
· Greater willingness to take risks
· Managers are less involved in strategy
· Managers are more task-oriented and consistent in their styles
· Managers are less willing to make individual and risky decisions
· High satisfaction scores
· More power through control of uncertainty · More written rules
· Standardization
· Less willingness to take risks
Individualism
Low (Austria, Czech Republic, Portugal, Romania, Russia, Spain, and Turkey)
High (Belgium, Denmark, Italy, Netherlands and UK) · Involvement of individuals with organizations primarily
moral
· Employees expect organizations to look after them like a family and can become very alienated if organization dissatisfies them
· Organization has great influence on member’s well-being · Employees expect organization to defend their interests. · Policies and practices are based on loyalty and sense if there is duty and group participation
· Promotion is from inside and seniority · Less concern with fashion in managerial ideas. · Policies and practices vary according to relations.
· Involvement of individuals with organization primarily calculative.
· Organizations are not expected to look after employees from the cradle to the grave
· Organization has moderate influence on member’s wellbeing · Employees are expected to defend their own interests · Policies and practices should allow individual initiative · Promotion is from inside and outside and market value. · Promotion is based on market value.
· Managers try to be up to date and endorse modern management ideas
Masculinity
Low (Denmark, Finland, Netherlands, Norway and Sweden) High (Australia, Ireland, Italy, Romania and Switzerland)
· Sex roles are minimized
· Organizations do not interfere with people’s private lives
· More women in more qualified jobs
· Soft, yielding, intuitive skills are rewarded
· Lower job stress
· Social rewards are valued
· Resolution of conflicts by compromise and negotiation
· Sex roles are clearly differentiated
· Organizations may interfere to protect their interest
· Fewer women in qualified jobs
· Aggression, competition, and justice are rewarded
· Higher job stress
· Work is valued as a central life interest
· Resolution of conflicts by letting the strongest win
Long-Term Orientation
Low (Denmark, Finland, Ireland, Norway, Poland and Portugal)
High (Belgium, Czech Republic, Germany, Russia and Switzerland)
· Meritocracy, rewards by abilities
· Focus on the “bottom line”
· Wide social and economic differences are undesirable
· Focus is on market position
Indulgence
Low (Czech Republic, Italy, Poland, Portugal, Romania and Russia)
High (Denmark, Netherlands, Sweden, Switzerland and UK))
· More neurotic personalities
· Thrift is important
· Strictly prescribed gender roles
· More extroverted personalities
· Thrift is not very important
· Loosely prescribed gender roles
Source: Adopted from Hofstede (2010)
This research is based on 500 largest European companies included in the Financial Times 2015 classification, with reference to 2014 market value. From initial sample were eliminated fifty companies with extreme values of ROE variable since it had
companies were selected towards the analysis of a set of companies that are economically important and that operate in multiple environments such as legal, institutional, economic and cultural conditions. The information about companies was obtained from Datastream database. These companies were aggregated in ten activity sectors: 1. Basic materials; 2. Consumer goods; 3. Consumer services; 4. Financials; 5. Health care; 6. Industrials;
7. Oil & gas; 8. Technology; 9. Telecommunications and 10. Utilities.
The cultural dimension was measured applying the six dimensions presented by Hofstede (2010): 1.
Power Distance (PDI); 2. Uncertainty Avoidance (UAI);
3. Individualism (IDV); 4. Masculinity (MAS); 5.
Long-Term Orientation (LTO); and 6. Indulgence vs Restraint (IND). Profitability was measured by the
Return on Assets (ROA) and Return on Equity (ROE). These indicators are often used in financial and accounting literature in evaluating the performance of companies. ROA is calculated by dividing a company's annual earnings by its total assets giving an idea as to how efficient management is at using its assets to generate earnings. ROE is calculated by dividing a company's annual earnings by its Shareholder's Equity and shows how well a company uses investments to generate earnings growth.
The 450 companies were integrated into ten activity sectors and the number of companies from each sector is shown in Table 2. The main representative (25.8%) is the sector Financials (which includes financial services, nonlife insurance, life insurance, banks, real estate investment and services and real estate investment trusts). The second most representative sector (19.2%) is the Industrials (which includes aerospace and defence, construction and materials, electronic and electrical equipment, general industrials, industrial engineering, industrial transportation and support services), followed by the sector Consumer goods (which includes automobiles and parts, beverages, food producers, household goods and home construction, personal goods, and tobacco) which represents 12.0%.
Table 3 evidences that the most represented country is United Kingdom (22.7%), France (16%), and Germany (12.4%). Austria, Czech Republic, Romania and Portugal evidence a very residual influence in this sample.
Table 2. Activity sectors
Activity sector N % Basic materials 43 9.6 Consumer goods 54 12.0 Consumer services 48 10.7 Financials 116 25.8 Health care 21 4.7 Industrials 89 19.8
Oil & gas 25 5.6
Technology 14 3.1 Telecommunications 16 3.6 Utilities 24 5.3 Total 450 100.0 Table 3. Countries Country N % Country N % Austria 4 0.9 Poland 9 2.0 Belgium 9 2.0 Portugal 3 0.7
Czech Republic 2 0.4 Romania 1 0.2
Denmark 11 2.4 Russia 14 3.1 Finland 7 1.6 Spain 24 5.3 France 72 16.0 Sweden 27 6.0 Germany 56 12.4 Switzerland 39 8.7 Ireland 5 1.1 Turkey 14 3.1 Italy 23 5.1 UK 102 22.7 Netherlands 19 4.2 Norway 9 2.0 Total 450 100.0
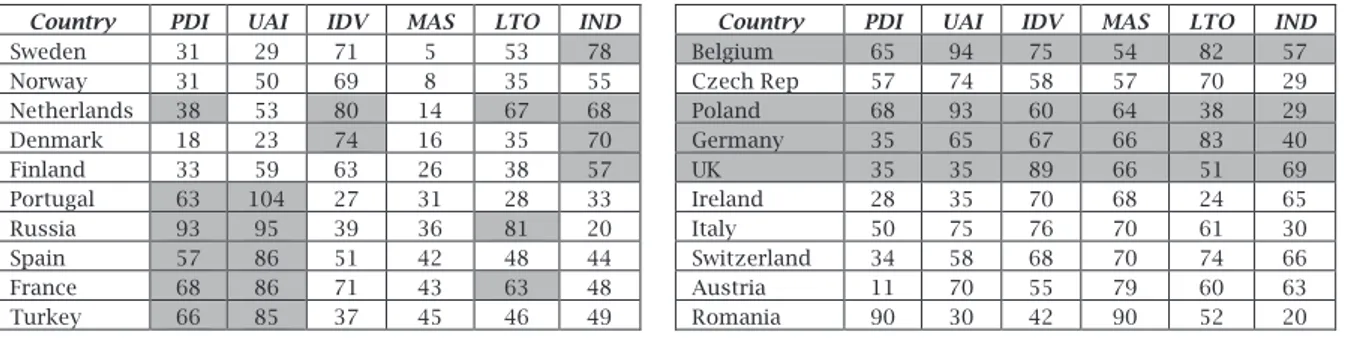
Table 4 evidences the dimensions scores applied in this study. A higher degree of the Power
Distance index is shown by Russia (93) and Romania
(90). On the other hand Austria (11) and Denmark (18) have a lower Power Distance. Uncertainty
Avoidance scores are the highest in Portugal (104),
Russia (95) and Belgium (94). They are lower for Denmark (23) and Sweden (29). Regarding the
Individualism index is highest in UK (89) and
Netherland (80); and lowest in Portugal (27), Turkey (37) and Russia (39). Masculinity is high in Romania
(90) and Austria (79). In contrast, Masculinity is low in Sweden (5) and Norway (8). High Long-Term
Orientation scores are found in Germany (83),
Belgium (82) and Russia (81); and low in the Ireland (21) and Portugal (28). Indulgence scores are highest in Sweden (78), Denmark (70) and UK (69); and lowest in Romania and Russia (20).
Table 5 illustrates the main descriptive statistics measures considering the 500 companies and considering the sample composed by 450 companies.
Table 4. Six dimensions from Hofstede
Country PDI UAI IDV MAS LTO IND Country PDI UAI IDV MAS LTO IND
Sweden 31 29 71 5 53 78 Belgium 65 94 75 54 82 57
Norway 31 50 69 8 35 55 Czech Rep 57 74 58 57 70 29
Netherlands 38 53 80 14 67 68 Poland 68 93 60 64 38 29 Denmark 18 23 74 16 35 70 Germany 35 65 67 66 83 40 Finland 33 59 63 26 38 57 UK 35 35 89 66 51 69 Portugal 63 104 27 31 28 33 Ireland 28 35 70 68 24 65 Russia 93 95 39 36 81 20 Italy 50 75 76 70 61 30 Spain 57 86 51 42 48 44 Switzerland 34 58 68 70 74 66 France 68 86 71 43 63 48 Austria 11 70 55 79 60 63 Turkey 66 85 37 45 46 49 Romania 90 30 42 90 52 20
Table 5. Descriptive measure
Variable N Mean Median Standard
deviation
considering 500 companies
ROA 500 5.32 4.25 6.471
ROE 500 16.31 11.69 48.792
considering the sample
ROA 450 5.07 4.02 5.021
ROE 450 13.09 11.8 8.705
We used the t-Student test to verify a difference between sample means. The null hypothesis is rejected in case of Power Distance, uncertainty avoidance, Long-Term Orientation (considering the profitability measured by ROE) and Indulgence evidencing that there is a difference between the mean of profitability obtained by the different groups considering the different dimension of culture.
In case of Individualism and Masculinity the null hypothesis is not rejected, which supports the evidence that there is no statistical differences
between the mean of profitability obtained by the different groups considering the different dimension of culture.
Table 6 evidence the descriptive measures of the
Power Distance and profitability and the tests of the
null hypotheses (H0). This hypothesis states that the mean of ROA or ROE of European companies with high PDI is equal to the mean of ROA of European companies with low PDI. The results from t-Student test also supports the rejection of the null hypothesis evidencing that there is a difference between the indicator ROA and ROE obtained by companies from countries with high PDI and the same indicator obtained by companies from countries with low PDI. Empirical evidence supports that the larges mean is observed in the group with companies from countries with low PDI (Austria, Denmark, Finland., Ireland, Norway, Sweden and Switzerland)
Table 6. The Power Distance and the profitability
Power Distance N Mean Standard deviation
ROA
High PDI 190 4.05 4.316
Low PDI 260 5.81 5.365
t Test for equality of means: t(448) = -3.741; p =0.00
ROE
High PDI 190 11.74 8.860
Low PDI 260 14.07 8.471
t Test for equality of means: t(448) = -2.832; p =0.01
Concerning Uncertainty Avoidance and profitability the results from t-Student test supports the rejection of the null hypothesis evidencing that there is a difference between the indicator ROA and ROE obtained by companies from countries with
high UAI and the same indicator obtained by companies from countries with low UAI (Table 7). Empirical evidence supports that the larges mean is observed in the group with companies from countries with low UAI (Denmark, Sweden, Romania, Ireland, UK, Norway, Netherlands, Switzerland and Finland).
Table 7. The Uncertainty Avoidance and the profitability
Uncertain avoidance N Mean Standard deviation
ROA
High UAI 231 4.28 4.480
Low UAI 219 5.90 5.420
t Test for equality of means: t(448) = -3.474; p =0.00
ROE
High UAI 231 12.22 8.801
Low UAI 219 14.00 8.523
t Test for equality of means: t(448) = -2.178; p =0.03
Table 8 evidence the descriptive measures of
Individualism and the ROA and ROE respectively and
the results of t-Student test. The results derived from t-Student test indicate that there isn’t a
statistical difference between the profitability obtained by countries with low or high
Individualism. These results do not support the
results presented by Shi and Veenstra (2015) and Gerecke and House (2013).
Table 8. The Individualism and the profitability
Individualism N Mean Standard deviation
ROA
High IDV 164 5.02 4.606
Low IDV 286 5.09 5.252
t Test for equality of means: t(448) = -0.135; p =0.89
ROE
High IDV 164 12.92 8.534
Low IDV 286 13.1 8.815
Table 9 relate to the descriptive measures of the
Masculinity and profitability and the results of
t-Student test. The results evidence that the null
hypothesis cannot be rejected confirming that there is no difference between the ROA or ROE obtained be countries with high or low Masculinity. These results do not support the results presented by Gerecke and House (2013).
Table 9Ô The Masculinity and the profitability
Masculinity N Mean Standard deviation
ROA
High MAS 229 5.44 5.214
Low MAS 221 4.68 4.793
t Test for equality of means: t(448) = 1.594; p =0.11
ROE
High MAS 229 13.61 8.491
Low MAS 221 12.54 8.902
t Test for equality of means: t(448) = 1.302; p =0.19
Table 10 includes the descriptive measures of the
Long-Term Orientation and profitability measured
by ROA and ROE indicators and the results of t-student test. Considering the ROA the results evidence that the null hypothesis cannot be rejected confirming that there is no difference between the ROA obtained be countries with high or low
Long-Term Orientation. Considering the ROE, the results
evidence that there is a difference between the ROE
obtained by companies from countries with high LTO and the same indicator obtained by companies from countries with low LTO.
Empirical evidence supports that the largest mean is observed in the group with companies from countries with low LTO (Ireland, Portugal, Denmark, Norway, Finland, Poland, Turkey, Spain, UK, Romania and Sweden).These results do not support the results presented by Shi and Veenstra (2015) and Gerecke and House (2013)Õ
Table 10Õ The Long-Term Orientation and the profitability
Long-Term Orientation N Mean Standard deviation
ROA
High LTO 234 4.77 4.994
Low LTO 216 5.38 5.042
t Test for equality of means: t(448) = -1.285.; p =0.20
ROE
High LTO 234 12.27 8.659
Low LTO 242 13.98 8.687
t Test for equality of means: t(448) = -2.100; p =0.04
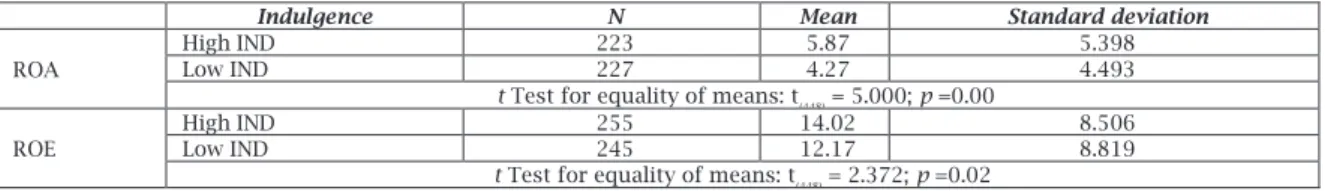
Table 11 evidence the descriptive measures of the
Indulgence and profitability measured by ROA and
ROE and the results of t-student test. Empirical evidence support the largest mean is observed in the group with high IND (Sweden, Denmark, UK, Netherlands, Switzerland, Ireland, Austria, Finland
and Belgium). The results from t-Student test evidencing that there is a difference between the profitability obtained by the companies from countries with high Indulgence and companies from countries with low Indulgence. These results do not support the results presented in Shi and Veenstra (2015) study may be because this study does not incorporate corporate social performance measures. Table 11Ö The Indulgence and the profitability
Indulgence N Mean Standard deviation
ROA
High IND 223 5.87 5.398
Low IND 227 4.27 4.493
t Test for equality of means: t(448) = 5.000; p =0.00
ROE
High IND 255 14.02 8.506
Low IND 245 12.17 8.819
t Test for equality of means: t(448) = 2.372; p =0.02
Our study contributes to show how culture can affect firm profitability. Our findings suggest that cultural values should be accounted for when designing government policies aimed at encouraging entrepreneurship, innovation, and growth. Our results can also be used by investors so that they can direct their investments to companies in countries with lower values of Power Distance, Uncertainty Avoidance, Long-Term Orientation and higher values of Indulgence. European countries represented in our sample with simultaneous low
Power Distance, uncertainty avoidance, Long-Term Orientation and higher Indulgence are Denmark,
Sweden, Ireland and Finland. However it is necessary
to consider other factors that may influence the profitability of companies.
This paper aims to investigate the association between the national culture and the profitability of European companies. Based on the Hofstede’s model (based on cultural dimensions), the results indicate that companies with higher profitability are from countries with lower Power Distance, Uncertainty
Avoidance, Long-Term Orientation, and higher Indulgence. However, the dimensions Individualism
European countries with simultaneous low Power
Distance, uncertainty avoidance, Long-Term Orientation and higher Indulgence are Denmark,
Sweden, Ireland and Finland and are the countries that tend to have higher profitability. On the other hand, European countries with simultaneous high
Power Distance, uncertainty avoidance, Long-Term Orientation and low Indulgence are Germany, Italy,
Czech Republic, France and Russia. These countries tend to evidence lower profitability levels. The results achieved in this research are not aligned Shi and Veenstra (2015) research. Our research does not incorporate the measures of corporate social performance, taking into account only the Hofstede’s cultural dimensions. Not surprisingly, our results do not corroborate the achievements of Gerecke and House (2013), probably because this research is limited to banking sector. However, our findings can contribute for the literature with practical insights about the impact of cultural dimensions on European countries profitability. Regarding the limitations, this research was conducted only for one year and in the scope of the European companies. To extend the range of time and the number of counties under analysis will contribute to refute or corroborate the evidences achieved in the current research and the other approaches carried out over time.
1. Ahern, K.R., Daminelli, D., and Fracassi, C. (2015), “Lost in translation? The effect of cultural values on mergers around the world”, Journal of
Financial Economics Vol. 117, No. 1, pp.115-189.
2. Ahmad, M. S. (2012) “Impact of Organizational Culture on Performance Management Practices in Pakistan”, Business Intelligence Journal, Vol. 5, No.1, pp. 50-55.
3. Blaško, M., Netter, J. M. and Sinkey Jr, J. F. (2000), “Value creation and challenges of an international transaction The DaimlerChrysler merger”,
International Review of Financial Analysis, Vol. 9
No. 1, pp. 77-102.
4. Chan, A. W. H. and Cheung, H. Y (2011), “Cultural Dimensions, Ethical Sensitivity, and Corporate Governance”, Journal of Business Ethics, Vol. 110 No. 1, pp. 45-59.
5. Cho S.; Ghoul, S.E.; Guedhami, O. and Suh, J. (2014), “Creditor rights and capital structure: Evidence from international data”, Journal of
Corporate Finance, Vol., pp. 40–60
6. Cohen, J. R., Pant, L. W. and Sharp, D. J. (1992), “Cultural and socioeconomic constraints on international codes of ethics: Lessons from accounting”, Journal of Business Ethics, Vol. 11, No. 9, pp. 687-700.
7. Curtis, M. B. Conover, T. L. and Chui, L. C. (2012), “A Cross-Cultural Study of the Influence of Country of Origin, Justice, Power Distance, and Gender on Ethical Decision Making”. Journal of International Accounting Research, Vol. 11 No. 1, pp. 5-34.
8. Ehtesham, U M., Muhammad, T. M. and Muhammad, S. A. (2011), “Relationship between Organizational Culture and Performance Management Practices: A Case of University in Pakistan”, Journal of Competitiveness No. 4, pp. 78-86.
9. Gerecke, G. A. and House, G. (2013), “TMT national culture and banking profits during the 2008
global economic crisis”, Journal of International
Business and Cultural Studies; Vol. 7.
10. Griffin, D.W., Guedhami, O., Kwok, C.C.Y., Li, K. and Shao, L. (2015), “National Culture, Corporate Governance Practices, and Firm Value”. Available at
SSRN:http://ssrn.com/abstract=2400078 or http:/ /dx.doi.org/10.2139/ssrn.2400078
11. Han, S., Kang, T., Salter, S. B. and Yoo, Y. K. (2010), “A Cross-Country Study on the Effects of National Culture on Earnings Management”, Journal of
International Business Studies, Vol. 41 No. 1, pp.
123-141.
12. Hofstede (1991), Culture and Organizations:
Software of the Mind New York: McGraw-Hill
13. Hofstede, G., Hofstede, G.J. and Minkov, M. (2010),
Cultures & organizations: Software of the mind: Intercultural cooperation and its importance for survival, New York: McGraw-Hill, 3rd edition.
14. Kanungo, R. P. (2006), "Cross culture and business practice: are they coterminous or cross-verging?”, Cross Cultural Management: An International Journal, Vol. 13 No. 1, pp.23 – 31.
15. Kirkman, B. L., Lowe, K. B. and Gibson, C. B. (2006),
“A quarter century of Culture's Consequences: a review of empirical research incorporating Hofstede's cultural values framework”, Journal of
International Business Studies, Vol. 37, pp.
285-320.
16. Kotter, P. and Heskett, L. (1992), Corporate Culture and Performance, Macmillan, New York, NY.
17. Lievenbrück, M. and Schmid, T. (2014), “Why do firms (not) hedge? — Novel evidence on cultural influence”, Journal of Corporate Finance, Vol. 25, pp.92-106.
18. Marcoulides, G. and Heck, R. (1993), “Organizational culture and performance: Proposing and testing a model”, Organization Science, Vol. 4 No. 2, pp. 209-225.
19. Ogbonna, E. and Harris, L. (2000), “Leadership style, organizational culture and performance: Empirical evidence from UK companies”,
International Journal of Human Resources Management, Vol. 11 No. 4, pp. 766-788.
20. Ozgulbas, N., Koyuncugil, A. S., and Yilmaz, F. (2006), “Identifying the Effect of Firm Size on Financial Performance of SMEs.”, The Business
Review, Vol. 6 No. 1, pp.162–167.
21. Rousseau, D. (1991), “Quantitative assessment of organizational culture”. Group and Organizations Studies, Vol. 15 No. 4, pp. 448-460.
22. Sagiv, L., and Schwartz, S. H. (2207), “Cultural values in organisations: Insights for Europe,” European Journal of International Management, Vol. 1, pp. 176-190.
23. Shao, L., Kwok, C.C.Y. and Zhang, R. (2013), “National culture and corporate investment”,
Journal of International Business Studies, Vol. 44
No.7, pp. 745-763.
24. Shi, W. and Veenstra, K J. (2015), “The Moderating Effect of Cultural Values on the Relationship between Corporate Social Performance and Corporate Financial Performance”, American Accounting Association, Annual meeting on teaching and learn accountability.
25. Stulz, R. and Williamson, R. (2003), “Culture, openness, and finance”, Journal of Financial Economics, Vol. 70 No. 3, pp. 313-349.
26. Taylor, M.Z., and Wilson, S. (2012), “Does culture still matter? The effects of individualism on national innovation rates”, Journal of Business