Repositório ISCTE-IUL
Deposited in Repositório ISCTE-IUL: 2019-03-14
Deposited version: Post-print
Peer-review status of attached file: Peer-reviewed
Citation for published item:
Santos, J. M. (2018). Development and validation of the Multi-dimensional University Research Workplace Inventory (MDURWI). Higher Education Policy. 31 (3), 381-404
Further information on publisher's website: 10.1057/s41307-017-0064-6
Publisher's copyright statement:
This is the peer reviewed version of the following article: Santos, J. M. (2018). Development and validation of the Multi-dimensional University Research Workplace Inventory (MDURWI). Higher Education Policy. 31 (3), 381-404, which has been published in final form at
https://dx.doi.org/10.1057/s41307-017-0064-6. This article may be used for non-commercial purposes in accordance with the Publisher's Terms and Conditions for self-archiving.
Use policy
Creative Commons CC BY 4.0
The full-text may be used and/or reproduced, and given to third parties in any format or medium, without prior permission or charge, for personal research or study, educational, or not-for-profit purposes provided that:
• a full bibliographic reference is made to the original source • a link is made to the metadata record in the Repository • the full-text is not changed in any way
The full-text must not be sold in any format or medium without the formal permission of the copyright holders. Serviços de Informação e Documentação, Instituto Universitário de Lisboa (ISCTE-IUL)
Av. das Forças Armadas, Edifício II, 1649-026 Lisboa Portugal Phone: +(351) 217 903 024 | e-mail: [email protected]
Abstract
This study describes the development and validation of an instrument aimed towards measuring organizational features of an academic research workplace. The question pool was developed based on data from a pilot study (N = 43). The survey was deployed to academic researchers in the field of higher education research worldwide (N = 850). An exploratory factor analysis conducted on 36 questions, followed by confirmatory factor analysis, which lead to a final pool of 27 questions in 5 subscales, one of which divided into 3 lower-order factors. The final model exhibited very good fit (X2/df = 2.561; CFI = 0.972; PCFI = 0.784; RMSEA = 0.043; P[rmsea
≤ 0.05] < 0.001; AIC = 891.018; BCC = 987.839) and psychometric properties, in the form of factorial, convergent, and discriminant validity, as well as reliability and sensitivity. Implications of this instrument for research and policymaking are discussed, as well as future research directions.
Keywords: exploratory factor analysis, confirmatory factor analysis, validation, research work,
Introduction
The work of academic researchers is increasingly filled with contradictions that result from tensions between tradition and neo-liberal policies (Shattock, 2014). Academic researchers require a significant amount of freedom (Marginson, 2008) to develop creative work (Hemlin et al, 2008), but are constantly subjected to the current “publish-or-perish” paradigm (Jung, 2014), according to which they must constantly publish lest they fall behind their peers (Dobele and Rundle-Theile, 2015). Academic researchers also have to cope with other institutional duties such as committee participation, mid-level leadership roles, attracting funding, and balancing the teaching-research nexus (Henkel, 2000; Horta et al, 2012; Pepper and Giles, 2015; Young, 2015). The stress of balancing this multi-dimensional work life and appeasing the many different stakeholders while maintaining a productive track record creates a unique environment arguably far different than working, for example, in a private firm (even if universities are increasingly adopting managerial practices traditional of the business private sectors (Kauppinen and Kaidesoja, 2014); these are mostly considered a threat to academic research, culture and work (Jemielniak and Greenwood, 2015)). The understanding of the research workplace that affects academic research is central to understand research work, and although there have been studies focusing on it (e.g., Horta and Lacy, 2011; Leisyte et al, 2008), there is a lack of properly validated questionnaires used to conduct systemic research on how the work of researchers in academia is influenced by the organizational setup (as argued by the literature; see Blackburn and Lawrence, 1995; Tigelaar et al, 2004).
This article contributes to this knowledge gap by proposing a new instrument – the Multi-Dimensional University Research Workplace Inventory – (MDURWI) - to evaluate representative work dimensions, tailored to the specificity of research life in research workplace. Research workplace in this article is defined by the broad academic setting of universities, and understood by the general set of values, norms, and taken-for-granted beliefs
and attitudes of the university as the closest organizational environment influencing scholarly activities. This means that the research workplace is not necessarily framed to the development of a research activity in a specific spatial place, such as doing research in a laboratory or in a research center. Rather, it refers to doing research in a university academic setting where research is a key component of academic work, and is informed, constrained and modelled by other dimensions that affect it and are typical of universities as places of inquiry (see Clark, 1995). This broader understanding of research workplace enables to consider critical factors influencing the research activities of academic researchers such as their involvement in teaching (teaching-research nexus), but also the workload, governance styles, identity and other elements that define the university as unique and distinct organization (see Leisyte, 2016; Slade et al, 2016; Cattaneo et al., 2016; Kessler et al., 2014; Shin and Jung, 2014; Webber, 2012)
The analysis is conducted through exploratory and confirmatory factor analysis on a pool of questions based on the literature and on feedback obtained from academic researchers in discussion panels, scientific meetings, and through informal conversations. In this next section, the literature providing the rationale for the different factors will be considered. Then, the methodological aspects of this article are presented, and the article concludes with the analysis and its discussion.
Literature Review
No validated instrument currently exists to assess the academic researcher work dimension. A worldwide project called “Changing Academic Profession” (CAP) employs a survey implemented in several countries about the academic profession as a whole, but no report, book chapter or article was found concerning its validation process. Moreover, the focus on the research environment represents only a limited component of the survey (see Teichler et al, 2013), and these elements were taken into consideration when designing the current
instrument. Taking this into account, the development of this article’s instrument is sourced from key factors identified in the literature from various fields, as well as overarching factors drawn from organizational psychology. The choice of these key factors is not meant to be exhaustive (as it would be arguably impossible to create an instrument measuring all known organizational variables), but rather to obtain a balance between conceptual coverage and instrument size. These factors were chosen based on being well-established – one could name them “classics” - with a robust theoretical background (which is covered further ahead), and being commonly employed in studies on both academic (e.g., Peluchette, 1993; Stahl and Koser, 1978) and non-academic (e.g., Schyns and von Collani, 2002; Babakus et al., 1996; Hersey et al., 1969) contexts.
The first factor to be considered and the most prominent one in the literature on organizations is satisfaction with the institution and one job’s duties since this satisfaction has been linked to organizational productivity (Böckerman and Ilmakunnas, 2012). Job satisfaction is also highlighted in studies focusing on the academic profession (Machado-Taylor et al, 2014; Shin and Jung, 2014) but the relation between job satisfaction and research productivity has warranted mixed findings (Abouchedid and Abdelnour, 2015; Kerlin and Dunlap, 1993; Kessler et al, 2014; McNeece, 1981; Terpstra et al, 1982). These contradictory results have been attributed to the lack of properly validated instruments tailored to the realities of academia (Blackburn and Lawrence, 1995), underlining the need to include satisfaction as a critical dimension in studies focusing on academic research workplaces. A second factor concerning satisfaction is satisfaction with the leadership. The reason why this level of satisfaction should be considered separately is due to the abundance of literature linking leadership to various other workplace characteristics (Gil et al., 2005; Podsakoff et al, 1996; Podsakoff et al, 1990; Roberts et al, 1968). Although an individual’s relationship with one’s leader is certain to affect to some degree one’s institutional satisfaction (Lok and Crawford, 2004), the satisfaction with the
leadership effect is considerable enough to stand on its own. This is increasingly important and evident in academic contexts (see Alonderiene and Majauskaite, 2016) including those more directly related to academic research activities, their management and associated strategies (Horta and Martins, 2014).
Another critical dimension is organizational commitment, which is still rather understudied in the context of university research workplaces (as argued by the recent publication by Jing and Zhang, 2014). Organizational commitment as a key organizational dimension has been largely explored in the organizational psychology literature (Meyer and Allen, 1991; Mowday et al, 1979; O’Reilly and Chatman, 1986). It is a concept related to the linkage between individual and organization and how it is perceived at an individual level (Mowday et al, 1982). It can be further sub-divided into attitudinal commitment, which is the congruence between the organization and the individual (in some ways, the feeling of belonging), and behavioral commitment, which is related to intentions of staying or leaving the organization (Mowday et al., 1982). These aspects have been developed in other questionnaires (Mowday et al., 1979), which provide inspiration for this component of the present study.
It is also important to consider the social dimension of the university research workplaces, since engaging in collaborative work is considered highly desirable in present day research (Ebadi and Schiffauerova, 2015) and has been linked with both productivity (Horta and Santos, 2015) and career prospects (Hoffman, 2009). As the academic researcher’s colleagues are the most direct opportunity for collaborations, the quality of this relationship can be seen as a gauge for intra-institutional collaborations (Horta and Lacy, 2011). It is also linked to organizational commitment (Madsen et al, 2005) and the development of the psychological contract between individual and institution (Cuthbert, 1996). The sense of belonging and identity in higher education can be particularly strong with one’s individual institution, independent of tensions between one’s identification with the culture and ethos of
a university and the mindset of disciplinary and professional communities to which the researcher can belong to (e.g., Findlow, 2012).
Another critical dimension is the matter of freedom. Academic researchers require a significant amount of freedom (Marginson, 2008) associated to time dedicated to research-oriented activities (which can encompass postgraduate education; see Kwan, 2013), but this is often limited due to hierarchical constraints (Bourdieu, 1999; Latour and Woolgar, 2013) or other competing tasks, such as teaching duties and management and bureaucratic tasks (Pepper and Giles, 2015; Young, 2015). Indeed, it has been reported that individuals feel that institutions actively attempt to limit this freedom by shifting the researcher’s priorities towards administrative tasks as a way of weighting the scales of power in favor of the institution (Henkel, 2000), which has a negative impact on the bond between individual and institution (Cuthbert, 1996). In this article, freedom is understood from two differences perspectives. The first one is the classic notion of academic freedom, a form of intellectual independence, allowing the researcher to pursue research of his own volition (e.g., Ren and Li, 2013; Polanyi, 2000). This autonomy at an individual level should be not confused with the concept of “Institutional Autonomy” (Ren and Li, 2013) which is often enshrined in law. The second notion of freedom relates to the absence of external pressures on the work of the academic researcher. These forces can be of three natures: bureaucratic, meaning pressure into committee participation, management duties, or simple administrative requirements (e.g., Pepper and Giles, 2015; Young, 2015); hierarchical, meaning that the academic researcher’s work is imposed or dependent on his hierarchical superior (e.g., Bourdieu, 1999; Latour and Woolgar, 2013); or pressure, derived from academic “marketization”, which can push the academic researcher into a direction which is not his or hers own, thus curbing his or her freedom (Ek et al., 2013).
The final dimension to be considered is access to resources. This has been reported to be linked to many of the previously discussed factors and some others such as productivity (Jacob and Lamari, 2012). The lack of funding might cause academic researchers to shift their priorities towards other fields out of necessity instead of interest, lowering morale and satisfaction (Blackburn and Lawrence, 1995; Bourdieu, 1999; Henkel, 2000).
These dimensions have a wealth of instruments developed to measure them in organizational contexts other than academia such as private businesses (see, for example: Higgs and Dulewicz, 2003; Mowday et al., 1979; Amabile et al., 1996; Spector, 1994). However, as these instruments were validated in one specific context, it is not entirely clear whether they directly translate into university research workplaces. Indeed, some items present in those instruments simply do not apply to universities workplaces (e.g., “I do not think that wanting to be a 'company man' or 'company woman' is sensible anymore” [Allen and Meyer, 1990]), while some dimensions are largely absent (for example, freedom is not a common theme in the private business context, and tends to only be present in the context of creativity environment studies and surveys; e.g., Amabile et al, 1996). This poses a significant challenge to scholars wishing to study university research workplaces; if they wish to use existing instruments, they are faced with the choice of either using various lengthy instruments in tandem (after reviewing them to ensure that all items apply to this setting) and ending with an extremely extensive survey, or devising their own measures. In fact, quantitative studies on organizational variables in university research workplaces usually opt for the latter option (e.g., the “Changing Academic Professions” survey). An instrument developed by Stahi (1977) which measures several organizational variables specifically in laboratory settings, has a measure of conceptual overlap with the MDURWI (e.g., leadership related aspects, freedom, and the social dimension are represented in some manner). However, it has the drawback of missing the commitment dimensions, being a decades-old validation exercise which might not apply entirely to the
current generation of academic researchers (and universities that are re-inventing themselves), and the content of the items not being made available from the publication. This noticeable absence of properly validated quantitative instruments has been consistently noted by the literature (see Blackburn and Lawrence, 1995; Tigelaar et al, 2004).
As this study was conducted in the field of higher education, some context must also be given regarding the specificity of this field. First the object-focused paradigm of the field translates into a largely multidisciplinary approach, which means that researchers engaged in this field hail from a multitude of academic backgrounds (Altbach et al., 2006; Teichler, 1996). Second, and following this first consideration, the higher education researcher communities are not restricted to their respective countries due to disparities in the relative sizes of these communities (Tight, 2012; Teichler, 1996); rather, communities are generated around the topics they work on (Kim et al, 2017; Kuzhabekova et al., 2015; Chen and Hu, 2012) or their stances on policy and issues (Ashwin et al., 2016). Thus, even though the field has a degree of overlap between the role of researcher and practitioner (Harland, 2012; Teichler, 1996), the diversity of the field ensures that a multitude of ideas, stances, theories and methods co-exist forming an academic archipelago that is cohesively anchored around issues that pertain to higher education issues (MacFarlane, 2012).
Method
Participants
Prior to the present study, all corresponding authors matching a search for articles in journals with “tertiary education” or “higher education” in the title were identified in SCOPUS. Subsequently, they were invited by e-mail to participate in the present study by filling an online survey. An informed consent form was provided as a landing page to the survey, to which the participants were required to agree before being able to proceed. A total of 1,348 individuals
agreed to participate; of these, 498 did not complete the survey entirely and were removed from subsequent analysis, leading to a final sample of 850 participants. 54.2% (N = 461) of the participants were female, with the remaining 45.8% (N = 389) being male; ages ranged between 24 and 84 (M = 51.04, SD = 11.22). The majority of the participants operated from institutions within the United States (N = 216), followed by Australia (N = 128) and the United Kingdom (N = 117); the remaining participants were distributed over 65 other countries. The participants in this study work in universities, although it is assumed that some may also have ties to non-university institutions, including governments (see Harland, 2012). In both the pilot and main study, the questions were presented in a random order for each participant.
Question drafting
An initial pool of 72 Likert-style questions (range 1 to 7 with the option for “Don’t Know”) was drafted and divided by the five themes identified in the literature: institutional satisfaction, organizational commitment, leadership satisfaction, social satisfaction, freedom, and resources. Previous discussion of the instruments’ thematic was also conducted in workshops, such as meetings with various degrees of formality and discussion panels, which concomitantly converged into the aforementioned dimensions. One of the goals while developing this survey was keeping the total number of items relatively low for ease-of-use, similarly to what has been done with other questionnaires (see Rammstedt and John, 2007). In order to achieve this, during May of 2015 these 72 questions were deployed to 43 researchers from a variety of fields of knowledge and institutions worldwide in order to conduct preliminary exploratory and confirmatory factor analysis with the sole aim of removing poor items, therefore reducing the total number of items. Due to sample size constraints, the following analysis were conducted separately for each block of 12 questions: in a first step an Exploratory Factor Analysis (EFA) was performed, and through analysis of the anti-image matrices items with a Measure of Sampling Adequacy (MSA) under 0.50 were removed
(Maroco, 2003). After this first pass, a new EFA was conducted using Varimax rotation, and the optimal number of factors were determined based on the Kaiser criteria, screeplot analysis, and extracted variance. Subsequently, the extracted factorial structure was used to conduct a Confirmatory Factor Analysis (CFA). At this point, items with factorial loadings under 0.50 – indicating potential factorial validity issues (Marôco, 2010) – were eliminated. This procedure led to the final pool of 36 questions (6 per theme) which was used in the present study, and is summarized in Table 1. It is important to note that on the “Resources” dimension, all but one of the items referring to non-financial resources were removed based on the criteria. Due to this, it was opted to use “Funding” in lieu of “Resources” for the remainder of the analysis. Participant feedback was also requested at the end of the pilot; it was noted that the full pilot instrument (72 questions) was too large to be of practical use, which was in line with the initial goal of item reduction. No feedback was provided regarding the content of the items themselves.
<INSERT TABLE 1 HERE>
Results
Exploratory Factor Analysis
Exploratory Factor Analysis (EFA) was performed on the pool of 36 questions using IBM SPSS 22 using Principal Component estimation. Due to expectation to some degree of correlation between the factors, it was opted to use an oblique rotation – Direct Oblimin (Abdi, 2003; Maroco, 2003). Missing data was handled through Markov Chain Monte Carlo (MCMC) multiple imputation, from which five complete datasets were produced. EFA was conducted on all five datasets simultaneously; for analytical purposes, only the pooled estimates were considered and reported. Data adequacy for EFA was evaluated on several levels; first, normality of the data was observed through skewness and kurtosis for the different items. All
of them were lower than an absolute value of 3, indicating no serious departure from normality (Kline, 2011). The Kaiser-Meyer-Olkin (KMO) was 0.934 and Bartlett’s test of sphericity was significant (χ2 (630) = 22539.175, p < 0.001), indicating that the data is adequate for EFA (Hair
et al, 2007; Maroco, 2003). Finally, individual items were evaluated through the Measure of Sampling Adequacy (MSA) obtained through the anti-image matrices; all of them were above the 0.50 threshold, and thus no items were candidates for removal at this stage (Hair et al., 2007).
The optimal number of factors was determined based on the Kaiser criteria (>1 eigenvalue), scree-plot interpretation, and finally extracted variance. Accordingly, all rules pointed towards a 6-factor solution accounting for 68.36% of variance. However, 6 items had factorial loadings under 0.50, being potential candidates for removal. These were the following: “I do not feel rewarded for the work I do at my department/Faculty”; “I am happy working at my current department/Faculty”; “Overall, I am happy to be a part of my department/Faculty”; “I do not feel like I belong in this department/Faculty”; “I consider my department/Faculty’s success to be my own success”; and “I am happy with the duties which are assigned to me by the department/Faculty”. These items were removed and a new EFA was conducted. On this second pass, a new item emerged with poor factorial loadings: “People sometimes get uncomfortable with the decisions of my department/Faculty’s leadership”. This item was also removed and an additional EFA conducted. On this final pass, all items met the 0.50 threshold. Five items (“I am satisfied with my current department/Faculty”; “I feel like I am part of my current department/Faculty”; “My current department/Faculty is a place where I am happy to work”; “The leadership of my department/Faculty makes me stressed”; “The leadership of my department/Faculty sometimes makes people feel uncomfortable”) exhibited moderate loadings into other factors (>0.30). It was opted not to remove these items at this stage, but rather re-evaluate their performance during the CFA stage. This final EFA yielded a 6-factor
solution explaining 71.82% of variance. Additionally, Cronbach’s Alpha was computed for each of the factors in order to evaluate internal consistency. Its values ranged from 0.789 (Factor 6) to 0.920 (Factor 1), indicating an overall reliable scale. Table 2 presents the results for this analysis:
<INSERT TABLE 2 HERE>
As the extracted factors did not entirely match the proposed structure, a new interpretation of the factor loadings was conducted. Many of the institutional satisfaction and satisfaction with the leadership, as well as some commitment items, coalesced into Factor 1. Additionally, many of the institution satisfaction items were removed – as previously described – due to poor or ambiguous loadings. As such, Factor 1 can be interpreted to represent a more global satisfaction measure, and was labelled “Institutional Satisfaction and Satisfaction with the Leadership”. Factor 2 contains the 6 items for the funding dimension, and the “Funding” label remained the same. Factor 3 represents the “Social Satisfaction” dimension as it encompasses the 6 predicted items. Half of the items from the freedom dimension loaded into Factor 4, representing aspects more directly related to individual autonomy, led this factor to be labelled as “Individual Autonomy”. Factor 5’s items deal with the willingness to stay in the institution, representing a specific section of the commitment theme. Accordingly, this factor was labelled as “Willingness to Stay”. Finally, Factor 6 contains the other half of the freedom theme’s items, those which relate to bureaucratic tasks and demands. In line with the reverse-scored content of the items, this factor was labelled as “Unconstraint”.
Confirmatory Factor Analysis
Procedure. Following the EFA, a Confirmatory Factor Analysis (CFA) was conducted. This analysis was performed using IBM AMOS 22 (Arbuckle, 2007) and Maximum Likelihood estimation, which is the most commonly used method, and has adequate robustness to deviations from normality (Arbuckle, 2007; Marôco, 2010). At this stage, missing data was
handled through Full-Information Maximum Likelihood (FIML) estimation (Enders and Bandalos, 2001). Model fit was evaluated through the χ2 goodness-of-fit test (Barrett, 2007)
and its X2 statistic (Bentler, 2007), the X2/df index (Arbuckle, 2007), the comparative-fit index
(CFI) (Bentler, 1990) and its parsimony-adjusted variant, PCFI (Marôco, 2010), the root mean square error of approximation (RMSEA) (Steiger et al, 1985), the Akaike Information Criterion (AIC) (Anderson et al, 1998), and the Browne-Cudeck Criterion (BCC) (Marôco, 2010). At each respecification iteration, Modification Indices (MI) (Arbuckle, 2007; Bollen, 2014) were scanned for fit improvement opportunities. Covariances were specified between error terms for manifest variables belonging to the same latent variable whenever such a change yielded a positive fit change with a MI value of 11 or higher, which corresponds to a type I error probability of 0.001 (Marôco, 2010).
Specification. The first attempt at model specification was replicating the factorial structure extracted in the previous EFA. The model exhibited adequate fit but with room for improvement (X2/df = 3.020; CFI = 0.958; PCFI = 0.773; RMSEA = 0.049; P[rmsea ≤ 0.05] <
0.001; AIC = 1285.850; BCC = 1294.129). Further ahead in the analysis of this first model, concerns began to emerge in regards to the validity of this structure, in particular regarding the Institutional Satisfaction and Satisfaction with the Leadership factor, for which the square root of the Average Variance Extracted (AVE) was less than its correlation with the “Willingness to Stay” factor, and also less than its Maximum Shared Variance (MSV). Both of these situations suggested problems with discriminant validity (Hair et al., 2007). At this point, it became evident that some confounding effect was affecting the institutional satisfaction, satisfaction with the leadership, and organizational commitment variables, likely due to some unobserved general satisfaction/commitment variable. This was corroborated by a) the strong correlation between the “Willingness to Stay” and the “Institutional Satisfaction and Satisfaction with the Leadership” (r = 0.81), b) the fact that some of the items had some degree
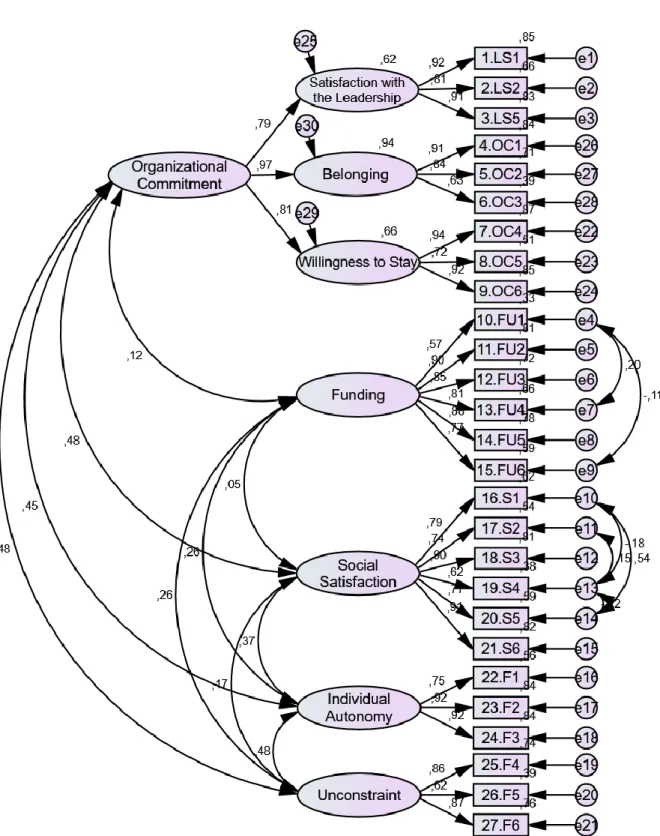
of loading into other factors, as determined in the previous EFA, and c) most of the generalist satisfaction items – which were previously removed – were already exhibiting ambiguous loadings at the EFA stage. Because of this, the factorial structure for these items was re-specified based on the observed correlations, including those proposed by the MIs. First, all of the items which had some degree of loading into other factors (and previously noted in the EFA) were removed from the analysis, with the exception of item OC1 - I feel like I am a part of my current department/Faculty. Items OC2 – I do not feel like I belong in this department/Faculty and OC3 – I consider my department/Faculty’s success to be my own success, which were previously removed in the EFA stage, were reintroduced and placed along with OC1 in a “Belonging” factor. The “Institutional Satisfaction and Satisfaction with the Leadership”, now with only 3 items from the leadership theme, was rebranded “Satisfaction with the Leadership”. A second-order construct (Hair et al., 2007; Marôco, 2010) - “Organizational Commitment” - was created, under which “Belonging”, “Satisfaction with the Leadership”, and “Willingness to Stay” were placed. Respecification of the model in this manner resulted in considerable improvements to model fit (X2/df = 2.561; CFI = 0.972; PCFI
= 0.784; RMSEA = 0.043; P[rmsea ≤ 0.05] < 0.001; AIC = 891.018; BCC = 987.839), which can be considered good or very good depending on the index (Barrett, 2007; Hair et al., 2007; Hooper et al, 2008; Marôco, 2010). Validity issues were also eliminated, as will be described in the next section. Table 3 presents the factorial loadings for the items in this model, and Figure 1 represents the model itself.
<INSERT TABLE 3 HERE>
<INSERT FIGURE 1 HERE>
Validity, Reliability, and Sensitivity. Validity was evaluated in three facets: factorial, convergent, and discriminant validity (Hair et al., 2007; Marôco, 2010). Factorial validity can
be established by having all factorial loadings above 0.50 in all items (Marôco, 2010), which has already been demonstrated in the previous section. Convergent validity was evaluated through the Average Variance Extracted (AVE) indicator (Fornell and Larcker, 1981). AVE must exceed the 0.5 threshold in order to establish convergent validity (Hair et al., 2007), which was also observed for all factors in the model. Finally, discriminant validity can be observed if AVE is equal to or greater than the squared correlation between two factors, and additionally, it must be equal to or greater than both the maximum shared variance and the average shared variance (Hair et al., 2007). As the issues regarding discriminant validity were resolved in a previous iteration of the model, as described in the former section, discriminant validity can be claimed for all factors in the final model.
Reliability, which indicated measurement consistency and replicability (Marôco, 2010) was evaluated through the composite reliability indicator (CR) (Fornell and Larcker, 1981). All of the factors met the proposed 0.7 threshold (Hair et al., 2007), indicating that the instrument is reliable. Finally, sensitivity – which indicates whether or not an instrument can differentiate between individuals (Marôco, 2010) – was evaluated by the distribution of each item. The distribution is considered acceptably normal, and thus indicating sensitivity, if the absolute value for skewness and kurtosis is lower than 3 (Kline, 2011). Again, all items were in accordance to this criteria. Table 4 summarizes this section of the validation exercise:
<INSERT TABLE 4 HERE>
Discussion
Although the final factorial structure of the MDURWI departed slightly from what was originally expected, the final model is conceptually sound and presents a very good fit and measurement properties. In this section, a brief summary on how to interpret scores on each of
the dimensions will be presented. Additionally, the final version of the instrument is provided in appendix (with a non-randomized question order).
The first dimension, Organizational Commitment, is a classic variable in organizational studies (e.g., Meyer and Allen, 1991; Mowday et al, 1979; O’Reilly and Chatman, 1986). It represents the bond between the individual and an organization; and individual scoring high in this factor can be said to experience a strong link with his working place, and has little desire of leaving it. It can be further sub-divided into three lower order factors: Satisfaction with the Leadership, which indicates how the individual perceives his leadership (and reflects on how one feels the leadership treats him or her); Belonging, which indicates how much the individual identifies oneself with the department or Faculty; and Willingness to Stay, which relates to one’s desire to stay in his department/Faculty. Belonging and Willingness to Stay are analogous to the concepts of attitudinal and behavioral commitment (Mowday et al., 1982) in organizational commitment models. The inclusion of Satisfaction with the Leadership as a lower-order factor of this dimension, while not initially planned, is not unexpected – previous studies have found very strong correlations between the type of leadership and organizational commitment (Avolio et al, 2004; Chiok Foong Loke, 2001; Nguni et al, 2006; Yousef, 2000). In light of this, it is plausible that Satisfaction with the Leadership is acting as a proxy for normative commitment, the third concept in Mowday et al’s (1982) model of organizational commitment.
The second dimension, Individual Autonomy, relates to the degree of independence an individual has in his current occupation. An individual with a high score in this factor can be said to have a greater freedom to conduct work in an independent manner. This is something that should be expected in creativity-driven environments (Hemlin et al., 2008; Marginson, 2008), but is not always guaranteed (Latour and Woolgar, 2013). It is closely related to the concept of Unconstraint, which is the lack of institutional pressure to conduct tasks and services
unrelated to research. An individual scoring high in Unconstraint has little pressure from his institution to participate in such tasks. This is an important consideration since these institutional pressures have been on the rise, with a negative impact on the perceived relationship between individual and institution (Cuthbert, 1996; Henkel, 2000; Tierney, 1999).
The following factor, Social Satisfaction, relates to the quality of co-worker interactions. An individual scoring high in this factor is happy to work with his colleagues and recognizes them to be competent, as well as recognizing the importance of such interactions. This is considered positive because such interactions lay the groundwork for collaborations which are very desirable in modern science and lead to a variety of positive work-related outcomes (Horta and Santos, 2015; Katz and Martin, 1997). The quality of social interactions is also correlated with the degree of organizational commitment, in accordance with the literature (Madsen et al., 2005). Finally, the factor Funding, relates to the availability of funding which the individual can use. Funding is a critical component of research and lack of it can have various ramifications (Bourdieu, 1999; Ebadi and Schiffauerova, 2015). An individual scoring high in this factor can be said to have access to much funding.
Conclusion
The MDURWI represents a new way of measuring a variety of work-related dimensions in academic research settings through a simple “all-in-one” questionnaire. The lack of an instrument of this kind has been previously noted in the literature (e.g., Blackburn and Lawrence, 1995) and partly explains the absence of research of these aspects in research workplaces. The development of this instrument offers new opportunities for researchers engaged in science and technology studies or higher education studies, while also creating a new way for universities to measure some of their own organizational dimensions. With that said, it is important to consider the methodological limitations of the present study.
First, the instrument validation was conducted in a sample restricted to academic researchers performing research in the field of higher education. This was a methodological choice with the goal of mitigating inter-field variability; however, it also means that at present time, it is unknown whether or not the results will be replicated in samples from radically different fields. Further validation exercises are being planned across other fields in order to address this concern. Additionally, the diversity inherent to the field of higher education (as described in the first section of this article) serves as a double-edged sword. On one hand, it may mean that a great deal of diversity and its information is incorporated into the model, making it as wide-ranging in applicability as possible. On the other hand, it can also mean that some sensitivity might have been sacrificed by making the model more generalist, in the sense that applying it to specific communities within the field might yield skewed response distributions. Naturally, this a more practical consideration, which can strengthen or weaken the instrument depending on what the focus of research and intended use is, and thus must be kept in mind for academic researchers intending to use it in their own endeavors. Second, the fact that the items dedicated to job satisfaction alone were removed during the analysis due to confounded factorial loadings is unfortunate, but not unexpected – previous studies have shown that job satisfaction is very strongly correlated with organizational commitment (Dirani and Kuchinke, 2011; Veličković et al., 2014), which explains why items originally from both themes loaded into the same factor, and also why such a factor evidenced validity concerns later on. Thus, general job satisfaction could arguably be measured through a composite score computed from some of the items in the current study, but such an endeavor is likely best left for a future revision of the instrument. On a similar note, in the current version the planned resources measure is limited to financial resources, i.e., funding. Since resources as a concept encompasses a far larger scope (e.g., human resources, facilities) it is important that this dimension is expanded in future work. Furthermore, the satisfaction with leadership scale does
not fully explore the concept of leadership. In future versions, it would be relevant to add measures for different leadership styles using one of the many existing models (e.g., Eagly et al., 2003). Third, although the choice of themes included in this instrument was planned to be as broad as possible, it does not cover every possible organizational variable, and as such it is likely that equally important variables were left out of the current version. It is hoped that, through presentations and usage of this instrument, the feedback obtained through the scientific community will allow further improvements to the instrument in future revisions, such as adding other dimensions in order to improve the instrument’s coverage of organizational aspects in the academia.
References
Abdi, H. (2003) ‘Factor rotations in factor analyses’, in Encyclopedia for Research Methods
for the Social Sciences, Thousand Oaks, CA: Sage, pp. 792–795.
Abouchedid, K., and Abdelnour, G. (2015) ‘Faculty research productivity in six Arab countries’, International Review of Education 61(5): 673–690.
Allen, N. J., and Meyer, J. P. (1990) ‘The measurement and antecedents of affective,
continuance and normative commitment to the organization’, Journal of Occupational
and Organizational Psychology 63(1): 1-18.
Alonderiene, R., and Majauskaite, M. (2016) ‘Leadership style and job satisfaction in higher education institutions’, International Journal of Educational Management 30(1): 140–164.
Altbach, P. G., Bozeman, L. A., Janashia, N. and Rumbley, L. E. (eds) (2006) Higher
Education: A Worldwide Inventory of Centers and Programs, Rotterdam: Sense
Publishers.
Amabile, T. M., Conti, R., Coon, H., Lazenby, J., and Herron, M. (1996) ‘Assessing the work environment for creativity’, Academy of Management Journal 39(5): 1154-1184. Anderson, D., Burnham, K., and White, G. (1998) ‘Comparison of Akaike information
criterion and consistent Akaike information criterion for model selection and statistical inference from capture-recapture studies’, Journal of Applied Statistics 25(2): 263–282.
Arbuckle, J. (2007) Amos 16.0 user’s guide, Chicago, IL: SPSS.
Ashwin, P., Deem, R., and McAlpine, L. (2016) ‘Newer researchers in higher education: policy actors or policy subjects?’, Studies in Higher Education 41(12): 2184-2197. Avolio, B. J., Zhu, W., Koh, W., and Bhatia, P. (2004) ‘Transformational leadership and
moderating role of structural distance’, Journal of Organizational Behavior 25(8): 951–968.
Babakus, E., Cravens, D. W., Johnston, M., & Moncrief, W. C. (1996) ‘Examining the role of organizational variables in the salesperson job satisfaction model’, Journal of
Personal Selling and Sales Management 16(3): 33-46.
Barrett, P. (2007) ‘Structural equation modelling: Adjudging model fit’, Personality and
Individual Differences 42(5): 815–824.
Bentler, P. M. (1990) ‘Comparative fit indexes in structural models’, Psychological Bulletin 107(2): 238.
Bentler, P. M. (2007) ‘On tests and indices for evaluating structural models’, Personality and
Individual Differences 42(5): 825–829.
Blackburn, R. T., and Lawrence, J. H. (1995) Faculty at work: Motivation, expectation,
satisfaction, Baltimore: Johns Hopkins University Press.
Böckerman, P., and Ilmakunnas, P. (2012) ‘The job satisfaction-productivity nexus: A study using matched survey and register data’, Industrial and Labor Relations Review 65(2): 244–262.
Bollen, K. A. (2014) Structural equations with latent variables, New York: John Wiley & Sons.
Bourdieu, P. (1999) ‘The specificity of the scientific field’ in M. Biagioli (ed.) The Science
Studies Reader, New York: Routledge, pp. 31–50.
Cattaneo, M., Meoli, M., Signori, A. (2016) Performance-based funding and university research productivity: the moderating effect of university legitimacy, Journal of Technology Transfer 41 (1): 85-104.
Chen, S. and Hu, L. (2012) Higher Education Research As A Field in China: Its Formation and Current Landscape. Higher Education Research and Development, 31 (5), pp. 655–666.
Chiok Foong Loke, J. (2001) ‘Leadership behaviours: effects on job satisfaction, productivity and organizational commitment’, Journal of Nursing Management 9(4): 191–204. Clark, B.R. (1995) Places of Inquiry: Research and Advanced Education in Modern
Universities. Berkeley: University of California Press.
Cuthbert, R. (1996) Working in Higher Education, Bristol, PA: Taylor and Francis.
Dirani, K. M., and Kuchinke, K. P. (2011) ‘Job satisfaction and organizational commitment: validating the Arabic satisfaction and commitment questionnaire (ASCQ), testing the correlations, and investigating the effects of demographic variables in the Lebanese banking sector’, The International Journal of Human Resource Management 22(05): 1180–1202.
Dobele, A. R., and Rundle‐Theile, S. (2015) ‘Progression through Academic Ranks: A Longitudinal Examination of Internal Promotion Drivers’, Higher Education
Quarterly 69(4): 410–429.
Eagly, A. H., Johannesen-Schmidt, M. C., and van Engen, M. L. (2003) ‘Transformational, transactional, and laissez-faire leadership styles: a meta-analysis comparing women and men’, Psychological Bulletin 129(4): 569-591.
Ebadi, A., and Schiffauerova, A. (2015) ‘How to become an important player in scientific collaboration networks?’, Journal of Informetrics 9(4): 809–825.
Ek, A. C., Ideland, M., Jönsson, S., and Malmberg, C. (2013) ‘The tension between
marketisation and academisation in higher education’, Studies in Higher Education 38(9): 1305-1318.
Enders, C. K., and Bandalos, D. L. (2001) ‘The relative performance of full information maximum likelihood estimation for missing data in structural equation models’,
Structural Equation Modeling 8(3): 430–457.
Findlow, S. (2012) ‘Higher education change and professional-academic identity in newly “academic”disciplines: the case of nurse education’, Higher Education 63(1): 117– 133.
Fornell, C., and Larcker, D. F. (1981) ‘Evaluating structural equation models with unobservable variables and measurement error’, Journal of Marketing Research 18(1): 39–50.
Gil, F., Alcover, C.-M., Peiró, J.-M., Gil, F., Rico, R., Alcover, C. M., and Barrasa, Á. (2005) ‘Change-oriented leadership, satisfaction and performance in work groups: Effects of team climate and group potency’, Journal of Managerial Psychology 20(3/4): 312– 328.
Hair, J. F., Black, W. C., Babin, B. J., Anderson, R. E., and Tatham, R. L. (2007)
Multivariate Data Analysis;New Delhi: Pearson Education..
Harland, T. (2012) ‘Higher Education as an Open-Access Discipline’, Higher Education
Research and Development 31(5): 703–710.
Hemlin, S., Allwood, C. M., and Martin, B. R. (2008) ‘Creative knowledge environments’,
Creativity Research Journal 20(2): 196–210.
Henkel, M. (2000) Academic Identities and Policy Change In Higher Education. Higher
Education Policy Series; London: Jessica Kingsley Publishers.
Hersey, P., Blanchard, K. H., and Johnson, D. E. (1969) Management Of Organizational
Behavior, Englewood Cliffs, NJ: Prentice-Hall.
Higgs, M. J., and Dulewicz, S. V. (2003) The design of a new instrument to assess leadership
Hoffman, D. M. (2009) ‘Changing Academic Mobility Patterns and International Migration What Will Academic Mobility Mean in the 21st Century?’, Journal of Studies in
International Education 13(3): 347–364.
Hooper, D., Coughlan, J., and Mullen, M. (2008) ‘Structural equation modelling: Guidelines for determining model fit’, Electronic Journal of Business Research Methods 6(1): 53-60.
Horta, H., Dautel, V., and Veloso, F. M. (2012) ‘An output perspective on the teaching– research nexus: an analysis focusing on the United States higher education system’,
Studies in Higher Education 37(2): 171–187.
Horta, H., and Lacy, T. A. (2011) ‘How does size matter for science? Exploring the effects of research unit size on academics’ scientific productivity and information exchange behaviors’, Science and Public Policy 38(6): 449–460.
Horta, H., and Martins, R. (2014) ‘The start-up, evolution and impact of a research group in a university developing its knowledge base’, Tertiary Education and Management 20(4): 280–293.
Horta, H., and Santos, J. M. (2015) ‘The Impact of Publishing During PhD Studies on Career Research Publication, Visibility, and Collaborations’ Research in Higher Education 57(1): 28-50.
Jacob, J., and Lamari, M. (2012) ‘Determinanty produktivnosti nauchnykh issledovanii v sfere vysshego obrazovaniya: empiricheskii analiz [Factors Influencing Research Performance in Higher Education: An Empirical Investigation], Foresight-Russia 6(3): 40–50.
Jemielniak, D., and Greenwood, D. J. (2015) ‘Wake Up or Perish Neo-Liberalism, the Social Sciences, and Salvaging the Public University’, Cultural Studies↔Critical
Jing, L., and Zhang, D. (2014) ‘Does Organizational Commitment Help to Promote University Faculty’s Performance and Effectiveness?’ The Asia-Pacific Education
Researcher 23(2): 201–212.
Jung, J. (2014) ‘Research productivity by career stage among Korean academics. Tertiary
Education and Management’ 20(2): 85–105.
Katz, J. S., and Martin, B. R. (1997) ‘What is research collaboration?’, Research Policy 26(1): 1–18.
Kauppinen, I., and Kaidesoja, T. (2014) ‘A shift towards academic capitalism in Finland’,
Higher Education Policy 27(1): 23–41.
Kerlin, S. P., and Dunlap, D. M. (1993) ‘For richer, for poorer: Faculty morale in periods of austerity and retrenchment’, Journal of Higher Education 64(3): 348–377.
Kessler, S. R., Spector, P. E., & Gavin, M. B. (2014) ‘Critical Look at Ourselves: Do Male and Female Professors Respond the Same to Environment Characteristics?’, Research
in Higher Education 55(4): 351–369.
Kim, Y., Horta, H., and Jung, J. (2017) ‘Higher Education research in Hong Kong, Japan, China and Malaysia: exploring research community cohesion and the integration of thematic approaches’, Studies in Higher Education 42(1): 149-168.
Kline, R. B. (2011) Principles and practice of structural equation modelling, New York: The Guilford Press.
Kuzhabekova, A., Hendel, D. D., and Chapman, D. W. (2015) ‘Mapping Global Research on International Higher Education’, Research in Higher Education 56(8): 861–882. Kwan, B. S. C. (2013) ‘Facilitating novice researchers in project publishing during the
doctoral years and beyond: a Hong Kong-based study’ Studies in Higher Education 38(2): 207–225.
Latour, B., and Woolgar, S. (2013) Laboratory life: The construction of scientific facts, Princeton, NJ: Princeton University Press.
Leisyte, L. (2016) New public management and research productivity- a precarious state of affairs of academic work in the Netherlands. Studies in higher education 41(5). 828 – 846.
Leisyte, L., Enders, J., and de Boer, H. (2008) ‘The freedom to set research agendas—illusion and reality of the research units in the Dutch universities’, Higher Education Policy 21(3): 377–391.
Lok, P., and Crawford, J. (2004) ‘The effect of organisational culture and leadership style on job satisfaction and organisational commitment: A cross-national comparison’,
Journal of Management Development 23(4): 321–338.
Machado-Taylor, M., White, K. and Gouveia, O (2014) ‘Job Satisfaction of Academics: Does Gender Matter?’, Higher Education Policy 27(3): 363–384.
Macfarlane, B. (2012) ‘The higher education research archipelago’, Higher Education
Research and Development 31(1): 129–131.
McNeece, C. A. (1981) ‘Faculty publications, tenure, and job satisfaction in graduate social work programs’, Journal of Education for Social Work 17(3): 13–19.
Madsen, S. R., Miller, D., and John, C. R. (2005) ‘Readiness for organizational change: Do organizational commitment and social relationships in the workplace make a
difference?’, Human Resource Development Quarterly 16(2): 213–234.
Marginson, S. (2008) ‘Academic creativity under new public management: Foundations for an investigation’, Educational Theory 58(3): 269–287.
Maroco, J. (2003) Análise estatística: com utilização do SPSS [Statistical analysis using
Marôco, J. (2010) Análise de equações estruturais: Fundamentos teóricos, software and
aplicações [Structural equations analysis: theoretical fundamentals, software, and applications. Lisbon: ReportNumber, Lda.
Meyer, J. P., and Allen, N. J. (1991) ‘A three-component conceptualization of organizational commitment’, Human Resource Management Review 1(1): 61–89.
Mowday, R. T., Porter, L. W., and Steers, R. (1982) Employee-organization linkages: the
psychology of commitment, absenteeism, and turnover, New York: Academic Press.
Mowday, R. T., Steers, R. M., and Porter, L. W. (1979) ‘The measurement of organizational commitment’, Journal of Vocational Behavior 14(2): 224–247.
Nguni, S., Sleegers, P., and Denessen, E. (2006) ‘Transformational and transactional leadership effects on teachers’ job satisfaction, organizational commitment, and organizational citizenship behavior in primary schools: The Tanzanian case’, School
Effectiveness and School Improvement 17(2): 145–177.
O’Reilly, C. A., and Chatman, J. (1986) ‘Organizational commitment and psychological attachment: The effects of compliance, identification, and internalization on prosocial behavior’, Journal of Applied Psychology 71(3): 492.
Peluchette, J. V. E. (1993) ‘Subjective career success: The influence of individual difference, family, and organizational variables’, Journal of Vocational Behavior 43(2): 198-208. Pepper, C., and Giles, W. (2015) ‘Leading in middle management in higher education’,
Management in Education 29(2): 46–52.
Podsakoff, P. M., MacKenzie, S. B., and Bommer, W. H. (1996) ‘Transformational leader behaviors and substitutes for leadership as determinants of employee satisfaction, commitment, trust, and organizational citizenship behaviors’, Journal of Management 22(2): 259–298.
Podsakoff, P. M., MacKenzie, S. B., Moorman, R. H., and Fetter, R. (1990)
‘Transformational leader behaviors and their effects on followers’ trust in leader, satisfaction, and organizational citizenship behaviors’, The Leadership Quarterly 1(2): 107–142.
Polanyi, M. (2000) ‘The republic of science: Its political and economic theory’, Minerva 38(1): 1-21.
Rammstedt, B., and John, O. P. (2007) ‘Measuring personality in one minute or less: A 10-item short version of the Big Five Inventory in English and German’, Journal of
Research in Personality 41(1): 203–212.
Ren, K., and Li, J. (2013) ‘Academic freedom and university autonomy: A higher education policy perspective’, Higher Education Policy 26(4): 507-522.
Roberts, K., Miles, R. E., and Blankenship, L. V. (1968) ‘Organizational Leadership Satisfaction and Productivity: A Comparative Analysis’, Academy of Management
Journal 11(4): 401–411.
Schyns, B.,and von Collani, G. (2002) ‘A new occupational self-efficacy scale and its relation to personality constructs and organizational variables’, European Journal of Work
and Organizational Psychology 11(2): 219-241.
Shattock, M. (2014) ‘Can we still speak of there being an academic profession?’, History of
Education 43(6): 727–739.
Shin, J. C., and Jung, J. (2014) ‘Academics job satisfaction and job stress across countries in the changing academic environments’, Higher Education 67(5): 603–620.
Slade, C.P., Ribando, S.J., and Fortner, C.K. (2016) ‘Faculty research following merger: a job stress and social identity theory perspective’ Scientometrics 107(1): 71-89.
Spector, P. E. (1994) Job satisfaction survey, Tampa, FL: Department of Psychology, University of South Florida.
Stahl, M. J., and Koser, M. C. (1978) ‘Weighted productivity in R & D: Some associated individual and organizational variables’, IEEE Transactions on Engineering
Management 25(1):20-24.
Steiger, J. H., Shapiro, A., and Browne, M. W. (1985) ‘On the multivariate asymptotic distribution of sequential chi-square statistics’, Psychometrika 50(3): 253–263. Teichler, U. (1996) ‘Comparative higher education: Potentials and limits’, Higher Education
32(4): 431–465.
Teichler, U., Arimoto, A., and Cummings, W. K. (2013) The changing academic profession, Dordrecht: Springer.
Terpstra, D. E., Olson, P. D., and Lockeman, B. (1982) ‘The effects of MBO on levels of performance and satisfaction among university faculty’ Group and Organization
Management 7(3): 353–366.
Tierney, W. G. (1999) Faculty productivity: Facts, fictions and issues (Vol. 15), New York : Falmer Press.
Tigelaar, D. E., Dolmans, D. H., Wolfhagen, I. H., and van der Vleuten, C. P. (2004) ‘The development and validation of a framework for teaching competencies in higher education’, Higher Education 48(2): 253–268.
Tight, M. (2012) Researching Higher Education, Maidenhead: Open University Press. Veličković, V. M., Višnjić, A., Jović, S., Radulović, O., Šargić, Č., Mihajlović, J., and
Mladenović, J. (2014) ‘Organizational commitment and job satisfaction among nurses in Serbia: A factor analysis’, Nursing Outlook 62(6): 415–427.
Young, M. (2015) ‘Competitive funding, citation regimes, and the diminishment of breakthrough research’, Higher Education 69(3): 421–434.
Yousef, D. A. (2000) ‘Organizational commitment: a mediator of the relationships of
leadership behavior with job satisfaction and performance in a non-western country’,
Journal of Managerial Psychology 15(1): 6–24.
Webber, K. (2012) ‘Research productivity of foreign-and US born faculty: differences by time on task’ Higher Education 64(5): 709-729.
Tables
Table 1
Initial question pool for the MDURWI
Code Item Scoring
Institutional Satisfaction
IS1 I am happy working at my current department/Faculty. True
IS2 I am happy with the duties which are assigned to me by the department/Faculty. True
IS3 Overall, I am happy to be a part of my department/Faculty. True
IS4 I do not feel rewarded for the work I do at my department/Faculty. Reverse
IS5 I am satisfied with my current department/Faculty. True
IS6 My current department/Faculty is a place where I am happy to work. True
Organizational Commitmment
OC1 I feel like I am a part of my current department/Faculty. True
OC2 I do not feel like I belong in this department/Faculty. Reverse
OC3 I consider my department/Faculty’s success to be my own success. True
OC4 I would be happy to spend the rest of my career in this department/Faculty. True
OC5 I would not expect to spend the rest of my career in this department/Faculty. Reverse OC6 Spending the rest of my career in this department/Faculty would be a good thing. True
Satisfaction with the Leadership
LS1 The leadership of my department/Faculty is considerate towards the people who work in it.
True
LS2 The leadership of my department/Faculty understands my concerns. True
LS3 The leadership of my department/Faculty sometimes makes people feel uncomfortable.
Reverse
LS4 The leadership of my department/Faculty makes me stressed. Reverse
LS5 The leadership of my department/Faculty treats its employees kindly. True
LS6 People sometimes get uncomfortable with the decisions of my department/Faculty’s leadership.
Reverse Social Satisfaction
SS1 I have good relations with my peers. True
SS2 I recognize my peers to be highly competent. True
SS3 I enjoy working with my peers. True
SS4 My peers give me great research ideas. True
SS5 I am on good terms with my peers. True
SS6 Working with my peers is a pleasure. True
Freedom
F1 I do not have much autonomy in my work. Reverse
F2 I feel like I have a great deal of autonomy in my work. True
F3 I have a significant amount of autonomy in what I do. True
F4 My work is constrained by my department/Faculty’s demands. Reverse
F5 I spend a lot of time handling the bureaucratic aspects of my department/Faculty. Reverse
F6 My department/Faculty’s demands constrain my work. Reverse
Funding
FU1 I have access to considerable amount of resources. True
FU2 Obtaining research funding is not a problem for me. True
FU3 I never had problems regarding research funding. True
FU4 I have no shortage of research funding. True
FU5 I do not have problems in obtaining research funding. True
Table 2
Exploratory Factor Analysis with oblique rotation
Code Item Factor Loading
1 2 3 4 5 6
LS5 The leadership of my department/Faculty treats its employees kindly.
.90 .03 -.02 .05 .01 -.02
LS1 The leadership of my department/Faculty is considerate towards the people who work in it.
.90 -.01 -.05 .09 .03 -.03
LS2 The leadership of my department/Faculty understands my concerns.
.82 -.01 .04 .02 -.02 .04
OC1 I feel like I am a part of my current department/Faculty.
.56 .02 .15 .10 -.16 .35
IS5 I am satisfied with my current department/Faculty. .55 .07 .13 .07 -.02 .37
LS4 The leadership of my department/Faculty makes me
stressed.*
.54 -.05 -.01 -.05 .43 .07
IS6 My current department/Faculty is a place where I am happy to work.
.53 .04 .14 .12 -.06 .37
LS3 The leadership of my department/Faculty sometimes makes people feel uncomfortable.*
.50 -.02 .05 -.16 .44 -.01
FU5 I do not have problems in obtaining research funding. .06 .89 -.05 .00 .02 -.07
FU2 Obtaining research funding is not a problem for me. -.01 .89 -.03 .05 .00 .01
FU3 I never had problems regarding research funding. .00 .87 -.08 .04 .00 -.01
FU4 I have no shortage of research funding. -.06 .87 .05 -.03 .06 -.04
FU6 Research funding is not an issue for me. -.01 .82 -.05 -.08 -.01 .04
FU1 I have access to considerable amount of resources. .02 .63 .15 .11 -.02 .05
SS6 Working with my peers is a pleasure. -.05 -.03 .91 .00 .03 .01
SS3 I enjoy working with my peers. -.07 -.05 .91 .02 .01 .03
SS1 I have good relations with my peers. .05 -.08 .81 .12 -.03 -.05
SS5 I am on good terms with my peers. .02 -.05 .79 .15 -.02 -.05
SS2 I recognize my peers to be highly competent. -.01 .00 .78 .02 .03 .03
SS4 My peers give me great research ideas. .03 .15 .71 -.22 .01 .01
F3 I have a significant amount of autonomy in what I do. .05 .07 .04 .89 -.02 .00
F2 I feel like I have a great deal of autonomy in my work.
.06 .08 .02 .88 .04 -.02
F1 I do not have much autonomy in my work.* -.01 -.05 .01 .76 .20 .04
F6 My department/Faculty’s demands constrain my
work.*
.03 .04 .03 .14 .79 .06
F5 I spend a lot of time handling the bureaucratic aspects of my department/Faculty.*
-.08 .05 -.04 .05 .78 .03
F4 My work is constrained by my department/Faculty’s
demands.*
.06 .04 .06 .11 .77 .07
OC5 I would not expect to spend the rest of my career in this department/Faculty.*
-.14 -.03 -.07 -.02 .11 .91
OC4 I would be happy to spend the rest of my career in this department/Faculty.
.13 .01 .06 .04 -.02 .84
OC6 Spending the rest of my career in this department/Faculty would be a good thing.
.15 .02 .04 .00 .00 .82
Note: standardized loadings from Direct Oblimin rotation are reported. Bolded values indicate the factor with the highest loading.
Table 3
Factorial loadings for the MDURWI
Code Item Factor
Loading Organizational Commitment - Leadership Satisfaction
1.LS1 The leadership of my department/Faculty is considerate towards the people who work in it.
.92
2.LS2 The leadership of my department/Faculty understands my concerns. .81
3.LS5 The leadership of my department/Faculty treats its employees kindly. .91
Organizational Commitment - Belonging
4.OC1 I feel like I am a part of my current department/Faculty. .91
5.OC2 I do not feel like I belong in this department/Faculty. .84*
6.OC3 I consider my department/Faculty’s success to be my own success. .63
Organizational Commitment - Willingness to Stay
7.OC4 I would be happy to spend the rest of my career in this department/Faculty. .94
8.OC5 I would not expect to spend the rest of my career in this department/Faculty. .72* 9.OC6 Spending the rest of my career in this department/Faculty would be a good
thing.
.92 Resources
10.FU1 I have access to considerable amount of resources. .57
11.FU2 Obtaining research funding is not a problem for me. .90
12.FU3 I never had problems regarding research funding. .85
13.FU4 I have no shortage of research funding. .81
14.FU5 I do not have problems in obtaining research funding. .88
15.FU6 Research funding is not an issue for me. .77
Social Satisfaction
16.SS1 I have good relations with my peers. .79
17.SS2 I recognize my peers to be highly competent. .74
18.SS3 I enjoy working with my peers. .90
19.SS4 My peers give me great research ideas. .62
20.SS5 I am on good terms with my peers. .77
21.SS6 Working with my peers is a pleasure. .91
Autonomy
22.F1 I do not have much autonomy in my work. .75*
23.F2 I feel like I have a great deal of autonomy in my work. .92
24.F3 I have a significant amount of autonomy in what I do. .92
Unconstraint
25.F4 My work is constrained by my department/Faculty’s demands. .86*
26.F5 I spend a lot of time handling the bureaucratic aspects of my department/Faculty.
.62*
27.F6 My department/Faculty’s demands constrain my work. .87*
Table 4
Validity and reliability
Factor Composite Reliability Average Variance Extracted Maximum Shared Variance Average Shared Variance Organizational Commitment .904 .761 .241 .176 Individual Autonomy .899 .749 .227 .160 Unconstraint .833 .630 .241 .142 Social Satisfaction .909 .629 .239 .103 Funding .917 .653 .072 .040
Figures
Fig. 1. Measurement model for the MDURWI with standardized regression weights (loadings). Note: ellipses
indicate latent variables, and squares indicate manifest variables. Disturbance terms are indicated by the latent variables labeled “e.”
Appendix A
Multi-Dimensional University Research Workplace Inventory (MDURWI)
You will now be asked a series of questions regarding some aspects of your work, specifically your current department or Faculty. To respond to this questionnaire, read each statement carefully and decide how much do you agree with each of them. For each statement, check one of the 7 boxes next to the corresponding item. If you don’t know or a particular sentence does not apply to you, check the N/A box.
There are no right or wrong answers. Please read each statement and check the box which best applies to you.
How much do you agree with the following statements?
Completely disagree Strongly disagree Disagree Neither agree nor disagree Agree Strongly agree Completely agree N/A 1. The leadership of my department/Faculty is considerate towards the people who work in it.
2. The leadership of my
department/Faculty understands my concerns.
3. The leadership of my
department/Faculty treats its employees kindly.
4 I feel like I am a part of my current department/Faculty.
5. I do not feel like I belong in this department/Faculty.
6. I consider my department/Faculty’s success to be my own success. 7. I would be happy to spend the rest of
my career in this department/Faculty. 8. I would not expect to spend the rest of
my career in this department/Faculty. 9. Spending the rest of my career in this department/Faculty would be a good thing.
10. I have access to considerable amount of resources.
11. Obtaining research funding is not a problem for me.
12. I never had problems regarding research funding.
13. I have no shortage of research funding. 14. I do not have problems in obtaining
research funding.
15. Research funding is not an issue for me.
17. I recognize my peers to be highly competent.
18. I enjoy working with my peers. 19. My peers give me great research ideas. 20. I am on good terms with my peers. 21. Working with my peers is a pleasure. 22. I do not have much autonomy in my
work.
23. I feel like I have a great deal of autonomy in my work.
24. I have a significant amount of autonomy in what I do. 25. My work is constrained by my
department/Faculty’s demands. 26. I spend a lot of time handling the
bureaucratic aspects of my department/Faculty.
27. My department/Faculty’s demands