Carlos Pestana Barros & Nicolas Peypoch
A Comparative Analysis of Productivity Change in Italian and Portuguese Airports
WP 006/2007/DE _________________________________________________________
João C. Lopes, Tanya Araújo, João Dias & João F. Amaral
National industry cluster templates and the structure of
industry output dynamics: a stochastic geometry approach
WP 20/2010/DE/UECE _________________________________________________________
Department of Economics
W
ORKINGP
APERSISSN Nº 0874-4548
National industry cluster templates and the structure of industry output
dynamics: a stochastic geometry approach
JOÃO C. LOPES, TANYA ARAÚJO, JOÃO DIAS and JOÃO F. AMARAL
ISEG (School of Economics and Management) - Technical University of Lisbon and UECE (Research Unit on Complexity and Economics)
ABSTRACT Cluster analysis has been widely used in an Input-Output framework, with the main objective of uncover the structure of production, in order to better identify which sectors are strongly connected with each other and choose the key sectors of a national or regional economy. There are many empirical studies determining potential clusters from interindustry flows directly, or from their corresponding technical (demand) or market (supply) coefficients, most of them applying multivariate statistical techniques. In this paper, after identifying clusters this way, and since it may be expected that strongly (interindustry) connected sectors share a similar growth and development path, the structure of sectoral dynamics is uncovered, by means of a stochastic geometry technique based on the correlations of industry outputs in a given period of time. An application is made, using Portuguese input-output data, and the results do not clearly support this expectation.
Keywords: Clusters, Input-output analysis, Industry output dynamics
JEL Classification: C57; D67
1. Introduction
Cluster analysis is a useful methodology in industrial and regional economics that has
been an active field of academic research and practical (economic policy) applications
particularly after the well known works of Porter (1990, 1998)1.
Cluster techniques have been widely used in an Input-Output framework with the
main objective of uncover the structure of production, in order to better identify which
sectors are strongly connected with each other and choose the key sectors of a national or
regional economy.
Since the pioneering approaches of Czamansky (1974) and Czamansky and Ablas
(1979), many empirical studies have tried to determine the potential clusters from
interindustry flows directly, or from their corresponding technical (demand) or market
(supply) coefficients.
An interesting example is Hoen (2002) that, after reviewing the traditional
methods of (simple) maximization and restricted maximization, applies a more elaborate
method based on a block diagonal matrix or the so called diagonalization method (using
results from Dietzenbacher, 1996).
More recently, Díaz et al (2006) searching for key sectors in an economy use a
fuzzy clustering approach and Morrillas and Díaz (2008) deal with the problem of
apply the topological principles of the Atkin Q-analysis to the identification of clusters of
industries in input-output systems, and Titze et al (2009) use the Qualitative Input-Output
Analysis proposed by Schnabl (1994) to identify regional industrial clusters in Germany,
along the lines of Aroche-Reys (2003).
Another interesting methodology, used in this paper to identify mutually
exclusive intersectoral (static) clusters, is the multivariate statistical technique (factor
analysis) proposed by Feser and Bergman (2000), applied by Akgüngör et al (2003) and
recently improved in Kelton et al (2008). This technique, based on a principal component
analysis extracted from a matrix of 'maximum correlation coefficients' between each pair
of (input-output) sectors, is briefly described in section 2.
But our strategy to find sectoral clusters and understand its economic importance
is broader in scope. One important issue for the input-output approach to cluster analysis
is the connection - if any - between the static network of relationships among
agents/sectors and the dynamic behavior of those agents/sectors.
Should we expect that the sectors that compose a cluster as a static entity show
similar or at least connected growth paths along a given period of time? Putting it in
another way, do static clusters originate “dynamic” clusters? At first sight the answer is
"yes". However there are several reasons to explain that a static cluster may not share the
same characteristics of a “dynamic” one, and vice-versa. For instance, in this paper the
inputs), and not the sales to final demand (final consumption, investment, exports). On
the other hand, “dynamic” clusters are based on the correlations between sectoral (gross)
outputs, therefore considering all the kinds of sales, not only interindustry sales. A second
reason concerns the absence, in the static version of the clustering identification, of
technological changes that are a central feature of the dynamic procedure. It is also
possible the existence of spurious correlations between sectors that generate a “dynamic
cluster”, when in reality this is not a true “economic” cluster, but only a "statistical" one.
The absence of a space or geographical content of the static and dynamic clusters
treated in this work can also explain the lack of mutual consistency, because important
aspects are missing, namely the localized or regional dynamics, economies of scale and
scope, knowledge based advantages, trust and social capital, and the synchronization of
regional business cycles. For an interesting review of the evolution of the Cluster
Literature, along all these (and other) dimensions, using bibliometric tools, see Cruz and
Teixeira (2009). A
However, if static and “dynamic” clusters are coincident this suggests that clusters
have a long term coherence and persistence. The main purpose of this paper is to study
for the Portuguese economy the empirical evidence supporting the assumption that
sectors that are connected in a static cluster share a common or at least a close economic
trajectory. For that purpose, after identifying the static clusters with the factor analysis
described in section 2, we use a stochastic geometry approach to uncover the structure of
cloud of points in a low-dimensional space suggests evidence for sectoral dynamics and
provides a graphic description of the ensemble. Moreover, from the geometrical
representation of the economic space of sectors we are able to obtain a topological
description of a network of industrial sectors, in such a way that the structure of the
productive system itself displays patterns of behavior, which defines the collective
dynamics. This method is used to graphically assess the importance of national industry
cluster templates as drivers of sectoral output performance. And finally, section 4
summarizes and concludes.
2. The identification of national industry cluster templates
There are several techniques to arrange combinations of sectors using input-output tables.
Most of them are based in the interindustry (domestic) flows or in their corresponding
technical (intermediate consumptions) and supply (intermediate sales) coefficients (Hoen,
2002).
This paper follows the factor-analysis technique, proposed by Feser and Bergman
(2000) and recently improved in Kelton et al (2008). For each pair of sectors, k and l,
there are always four potential relationships: i) k buys directly or indirectly from l; ii) k
sells directly or indirectly to l; iii) k and l have similar purchase patterns from other
sectors; iv) k and l have similar sales patterns to other sectors.
Let zij be the value of the intermediate sales of sector i to sector j, qi the value of
value. The intersectoral relationships can be quantified by mean of the following four coefficients: j ij ij q z x = ,
i ji ji
q z x = ,
i ij ij
s z y = ,
j ji ji s z y = ij
x ,xji represent relative purchasing links (a large value of xijindicating that
sector j depends on sector i as a source for a large proportion of its total intermediate
inputs).
ij
y ,yji represent relative sales links (a large value of yijsuggesting that sector i
depends on sector j as a market for a large proportion of its total intermediate good sales).
Let xl be the vector of all the relative purchasing links of sector l and ykthe
vector of all the relative sales links of sector k. The similarities in interindustry structure
between sectors k and l can be revealed in a correlation analysis, using the following
correlation coefficients:
) (xk xl
r ⋅ - measuring the degree to which sectors k and l have similar input
purchasing patterns
) (yk yl
r ⋅ - measuring the degree to which sectors k and l have similar selling
) (xk yl
r ⋅ - measuring the degree to which the buying pattern of sector k is similar
to the selling pattern of sector l
) (yk xl
r ⋅ - measuring the degree to which the buying pattern of sector l is similar
to the selling pattern of sector k.
Using an input-output table with N sectors and selecting the largest of the four
coefficients for each pair of sectors, as the best indicator of similarity between them,
yields a N x N symmetric matrix of ‘maximum correlation coefficients’.
This matrix can than be used in a principal components factor analysis with a
promax rotation, in order to better identify the intersectoral (static) clusters. This method
was applied to the Portuguese economy, using the input-output table of this country for
the year 1995 (Dias et al, 2001; Martins, 2004). As we are interested in the clustering
process based on localized interindustry connections, we work with the matrix of
domestic flows. We have initially 59 industries, but 4 of them are suppressed because
they have null output in the chosen year. A list with the remaining 55 sectors is presented
in the Appendix 1. The list of sectoral clusters, the corresponding industries and the
percentage of variance explained by the most significant eigenvalues are presented in
Table 1.
The main result is the identification of a well defined cluster of service industries
(and also industries 22-Printed matter and recorded media and 2-Products of forestry,
logging and related services).
The second cluster has 7 industries mainly related to metals and fabricated metal
products, machinery and equipment and secondary raw materials. The third cluster relates
to construction work and materials, but includes also (unexpectedly) insurance and
pension funding services. The remaining clusters correspond to: agriculture and food
products (4); chemicals, health services and rubber and plastics (5); textiles and wearing,
a small cluster of only two industries (6); two energy industries, with a third industry of
public services, not easily understandable here (7); mother vehicles and medical and
other instruments (8), and, finally a mix of industries difficulty considered a cluster.
3. The structure of industry output dynamics
In this section, we show how, starting from a stochastic geometry technique, the time
evolution of industry outputs spontaneously creates a structure, which is conveniently
described by a geometrical object.
The stochastic geometry technique is simply stated in the following terms: pick a
set of industries (or productive sectors) and their historical data of outputs over the time
interval and consider the yearly value of the output p for each sector k and a normalized
(
2 2)
) ( ) ( ) ( ) ( ) ( k p k p n k p k p k − − = r r r ρ ,where n is the number of components (number of time labels) in the vector ρr.
With this vector one defines the distance between the sectors k and l by the Euclidian
distance of the normalized vectors
) ( ) ( ) 1 (
2 C k l
dij = − ij = ρr −ρr
as proposed in (Mantegna et al., 1999), with Cij being the correlation coefficient
of p(i),p(j).
The fact that this is a properly defined distance gives a meaning to geometric
notions and geometric tools in the study of the sectors. Given that set of distances
between points, the question now is reduced to an embedding problem: one asks what is
the smallest manifold containing the set. If the proportion of systematic information
present in correlations between sectors is small, then the corresponding manifold will be
a low-dimensional entity. The following stochastic geometry technique was used for this
After the distances (dij) are calculated for the set of n sectors, they are embedded
in RD, where D < n, with coordinatesXr(k). The center of mass Rr is computed and
coordinates reduced to the center of mass
k k x R=
∑
k ( )r r R k x k
yr( )= r( )− r
and the inertial tensor
) ( ) (k y k y T j k i ij r r
∑
=is diagonalized to obtain the set of normalized eigenvectors
{
λi,eri}
. Theeigenvectors eridefine the characteristic directions of the set of sectors. The characteristic
directions correspond to the eigenvalues (λi) that are clearly different from those
obtained from surrogate data. They define a reduced subspace of dimension d, which
carries the systematic information related to the correlation structure of the productive
sectors.
This corresponds to the identification of empirically constructed variables that
drive the productive sectors, and, in this framework, the number of surviving eigenvalues
As economic spaces can be described as low dimension objects, the geometric
analysis is able to provide crucial information about their dynamics. Different
applications of this technique, namely for the identification of periods of stasis and of
mutation of financial markets are made by Araújo et al. (2007 and 2008) and Vilela
Mendes et al. (2003).
In this paper we will apply such a dimensional reduction in the identification of
clusters of sectors. As stated before, the most relevant characteristic directions for our
purposes are those that correspond to the eigenvalues which are clearly different from
those obtained from surrogate or random data. They define a subspace Vdof dimension d.
This d-dimensional subspace carries the (systematic) information related to the system
correlation structure.
The results were computed using actual data - the set of yearly outputs of 55
sectors with a time window of 12 years - and comparing them to surrogate data that were
generated by permuting the output values of each sector randomly in time. As each sector
is independently permuted, time correlations among sectors disappear, while the resulting
surrogate data preserve the mean and the variance that characterize actual data.
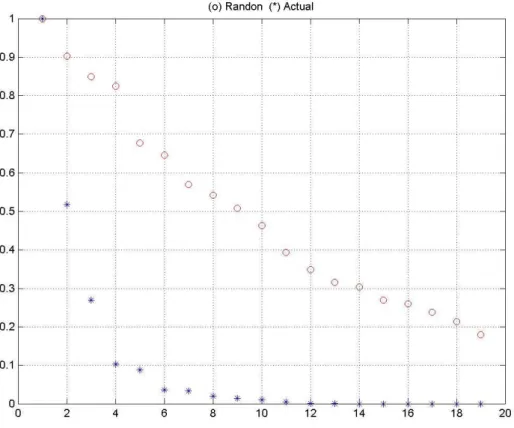
It was empirically found that the set of industrial sectors has only four effective
dimensions, as the plot in Fig.1 shows.
The four-dimensional space defines the reduced subspace which carries the
systematic information related to the correlation structures of the sectors. The four
effective dimensions capture the structure of the deterministic correlations and economic
trends that are driving the sectoral dynamics, whereas the remainder of the space may be
considered as being generated by random fluctuations.
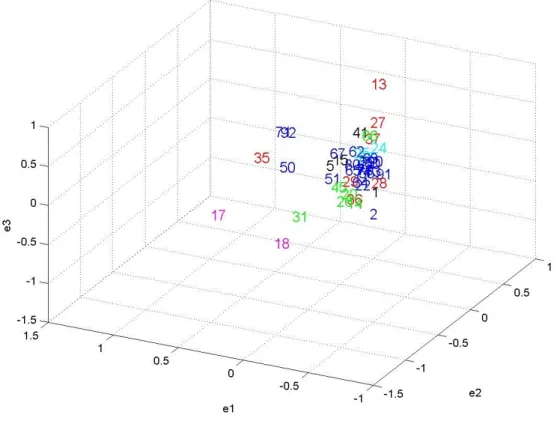
The application of the stochastic geometry technique earlier described to the set of
55 sectors generated the geometrical manifold presented in Figure 2, showing the
coordinates of each industry and describing the evolution of their dynamics as replicated
in the three dominant directions.
< Figure 2 approximately here >
From the plot in Figure 2 we observe that some sectors tend to occupy specific
locations in the 3-dimensional space. Sectors like the ones numbered 2, 13, 17, 18, 19,
34, 35, 50, 61, 71 and 92 seem to move away from the bulk of the points in the center of
the cloud.
These results suggest that there is a distortion in the dominant directions
representing its leading variables. Instead of a close-to-spherical form (corresponding to
independent, or low correlated, industry output paths), the cloud of points in Figure 2
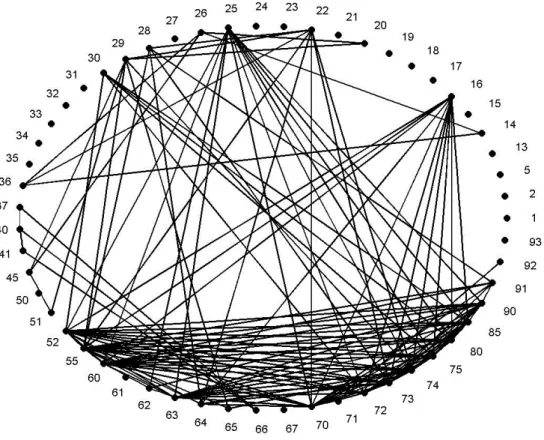
In order to investigate if such a distortion in the shape of the manifold follows a
sectoral pattern, we use a graph representation of the network of sectors. Figure 3 shows
the structure of the sectoral pattern, according to the density of relations among sectors.
The main purpose is to characterize the additional information on the structure of
the sectoral space, besides the geometrical approach, developing a topological
representation of the set of productive sectors.
From the matrix of distances between sectors (dij) computed in the reduced four
dimensional space over a time window of 12 years, we apply the hierarchical clustering
process to construct the minimal spanning tree (MST) that connects the N sectors. Then
the Boolean graph BD4 is defined by setting b(i,j) = 1 if d4(i,j) < LD4 and b(i,j) = 0
otherwise, where LD4 is the smallest threshold distance value that assures connectivity of
the whole network in the hierarchical clustering process.
< Figure 3 approximately here >
The results of Figure 3 show that the amount of highly correlated (short-distant)
sectors in the network is not large outside the cluster C1. The network displays a large
amount of distances whose values are below the endogenous threshold. This is due to the
existence of a relevant set of highly correlated sectors in the first sectoral cluster (C1 -
Services), which may possibly be a common feature shared by most economies
4. Conclusion
In this paper we identify the industry clusters of the Portuguese economy, and uncover
the structure of its sectoral output dynamics, using input-output tables of domestic flows
from 1995 to 2006.
Starting with the well known methodology proposed by Feser and Bergman
(2000), the principal component factor analysis of "maximum correlation coefficients" of
intermediate flows, with a promax rotation in order to better interpret the results, we
identify a few clusters, namely the most homogeneous one composed by 22 industries,
predominantly services. The year chosen as reference for this inter-industry clustering
identification is the starting year of the time period covered, 1995.
After that, we try to confirm that, as it might be expected, the static clustering
structure has implications for the sectoral growth dynamics in the future, that is to say,
sectors belonging to the same cluster in 1995 share a common growth performance
between 1995 and 2006.
With this purpose in mind, we describe and apply a stochastic geometry
technique, based on the yearly distances of industry outputs, and the results appear to
confirm our expectation, but only in what concerns the more homogeneous and stronger
cluster of service industries. This is a strong indication that the industry output dynamics
For the other clusters, inter-sectoral relationships or, more precisely, intermediate based
linkages that are the core of input-output analysis, appear not to be strong enough to
crucially determine growth dynamics, and other factors should and must be operating
here.
Finally, we want to remark that the techniques applied in this study are also useful
in other dimensions of input-output analysis, namely for studying the economic
performance of geographical (regional) clusters, the dynamics of industry value added
and employment and sectoral regional or international convergence, to name but a few.
Acknowledgments: Financial support by FCT (Fundação para a Ciência e a
Tecnologia), Portugal, is gratefully acknowledged. This article is part of the Multi-annual
Funding Project of UECE (Research Unit on Complexity and Economics).
Note
1 See, e.g., the special issues dedicated to this topic in the journals Regional Studies (presented by
Rychen and Zimmermann, 2008) and European Planning Studies (introduced in Wolfe, 2009).
References
Akgüngör, S., Kumral, N. & Lenger, A. (2003) National Industry Clusters and regional
Araújo, T. & Louçã, F. (2007) The Geometry of Crashes - A Measure of the Dynamics of
Stock Market Crises, Quantitative Finance, 7(1), pp. 63-74.
Araújo T. & Louçã, F. (2008) The Seismography of Crashes in Financial Markets,
Physics Letters A, 372, pp. 429-454.
Aroche-Reys, F. (2003) A qualitative input-output method to find basic economic
structure, Papers in Regional Science, 82, pp. 581-590.
Cruz, S. & Teixeira, A. (2009) The Evolution of the Cluster Literature: Shedding Light
on the Regional Studies-Regional Science Debate, Regional Studies, online - First
Published on: 30 November 2009.
Czamanski, S. (1974) Study of Clustering of Industries, Institute of Public Affairs,
Dalhousie University, Halifax, Canada.
Czamanski S. & Ablas, L. A. (1979) Identification of industrial clusters and complexes:
a comparison of methods and findings, Urban Studies, 16, pp. 61-80.
Dias A., Lopes E. and Félix R. (2001) Estimação de um Sistema de Matrizes para 1995
na Óptica da Produção Efectiva, Documento de Trabalho do Departamento de
Prospectiva e Planeamento, Lisboa.
Díaz B., Moniche L. and Morillas A. (2006) A fuzzy clustering approach to the key
sectors of the Spanish economy, Economic Systems Research, 18, pp. 299-318.
Dietzenbacher E. (1996) An algorithm for finding block-triangular forms, Applied
Mathematics and Computation, 76, pp. 161-171.
Feser, E. & Bergman, E. (2000) National industry cluster templates: a framework for
Hoen, A. (2002) Identifying linkages with a cluster-based methodology, Economic
Systems Research, 14, pp. 131-146.
Kelton C., Pasquale, M. & Rebelein, R. (2008) Using the North American Industry
Classification System (NAICS) to Identify National Industry Cluster Templates for
Applied Regional analysis, Regional Studies, 43, pp. 305-321.
Martins, N. (2004) Sistema Integrado de Matrizes de Input-Output para Portugal de 1995,
a preços correntes e a preços de 1999, Departamento de Prospectiva e Planeamento,
Lisboa, Julho.
Morillas, A. & Díaz, B. (2008) Key Sectors, Industrial clustering and Multivariate
Outliers, Economic Systems Research, 20, pp. 57-73.
Porter, M. E. (1990) The Competitive Advantage of Nations, Basic Books, New York,
NY.
Porter, M. E. (1998) Clusters and the new economics of competition, Harvard Business
Review, 76, pp. 77-90.
Rychen, F. & Zimmermann, J. (2008), Clusters in the Global Knowledge-based
Economy: Knowledge Gatekeepers and Temporary Proximity, Regional Studies
42(6), pp. 767-776.
Sonis, M., Hewings, G.J.D. & Guo D. (2007) Industrial Clusters in Input-Output
Economic Systems, Discussion Paper 07-T-1, Real Economic Applications
Laboratory, University of Illinois, http://www.real.uiuc.edu
Schnabl, H. (1994) The evolution of production structures analysed by a multi-layer
Titze, M., Brachert, M. & Kubis, A. (2009) The Identification of Regional Industrial
Clusters Using Qualitative Input-Output Analysis (QIOA), Regional Studies, online
- First published on 27 November 2009.
Vilela Mendes, R., Araújo, T. & Louçã, F. (2003) Reconstructing an Economic Space
from a Market Metric, Physica A, 32, pp. 635-650.
Wolf, D. (2009), Introduction: Embedded Clusters in the Global Economy, European
Table 1. Summary results: principal component factor analysis
Factor Clusters/Industries Eigenvalue
Percentage of variance explained 1 C1 - Services, printed matter and recorded media 19,367 35,21
72 Computer and related services
74 Other business services
80 Education services
92 Recreational, cultural and sporting services
73 Research and development services
90 Sewage and refuse disp. serv., sanitation and sim. serv.
71 Renting services of machinery and equipment
50 Trade, maint. and repair services of motor vehicles
91 Membership organisation services n.e.c.
63 Supporting and aux. transport serv.; travel agency serv.
52 Retail trade services, exc. of motor vehicles
67 Services auxiliary to financial intermediation
70 Real estate services
51 Wholesale trade, ex. of motor vehicles and motorcycles
93 Other services
22 Printed matter and recorded media
65 Financial intermediation services
85 Health and social work services
66 Insurance and pension funding services
64 Post and telecommunication services
2 C2 - Metals and metal products 8,727 15,87
28 Motor vehicles, trailers and semi-trailers
29 Machinery and equipment n.e.c.
35 Other transport equipment
27 Basic metals
34 Motor vehicles, trailers and semi-trailers
31 Electrical machinery and apparatus n.e.c.
37 Secondary raw materials
33 Medical, prec. and opt. instruments, watches and clocks
26 Other non-metallic mineral products
3 C3 - Mining, silviculture and others 4,097 7,45
14 Other mining and quarrying products
13 Metal ores
02 Products of forestry, logging and related services
60 Land transport; transport via pipeline services
Table 1. Continued
Factor Clusters/Industries Eigenvalue
Percentage of variance explained
4 C4 - Agriculture, Food and Hotels and Restaurants 3.473 6.314
55 Hotel and restaurant services
01 Products of agriculture, hunting and related services
15 Food products and beverages
05 Fish and other fishing products; services inc. of fishing
5 C5 - Textiles and Wearing 2.914 5.298
17 Textiles
18 Wearing apparel; furs
6 C6 - Wood, Pulp and Paper products 2.205 4.009
20 Wood and products of wood and cork (ex. furniture)
21 Pulp, paper and paper products
7 C7 - Chemicals, rubber, plastic, leather and others 2,153 3.915
25 Rubber and plastic products
32 Radio, television and communication equipment
24 Chemicals, chemical products and man-made fibres
36 Furniture; other manufactured goods n.e.c.
19 Leather and leather products
8 C8 - Coke, ref. petrol. products and water transport 1.678 3.051
23 Coke, refined petroleum products and nuclear fuels
61 Water transport services
9 Other sectors 1.350 2.455
40 Electrical energy, gas, steam and hot water
41 Collected and purif. water, distribution services of water
16 Tobacco products
45 Construction work
62 Air transport services