Doi: https://doi.org/10.25186/.v15i.1752
Quality assessment of coffee beans through computer vision
and machine learning algorithms
Fernando Ferreira Lima dos Santos1* , Jorge Tadeu Fim Rosas2 , Rodrigo Nogueira Martins1 ,
Guilherme de Moura Araújo3 , Lucas de Arruda Viana1 , Juliano de Paula Gonçalves1
1Universidade Federal de Viçosa/UFV, Viçosa, MG, Brasil
2Universidade de São Paulo/USP, Escola Superior de Agricultura “Luiz de Queiroz”/ESALQ, Piracicaba, SP, Brasil 3University of California, Davis, CA, USA
Contact authors: [email protected], [email protected], [email protected], [email protected], [email protected], [email protected]
Received in April 8, 2020 and approved in July 16, 2020 ABSTRACT
The increasing market interest in coffee beverage, lead coffee growers around the world to adopt more efficient methods to select the best-quality coffee beans. Currently, coffee beans selection is carried out either manually, which is a costly and unreliable process, or using electronic sorting machines, which are often inefficient because some coffee beans defects, such as sour and immature beans, have similar spectral response patterns. In this sense, the present work aimed to analyze the importance of shape and color features for different machine learning techniques, such as Support Vector Machine (SVM), Deep Neural Network (DNN) and Random Forest (RF), to assess coffee beans’ defects. For this purpose, an algorithm written in Python language was used to extract shape and color features from coffee beans images. The dataset obtained was then used as input to the machine learning algorithms, developed using Python and R programing languages. The data reported in this study pointed to the importance of color descriptors for classifying coffee beans defects. Among the variables used, the components Gmean from RGB (Red, Green and Blue) color space and Vmean from HSV (Hue, Saturation and Value) color space were some of the most relevant features for the classification models. The results reported in this study indicate that all the classifier models presented similar performance. In addition, computer vision along with machine learning algorithms can be used to classify coffee beans with a very high accuracy (> 88%).
Key words: Deep neural network; classification; artificial intelligence; image processing; granulometry.
1 INTRODUCTION
There is growing interest in international markets in differentiated agricultural products from the tropics. Coffee is a product whose value is stipulated according to its beverage quality, which is the result of complex interactions between the environment, management, and plant genetics (Läderach et al., 2011; Silva et al., 2014). A good quality beverage depends on several aspects such as appropriate pre-harvest cultural practices, favorable physiological and environmental factors, inherent plant characteristics, as well as appropriate management of harvest and post-harvest processes, including the coffee beans selection and beverage preparation (Barbosa et al., 2012; Silveira et al., 2016).
Currently, the inefficiency in the coffee beans selection process causes a significant financial loss for coffee growers all over the world. The global coffee production accounted for the period of 2018/2019 was about 10 thousand tons of coffee beans (Internationl Coffee Organization - ICO, 2020). About 20% of all coffee produced is compromised due to coffee beans defects (Ramalakshmi et al., 2009), which highly affects the price of coffee beans and its beverage quality. These defects, usually, are consequence of problems that occurred during harvesting and pre-processing operations (Franca; Oliveira, 2008).
In the agricultural market, the term defect is used to characterize the presence of defective beans (black, sour, immature and broken) and extraneous matter (twigs and stones) in a given coffee sample (Franca; Oliveira, 2008). Black beans are generally associated with a “heavy flavor” and sour beans tend to downgrade flavor by giving a “oniony flavor” to the drink (Clarke; Macrae, 1987). These undesired effects can be avoided by separating the defective grains apart from the good ones.
In Brazil, Vietnam, and Colombia, the three major coffee producers in the world, coffee beans defects classification is traditionally carried out manually (ICO, 2018), which is a costly and unreliable process, as human operations are less efficient and subjective. Different methods, such as electronic sorting machines, are employed in big farms and producers’ cooperatives. This method consists in assessing the spectral response of coffee beans through the employment of spectroscopy, but it is often inefficient because sour and immature beans have similar spectral response patterns (Franca; Oliveira, 2008). Consequently, coffee lots labeled as defective may present a high percentage of good coffee (Craig; Franca; Oliveira, 2012). The employment of artificial intelligence and computer vision technologies can avoid the subjectivity of human classification, overcome limitations of current electronic classification systems and provide more accurate results.
The use of machine learning algorithms for food quality evaluation have shown promising results (Mandal, 2018; Ordukaya; Karlik, 2017; Zareiforoush et al., 2016), since most of the machine learning classification models use as inputs the object’s shape and color features. Rice varieties and wheat grain species are already classified by computer vision and machine learning technologies, in which some related studies have reported overall accuracies greater than 86% (Kaur; Singh, 2013; Marini; Zupan; Magrì, 2004; Olgun et al., 2016). Furthermore, through the employment of different types of machine learning algorithms, those studies have pinpointed the potential of color and shape features to classify different types of grains.
For coffee beans defects classification, shape and color descriptors are some of the commonly used criteria (Farah et al., 2006; Franca et al., 2005; Toci; Farah, 2008), in which some defective beans and extraneous matter can correlate with them (Faridah; Parikesit; Ferdiansjah, 2011; Oliveira et al., 2016; Santos et al., 2020). In this sense, some machine learning models have been proposed to classify coffee beans defects, such as convolutional neural network (Fukai et al., 2018) and k-nearest neighbour (García; Candelo-Becerra; Hoyo, 2019) algorithms. However, the low accuracy in classifying specific types of coffee beans defects such as sour (García; Candelo-Becerra; Hoyo, 2019), fade, broken and peaberry beans (Fukai et al., 2018) were pointed as their main limitations. Although some studies prove the effectiveness of some machine learning models to access coffee beans quality, information about the features’ importance for the classifiers are scarce. Through the analysis of the importance of these features, it is possible to explore other variables that are related to the most important features, such as spectral descriptors of different color spaces, and thus, improve the classifier’s performance.
The novelty of this work relies on the analysis of the importance of some shape and color features for different machine learning techniques to assess coffee beans’ defects. We employed both computer vision and machine learning techniques, such as Support Vector Machine (SVM), Deep Neural Network (DNN) and Random Forest (RF) for classifying coffee beans defects according to their shape and color features. To test the feasibility of the proposed methods, we evaluated their efficiency/accuracy for this purpose.
2 MATERIAL AND METHODS
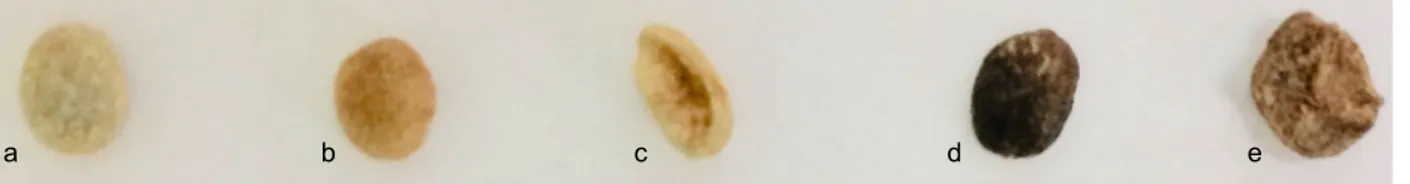
The experiment was conducted at the Laboratory of Machine Design and Artificial Vision (PROVISAGRO) of the Department of Agricultural Engineering of the Federal University of Viçosa, Minas Gerais State, Brazil. The experimental material comprised a sample of coffee beans (Coffea arabica), harvested in 2019 and acquired from a local producer in Viçosa, Brazil (mean altitude equals to 730 m). A quality analysis based on physical defects was performed. Based on that, the coffee beans sample was manually classified in five classes: sour, husk, regular, black and broken (Figure 1). 2.1 Image acquisition and processing
Digital images were acquired with a Flatbed Scanner, model Epson L210. Images of each class were taken separately, accounting for a total number of 635 samples (coffee beans). In order to enhance contrast between beans images and the background, a white background paper (placed above the flatbed scanner) was used. The images were recorded in JPEG format with 300 dpi resolution and an average pixel intensity of 24 bit.
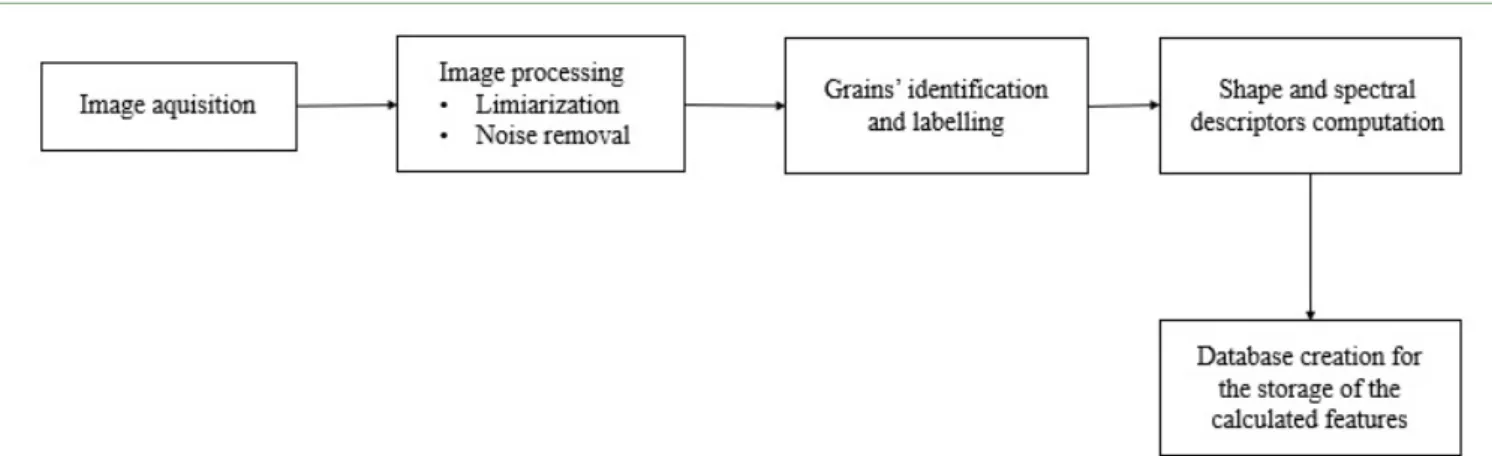
Image processing was performed with an algorithm developed using the Jupyter Notebook, an open-source web application that allows code development in python language. In addition, the OpenCV2 library, which is a programming function package for image processing techniques was used. This algorithm aims to characterize each individual coffee bean and assign it a class by performing features (color and shape) extraction. Figure 2 shows a schematic diagram of the code functioning.
2.1.1 Shape and color descriptors
Based on the assumption that coffee beans defects are related to shape and color descriptors (Faridah; Parikesit; Ferdiansjah, 2011; Oliveira et al., 2016; Smrke et al., 2015), in this study some features were used to assess coffee beans quality. The shape descriptors used were perimeter (pixels), area (pixels2), length (pixels), circularity, compactness, eccentricity, convexity and solidity. The descriptors circularity, eccentricity, convexity and solidity formulas were suggested by Pedrini and Schwartz (2008). All shape descriptors were determined for each coffee bean represented by a single BLOB (Binary Large Object), which refers to a group of connected pixels.
Figure 1: Illustration of the coffee beans’ classes: regular (a), sour (b), broken (c), black (d) and husk (e).
Similarly, the color descriptors were extracted from the RGB (Red, Green and Blue) images, for each coffee bean, using the BLOB’S previously delimited by the contours. Then, the following spectral descriptors were obtained: Rmean, Gmean, Bmean, Hmean, Smean, Vmean and Graymean. The Rmean, Gmean and Bmean variables refers to the average value of the color component (RGB system) of each bean. The Graymean corresponds to the pixel intensity in grayscale, and it was calculated using Equation 1.
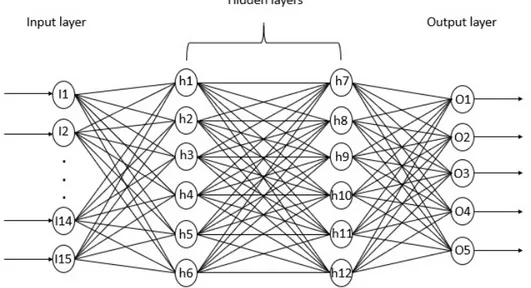
for each proposed descriptor), two hidden layers containing 6 neurons each and an output layer containing 5 neurons (one neuron for each coffee bean class). The activation function implemented for both hidden layers was the Rectified Linear Unit (ReLu). As the model optimizer, the Adaptive Moment Estimation (Adam) was the one used. The dataset was divided in three parts: for training, validating and testing the algorithms. Thus, 70% of the dataset was used for training, using a back-propagation algorithm, while the testing and validation dataset comprised 15% of the total dataset each.
For the application of RF and SVM, the R packages randomForest (Liaw; Wiener, 2002) and e1071 (Meyer et al., 2019) were used, respectively. The applied RF model had its parameters defined after data training. The number of trees selected was equal to 500 (Belgiu; Drăgu, 2016; Mollazade; Omid; Arefi, 2012; Patil; Malemath; Yadahalli, 2011), as we noticed that the classification error tended to be steady for numbers superior to that. RF’s tuning parameter, also known as mtry, was equal to six. This parameter was defined based on the lower out-of-bag error associated with it (which is a method of measuring RF’s prediction error). The SVM model parameters were also defined after data training. The kernel function used was the radial basis kernel with gamma equals 0.1, since it presented the best performance. The radial basis function has a scale parameter (σ) that, along with the cost value, constitute the tuning parameters for the model (Kuhn; Johnson, 2013). Since the function in the R package e1071 automatically uses the analytical approach to estimate σ (Kuhn; Johnson, 2013), we tuned the model over seven different cost values equally spaced between 0.001 and 1000. Smaller cost values were associated with greater error (underfitting) in the model performance, while for higher cost values (starting from 100) the error values were constant and near minimum (overfitting). Thus, the model’s cost value was defined as 1. Similar to the DNN, the training and testing dataset comprised 70% and 15%, respectively, of the total data set for both RF and SVM.
Figure 2: Schematic diagram of the developed program.
mean mean mean mean
Gray = R x 0.2989 + G x 0.587 + B x 0.114 In order to test the influence of different color spaces in coffee beans classification, the original RGB images were converted into the HSV (Hue, Saturation and Value) color space and then the Hmean, Smean and Vmean variables were obtained. These descriptors correspond to the average value of the component of each bean.
2.2 Classification algorithms
In possession of the processed data, the next steps consisted of training and validating the classification algorithms. These steps, together with the coding phase, were carried out by using the R 3.6.2 software (R CORE TEAM, 2019) and Jupyter Notebook (Python 3.0). In this study, three classification algorithms were adapted for coffee beans classification: Random Forest (RF), Support Vector Machine (SVM) and Deep Neural Network (DNN), which are commonly used for agricultural modeling purposes (Anami; Naveen; Hanamaratti, 2015; Kaur; Singh, 2013; Kong et al., 2013).
For the application of the DNN, the tensorflow 2.0 package (Abadi et al., 2015) was used with the Jupyter notebook. This Neural Network was from the class Deep Feedforward Network, which means that the information passes through the network neurons only in the forward direction. The proposed network architecture (Figure 3) consists of an input layer containing 15 neurons (one neuron
Further, given the importance of shape and color features in coffee beans classification, as well as the uncertainty about how strongly these factors influence this process, we ranked the main variables that affect classification. For this purpose, the R packages randomForest (Liaw; Wiener, 2002) (RF) and rminer (Cortez, 2020) (SVM) and the Python package tensorflow 2.0 (Abadi et al., 2015) (DNN) were used. In addition, a Venn diagram was used to illustrate how the classification models agree in terms of the most important variables that affect coffee beans classification.
2.2.1 Performance Analysis
Confusion matrices were constructed to verify the performance of the proposed classifiers. Then, the overall accuracy (OA) and the kappa coefficient (K) were calculated using Equations 2 and 3.
reference data, while a K value of 0 corresponds to a random classification (Landis; Koch, 1977).
The hypothesis whether the classification algorithms provided statistically similar K values was evaluated using the Z-test at a significance level of 5% according to Equation 4. A difference in the K values between the classifiers is statistically significant (p ≤ 0.05) if the calculated Z value is greater than 1.96.
Figure 3: Architecture of the neural network model.
1 /
*100 k ii i OA
x N
2
1 1 1 ˆ c c / c ii i i i i i i i K n
x
x x n
x x (2) (3) Where:N = total number of coffee beans; K = kappa coefficient estimation;
xii = value in line i and column i (diagonal) of the error matrix; xi = total in line i;
xi = total in column i; n = total number of samples; c = total number of zones.
The K was calculated to test if each classification was significantly better than a random classification. A K value of 1 represents a perfect agreement between the classification and
(4)
/ ˆi ˆj ˆi ˆj Z K K Vâr K Vâr K Where: ˆi nd jK a = kappa’s to be compared, dimensionless; and
Kˆi j
Vâr and = variances of kappa’s under analysis. 3 RESULTS AND DISCUSSION
3.1 Evaluation of the descriptors importance for coffee beans classification
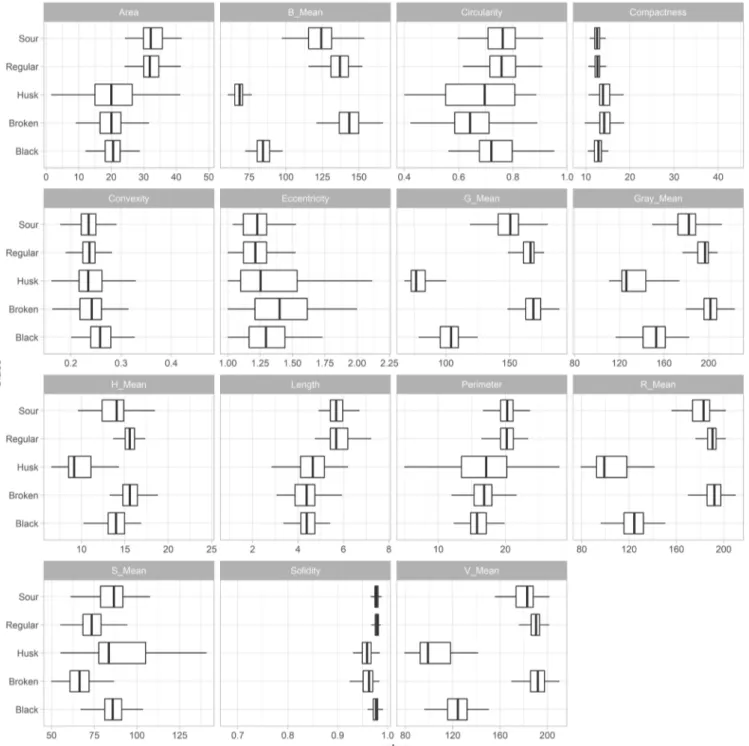
Figure 4 shows the boxplots of the shape and color descriptors. Variations in the descriptors were observed, in which some classes were associated with larger areas and greater length (e.g., Sour and Regular classes; Figure 4a, j) compared to the classes Husk, Black and Broken. Due to its irregular shape, the class Husk presented greater variability on shape descriptors, such as area, circularity, eccentricity and perimeter (Figure 4a, c, f, k). Also, major variations between classes were observed in color descriptors, in which the classes Black and Husk presented apparent differences in Bmean, Gmean, Graymean, Rmean and Vmean descriptors (Figure 4b, g, h, l, o) when compared to the classes Regular, Sour and Broken.
Figure 5 shows a circular barplot that represents the proportional importance of the variables used for coffee beans classification generated by the Deep neural Network (DNN), Random Forest (RF) and Support Vector Machine (SVM) models, in percentage.
‘Since some variables had a weak contribution (proportional contribution lower than 5.4%) on explaining the
models’ classification, the features ranked among the top seven were used for comparison purposes between the classification models (Figure 6). The models pointed that the features area, Gmean and Vmean are the most important factors for classifying coffee beans according to its defects. The values of the descriptors area, Gmean and Vmean presented significant variation for each distinct class (Figure 4), which explains their importance in
Figure 4: Boxplots of the shape and color descriptors for each coffee bean class.
(a) area, (b) Bmean, (c) circularity, (d) compactness, (e) convexity, (f) eccentricity, (g) Gmean, (h) Graymean, (i) Hmean, (j) length, (k) perimeter, (l) Rmean,
distinguishing the coffee beans classes. These results emphasize the importance of shape and, specially, color descriptors in assessing coffee beans quality. Since color descriptors presented the most relevant contribution in classifying coffee beans (Figure 5), different variables, such as components from different color spaces (García; Candelo-Becerra; Hoyo, 2019; Oliveira et al., 2016), should be tested to improve classification accuracy.
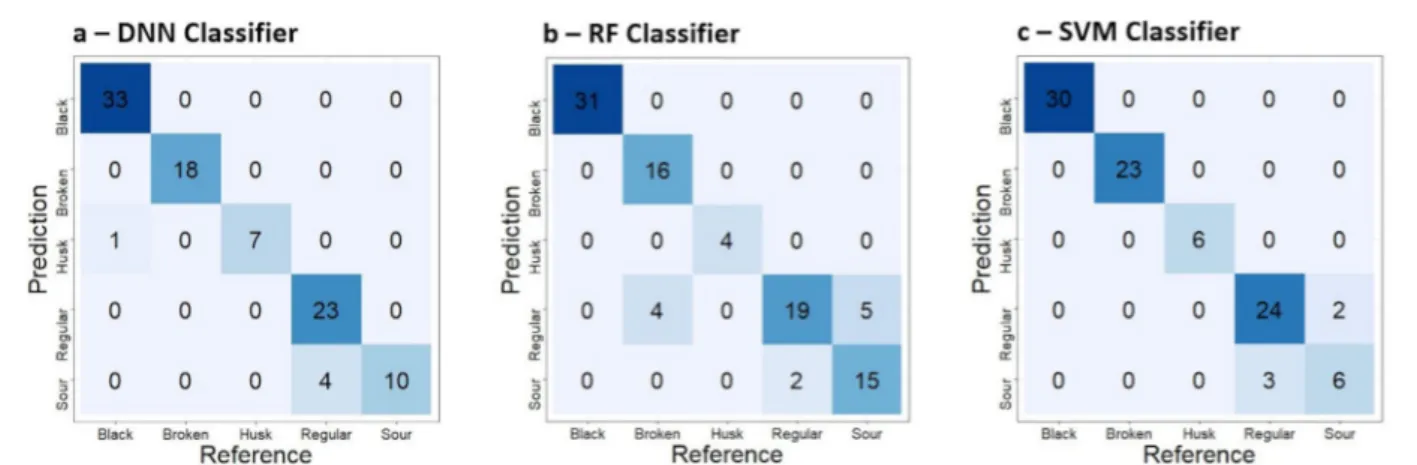
3.2 Evaluation of the classification models For each classifier, a confusion matrix was computed and plotted (Figure 7). In each matrix, the coffee beans classes are labeled in both the horizontal and vertical axes. The vertical axis represents the amount of beans predicted in each class by the algorithms, and the horizontal axis represents the reference data.
Results showed that DNN, RF and SVM obtained an overall accuracy (OA) equal to 94.8, 88.5 and 94.7%, and kappa coefficient (K) equal to 0.93, 0.86 and 0.93, respectively, indicating an almost perfect classification performance (0.81 – 1.00), according to Landis and Koch (1977). Results of the Z–test (p ≤ 0.05) showed that the K values of all the models presented no significant difference, i.e., all these classifiers presented similar performance. The models presented perfect performance (accuracy equal to 100%) when classifying black and broken coffee beans and husk, with exception of the DNN model, that presented 87.5% accuracy for classifying husk. This can be explained by the fact that the color feature is very distinctive for black coffee beans and husk, which is confirmed by the importance of the spectral features in the classification models shown in Figure 5. Despite the high overall accuracy of the models, they showed accuracy equal to 71.4% (DNN), 88.2% (RF) and 66.7% (SVM) when identifying the sour defect type. As the color of sour coffee beans varies from light brown to dark brown, it is difficult to separate them from black and regular beans, as seen in Figure 7. Furthermore, similarities in shape and spectral values, between those three classes, makes the prediction even more difficult (García; Candelo-Becerra; Hoyo, 2019). However, some studies using different machine learning algorithms have shown promising results for classifying sour coffee beans (Fukai et al., 2018; García; Figure 5: Circular barplot of the proportional importance of the
variables used for coffee beans classification by the DNN, RF and SVM models.
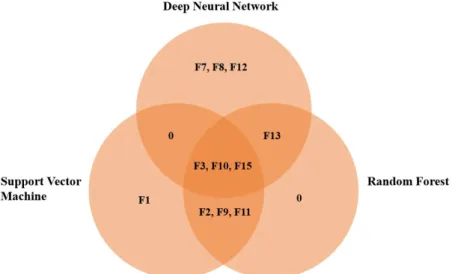
SVM = Support Vector Machine; DNN = Deep Neural Network; RF = Random Forest; F1 = perimeter; F2 = length; F3 = area; F4 = circularity; F5 = compactness; F6 = eccentricity; F7 = convexity; F8 = solidity; F9 = Rmean; F10 = Gmean; F11 = Bmean; F12 = Graymean; F13 = Hmean; F14 =
Smean; F15 = Vmean.
Figure 6: Venn diagram representing the most important features used by the classifier models and their agreement for coffee beans classification.
Candelo-Becerra; Hoyo, 2019). García, Candelo-Becerra and Hoyo (2019) employed the k-nearest neighbor algorithm to determine the quality of coffee beans and their corresponding defect types using shape and color features. The use of HSV (Hue, Saturation and Value) and LUV (Luminance and UV chromaticity coordinates) color spaces proved to be successful identifying coffee beans defects related to color, such as the sour beans. The proposed model achieved an accuracy equals to 92% for classifying sour beans defects. Fukai et al. (2018) developed an image processing system which classifies coffee beans defects through a deep convolutional neural network. As a result, the model achieved an accuracy equals to 93% for classifying sour beans defects. Also, the authors pointed the importance of having a large dataset, in order to achieve better results for the classification model.
Since black beans represent one of the main defects that downgrade the beverage quality (Clarke; Macrae, 1987), the proposed models were promising in terms of classification accuracy, allowing coffee growers to select the best-quality coffee beans and, consequently, which inherently leads to income increase. Also, it was shown that computer vision and machine learning technologies can be employed for coffee beans classification and deliver more accurate results than the current manual process and electronic sorting machines. Due to the ease of application and replication of the technique developed, the classification process can be replicated for a larger number of samples, which decreases the variance of the input variables of the models, ensuring greater confidence for farmers and end customers of the product.
4 CONCLUSIONS
The data reported in this study provides evidence that computer vision along with machine learning algorithms can be used to identify and classify coffee beans with a very high accuracy (> 88%). In addition, all the classifier models presented similar performance. The features area, Gmean and Vmean are the most important variables for classifying
coffee beans according to its defects. Since color descriptors presented the most relevant contribution in the classification process, different variables, such as components from different color spaces should be considered to improve classification accuracy.
5 ACKNOWLEDGEMENTS
This study was financed in part by the Coordenação de Aperfeiçoamento de Pessoal de Nível Superior - Brasil (CAPES) - Finance Code 001 and the Fundação de Amparo à Pesquisa do Estado de Minas Gerais (FAPEMIG).
6 REFERENCES
ABADI, M. et al. TensorFlow: Large-scale machine learning on heterogeneous systems. p.1-15, 2015.
ANAMI, B. S.; NAVEEN, N. M.; HANAMARATTI, N. G. Behavior of HSI Color Co-Occurrence Features in Variety Recognition from Bulk Paddy Grain Image Samples.
International Journal of Signal Processing, Image Processing and Pattern Recognition, 8(4):19-30, 2015.
BARBOSA, J. N. et al. Coffee Quality and Its Interactions with Environmental Factors in Minas Gerais, Brazil.
Journal of Agricultural Science, 4(5):1-10, 2012.
BELGIU, M.; DRĂGU, L. Random forest in remote sensing: A review of applications and future directions. ISPRS
Journal of Photogrammetry and Remote Sensing,
114:24-31, 2016.
CLARKE, R. J.; MACRAE, R. Coffee: Technology (Vol. 2). [s.l.] Elsevier, p.328, 1987.
CORTEZ, P. rminer: Data Mining Classification and
Regression Methods: p. 78, 2020. Available in: <https://
cran.r-project.org/web/packages/rminer/rminer.pdf>. Access in: February 21, 2020.
CRAIG, A. P.; FRANCA, A. S.; OLIVEIRA, L. S. Evaluation of the potential of FTIR and chemometrics for separation between defective and non-defective coffees. Food
Chemistry, 132(3):1368-1374, 2012.
FARAH, A. et al. Correlation between cup quality and chemical attributes of Brazilian coffee. Food Chemistry, 98(2):373-380, 2006.
FARIDAH, F.; PARIKESIT, G. O. F.; FERDIANSJAH, F. Coffee bean grade determination based on image parameter. Telkomnika, 9(3):547-554, 2011. FRANCA, A. S. et al. Physical and chemical attributes
of defective crude and roasted coffee beans. Food
Chemistry, 90(1-2):89-94, 2005.
FRANCA, A. S.; OLIVEIRA, L. S. Chemistry of defective coffee beans. Food Chemistry Research Developments. Nova Science Publishers, New York, v. 34, p.106-138, 2008.
FUKAI, H. et al. Classification of Green Coffee Beans by Convolutional Neural Network and its Implementation on Raspberry Pi and Camera Module. Timorese
Academic Journal of Science and Technology, 1:1-10,
2018.
GARCÍA, M.; CANDELO-BECERRA, J. E.; HOYO, F. E. Quality and Defect Inspection of Green Coffee Beans Using a Computer Vision System. Applied Sciences, 9(19):e4195, 2019.
INTERNATIONL COFFEE ORGANIZATION - ICO.
National Quality Standards. London, UK: [s.n.], p.35,
2018. Available in: <http://www.ico.org/documents/ cy2017-18/icc-122-12e-national-quality-standards.pdf>. Access in: September 20, 2019.
INTERNATIONL COFFEE ORGANIZATION - ICO. Total
crop year production by exporting countries. London,
UK: [s.n.], p.3, 2020. Available in: <http://www.ico. org/trade_statistics.asp?section=Statistics>. Access in: December 14, 2019.
KAUR, H.; SINGH, B. Classification and Grading Rice Using Multi-Class SVM. International Journal of
Scientific and Research Publications, 3(4):1-5, 2013.
KONG, W. et al. Rice seed cultivar identification using near-infrared hyperspectral imaging and multivariate data analysis. Sensors (Basel, Switzerland), 13(7):8916-8927, 2013.
KUHN, M.; JOHNSON, K. Applied Predictive Modeling
with Applications in R. [s.l.] Springer International
Publishing, 2013. 600p.
LÄDERACH, P. et al. Systematic agronomic farm management for improved coffee quality. Field Crops
Research, 120(3): 321-329 2011.
LANDIS, J. R.; KOCH, G. G. The Measurement of Observer Agreement for Categorical Data. Biometrics, 33(1):159-174, 1977.
LIAW, A.; WIENER, M. Classification and Regression by random Forest. R News, 2(3):18-22, 2002.
MANDAL, D. Adaptive Neuro-Fuzzy Inference System Based Grading of Basmati Rice Grains Using Image Processing Technique. Applied System Innovation, 1(2):19, 2018.
MARINI, F.; ZUPAN, J.; MAGRÌ, A. L. On the use of counterpropagation artificial neural networks to characterize Italian rice varieties. Analytica Chimica
Acta, 510(2):231-240, 2004.
MEYER, D. et al. Package “e1071”: p.63, 2019. Available in: <https://cran.rproject.org/web/packages/e1071/index. html>. Access in: July 28, 2020.
MOLLAZADE, K.; OMID, M.; AREFI, A. Comparing data mining classifiers for grading raisins based on visual features. Computers and Electronics in Agriculture, 84:124-131, 2012.
OLGUN, M. et al. Wheat grain classification by using dense SIFT features with SVM classifier. Computers and
Electronics in Agriculture, 122:185-190, 2016.
OLIVEIRA, E. M. et al. A computer vision system for coffee beans classification based on computational intelligence techniques. Journal of Food Engineering, 171:22-27, 2016.
ORDUKAYA, E.; KARLIK, B. Quality Control of Olive Oils Using Machine Learning and Electronic Nose. Journal of
Food Quality, 2017:7, 2017.
PATIL, N. K.; MALEMATH, V. S.; YADAHALLI, R. M. Color and Texture Based Identification and Classification of food Grains using different Color Models and Haralick features. International Journal on Computer Science
and Engineering, 3(12):3669-3680, 2011.
PEDRINI, H.; SCHWARTZ, W. R. Análise de imagens
digitais: Princípios, algoritmos e aplicações. [s.l.]
Thomson Learning: p.528, 2008.
R CORE TEAM. R: A Language and Environment for Statistical Computing. Viena, Austria, 2019. Available in: <https://www.r-project.org/index.html>. Access in: October 18, 2019.
RAMALAKSHMI, K. et al. Bioactivities of low-grade green coffee and spent coffee in different in vitro model systems. Food Chemistry, 115(1):79-85, 2009. SANTOS, F. F. L. et al. Open source iterative bayesian
classifier algorithm for quality assessment of processed coffee beans. Nativa, 8(1):118-123, 2020.
SILVA, S. de A. et al. Coffee quality and its relationship with Brix degree and colorimetric information of coffee cherries. Precision Agriculture, 15:543-554 2014.
SILVEIRA, A. S. de et al. Sensory analysis of specialty coffee from different environmental conditions in the
region of matas de minas, minas gerais, Brazil. Revista
Ceres, 63(4):1-8, 2016.
SMRKE, S. et al. Differentiation of degrees of ripeness of Catuai and Tipica green coffee by chromatographical and statistical techniques. Food Chemistry, 174:637-642, 2015.
TOCI, A. T.; FARAH, A. Volatile compounds as potential defective coffee beans’ markers. Food Chemistry, 108(3):1133-1141, 2008.
ZAREIFOROUSH, H. et al. Qualitative classification of milled rice grains using computer vision and
metaheuristic techniques. Journal of Food Science and