A Work Project presented as part of the requirements for the Award of a Master Degree in Management from the NOVA – School of Business and Economics
How can forecasting and analysing competition and tourism
indicators be applied into setting a dynamic pricing range. An
organizational challenge of Indie Campers.
David da Silva Santos, 18653
.A Project carried out on the Master in Management Program under the supervision of: Miguel Muñoz Duarte
Abstract
Indie Campers is a fast growing Start Up – one of the biggest in the Portuguese tourism sector – and, whenever new decisions are on deck to be taken, historical experience, metadata and business environment need to be assessed and analysed firstly to mitigate the risk of new decisions and secondly to adjust expectations and target the right measures. While settling position and expanding, the Start Up’s activity carries many new decisions oftentimes and, as Indie Campers, from year to year has grown, changed and evolved remarkably, some decision analysis deterrents need to be faced and diverted as accurately as possible. Being dynamic pricing one main strategic decision for 2018, internal metadata and external analysis are crucial to assert a well-defined quantitative price strategy and a well-informed qualitative value proposition. The deterrents that are challenged and recommended upon are the lack of adequate internal metadata – adequate in a sense that expansion and growth have increased in such a way that raw data from homologous periods is fairly incomparable – that makes it hard for the company to compare data and apply it to yearly forecast; the lack of resources – being time one of the most valuable, due to scalability and fast-moving growth – that makes it hard for the company to assess macro and micro indicators to understand the environment in which Indie Campers will be competing in and, ultimately, the lack of tools and models to apply in the future that, combined, make setting dynamic pricing a comprehensive and mark-up decision.
Table of Contents
1. Introduction ... 1 1.1 Context ... 1 1.2. Work project Objectives ... 2 2. Literature Review ... 4 2.1. Forecasting in Start Ups ... 4 2.2. Pricing positioning ... 5 2.3. Dynamic pricing ... 5 2.4. Tourism analysis ... 5 3. Immersion ... 6 3.1. Context ... 6 3.2. Data and Indicators ... 6 4. Competition and Benchmark ... 7 4.1. Competition ... 7 4.2. Benchmark ... 7 5. Expansion Strategy ... 8 6. Analysis ... 9 6.1. Metadata ... 9 6.2. Model ... 9 6.2.1. Forecast Model ... 9 6.2.1.1 Seasonality ... 9 6.2.1.2 Revenue Streams ... 10 6.2.1.3. Number of contracts estimation ... 11 6.2.1.4. Assumptions ... 116.2.1.4.1. Business activity ... 12 6.2.1.4.2. Operations ... 13 6.2.1.5. Forecast Model Development ... 18 6.2.2. Internationalization Model ... 21 6.2.2.1. Macro Tourism Indicators ... 22 6.2.2.2. Micro Competition Analysis ... 22 7. Topic explanation ... 23 7.1. Sources used ... 23 7.2. Limitations ... 24 8. Conclusions ... 24 8.1. Main findings ... 24 8.2. Recommendations ... 25
1. Introduction
1.1 Context
In 2013, after a trip to Australia, Hugo Oliveira and a friend created Indie Campers, an online rental company of campervans; vans adapted and produced for camping. Camping and providing travellers with the ultimate road-trip experience was the goal from the beginning and that experience starts in the channels the Start Up has always chosen to operate in; the website and, further on, the commercial department. Through the website, the whole booking process can be completed, choosing between the 7 models available, the extras and making the reservation per se. Thus, as one of Indie Campers’ core aspects and concerns are the touchpoints until the pick of the van, the website, the confirmation e-mail and the commercial department always bear in mind that “customers are Indie Campers’ best friends” and the CEO believes that is what makes the difference in the whole process.
Indie Campers debuted with 6 vans in 2013 and Hugo was sure the market was ready for the introduction of the campervan concept in the Portuguese tourism industry. In a matter of two years – 2015 – the Start Up grew to be renting 25 vans. 2016 was the year Indie Campers started to establish its position as one of the biggest growth Start Ups in the Portuguese tourism sector. Indie Campers had more than 100 campervans available and yield a revenue of more than 1.5 million euros that year. For 2017 the potential did not cease and growth kept its uphill trend; 6.4 million euros in revenue and 424 campervans in 4 different European countries. Indie Campers is nowadays the biggest campervan rental company in Europe and its expansion and growth are planned to keep increasing. The strategy for 2018 is designed so that Indie Campers will operate in 5 new countries and have a fleet of more than 1000 campervans available.
As Indie Campers’ main focus is on digital platforms, in addition to the reservation process that is all through the website, its communication channels follow the same pattern. The
exploration of this niche – being niche not synonym to small – tourism market is channelled mainly through the website, social media and search engines. Thus, nowadays Indie Campers enjoys from 31.77% of organic traffic.
The customer service, the experience and the personalization are what defines Indie Campers as a company. The serious, though, outgoing character is what makes customers rely and enjoy, as descripted on the website, “deep passion for traveling and bold living, our keen desire is to restore authenticity and add a dimension of adventure to our travellers’ journeys. We are committed to delivering an outstanding customer service, and a memorable experience.” As growth is on sight, Indie Campers does not forget where it aims at, not only growth and expansion but leading the industry shift towards lean, sustainable and honest industry practices.
1.2. Work project Objectives
This work project aims to solve an organizational challenge that is a combination of three features: Forecast; analysis of competition and macro tourism indicators and dynamic pricing. Gathering, how can forecasting and analysing competition and tourism indicators be applied into setting a dynamic pricing range. Firstly, forecasting will settle the costs and business volume to, ultimately, reach a cost per unit – being the unit each rented night – that will serve as a base to mark-up on to settle the bottom bar of the dynamic pricing. Secondly, the analysis of the competitors to acknowledge how much are competitors charging to settle, according to the positioning strategically chosen, the top bar of the dynamic pricing. Lastly, tourism indicators will enable Indie Campers to understand and communicate the value proposition to its customers and to match the dynamic pricing interval with the related tourism figures in each country Indie Campers is present or wants to internationalize to. Taking time to forecast, analyse micro and macro indicators and asserting that to a concise pricing strategy is one major step and indication that a Start Up – Indie Campers in this case – is scaling up. Therefore, as Start-Ups take-off and start growing on solid ground, adjusting quickly and having a highly
motivated team that fits many functions or departments in each person starts burning out and Start Ups need to be ready to scale up and, for that purpose, they need to know how, where and for how much to scale up.
Scaling up by forecasting and analysing the business environment is a major process and step because medium/long-term planning such as pricing, recruiting, training, analysing or developing will surely be taking some time off the short-term problem solving, respond for selling or adapt to enter uproar, a common practice amongst Start Ups. These short-term core activities will not cease and having people with this set of skills and mentality is definitely a plus because if the Start Up does not survive the short-term, the long-term will never be acquainted. Though, scaling up is nothing but keeping this whilst adding medium/long-term planning and developing not to leave any blind spots that can drag the company backwards Forecasting is one of the pillars for a group of these medium/long-term planning measures because, to forecast, data needs to be processed, metadata analysed and after the activity is forecasted and the assumptions stated, pricing, recruiting, training, developing, planning and re-analysing have a better defined and settled base to work on and to manage expectations. Though, in the case of Start Ups, the values utilized to forecast are necessarily based on metadata or assumptions that are supported by limited historical information. The absence or the limited data that relates to the current position the Start Up is at, means forecasts must rely on assumptions and extrapolations. Thus, as a forecast must yield a result that is a good estimate and, as forecasting starts to be done, capturing data becomes systematic, increasing the amount of metadata Indie Campers has to work with at the outset, providing ever-increasing accuracy for forecasts and a base to settle the bottom bar of the dynamic pricing.
Competition analysis is another pillar that makes medium/long-term strategies more sustained. This analysis will make sure Indie Campers’ price range is not deviated and will be the second tool to complete the dynamic pricing interval. By acknowledging how much competitors are
charging, settles a base to establish the top bar of the dynamic pricing. It can either be below or above competitors’ pricing level, depending on the positioning Indie Campers chooses to stand on. Complemented with a city attractiveness tool – the third pillar – that, in a macro perspective, analyses tourism indicators and gives a more comprehensive tool to understand the value proposition of the dynamic pricing range, the model is complete and with this, costs will not exceed the bottom price, positioning against competitors is a fully informed decision and the value proposition to potential customers matches the pricing interval. Given this, the pillars, altogether, uphold the tools to achieve an accurate and adjusted dynamic pricing range.
2. Literature Review
2.1. Forecasting in Start Ups
Forecasting nowadays, besides being of upmost importance, is becoming easier due to data availability. Though, the accuracy and the way data is treated and analysed is what dictates the practical applicability of forecasting. Companies will find it increasingly difficult to survive if they are not basing future operations on an accurate forecast (Lancaster G.A. & Lomas R.A., 1985). The importance of forecasting in modern business is not only with concerns to the future and expectations. The plans, at some point, become effective and they need information about prevailing circumstances (Waters, 2002). As literature points out, forecasting might put at stake the survival of a company, that is why Start Ups must devote attention to this planning strategy because for Start Ups, in which data is not fully available and assumptions take much time to settle accurately, forecasting becomes even more difficult and demands extra acumen. Despite forecasting methods and respective literature are not fully comprehensive of Start Ups’ reality, they set for a good ground to work on.
To forecast the cost per unit, one of the major pillars to relate pricing with profitability, means companies can ensure their product and service costs do not exceed market prices, so, they can guarantee long-term profitability (Hoozée, S., Vermeire, L. and Bruggeman, W., 2009).
2.2. Pricing positioning
Pricing highly affects a company’s rate of profitability and retention levels (Hinterhuber 2008) and choosing a pricing strategy is what determines how companies choose to, first of all, position themselves in the market, then, the knowledge they have in the market so they can choose to price according to costs, competition or value (Hinterhuber 2008). To price based on value, a mix of market knowledge, competition, company costs and value proposition need to be carefully established and communicated so the positioning chosen matches the value the company aims to communicate.
2.3. Dynamic pricing
Deriving from pricing positioning, dynamic pricing – the study of determining optimal selling prices under changing circumstances – needs a positioning strategy as well. Though not for a singular price level, but rather for an interval in which prices can oscillate, flexibility in pricing and the ease in which demand can be analysed has made dynamic pricing a considered empirical method. Pricing, per se, has become easier with the emergence of the internet as a sales channel. Web based businesses can adapt their prices without any additional costs or efforts other than plugging the new digital price tags into the system (Kalyanam et al., 2007).
2.4. Tourism analysis
As a concise analysis of the tourism was conducted, literature on this subject was considered as well. Though, this area mirrors the industry’s fragmentation and absence of defined structures signalling, thereby, that tourism as a field of study still requires a more solid conceptual basis (Cooper et al. 2008). The tourism sector, despite being atop the economy’s most important sectors, has infrequently been studied from a strategic network viewpoint (Donaire, Silva and Gaspar, 2009). As the sector is defined by a multi-sectoral nature, with distinct yet interdependent actors and activities, the network approach has always had to respect this fragmentation of the industry (Cooper et al., 2008). This justifies the concise and carefully
planned approach to the tourism sector, because tourism figures, when related to historical Indie Campers values, will always rely on a comprehensive qualitative evaluation.
3. Immersion
3.1. Context
To properly approach the organizational challenge, a methodology to fully understand the Start Up needed to be accomplished, as so, my internship started in an immersion period within the company in which I undertook meetings with all the company’s departments, accompanying José Figueiredo, the Head of Growth and Internationalisation, to understand what were their limitations in terms of procedures, their acknowledged budgets and main tasks within Indie Campers.
3.2. Data and Indicators
Afterwards, for my own understanding and integration and as the second step of the methodology chosen, I collected data internally to have an overview and quality insights on the company’s revenues and costs, the marketing expenditures, customer acquisition cost and fleet-wise figures, from its acquisition, transformation, outside design, insurance and transportation. The change of models throughout the years, the different pricings for each model to the occupancy per nights per model.
Indie Campers had recently launched its internal reporting platform that gave me the freedom to explore and analyse data from various departments and from recent activity. From there, besides the insights, I got raw data that could potentially be converted into metadata. Whilst going through this process I oftentimes undertook informal interviews with José Figueiredo and occasionally with the other departments and the CEO to understand what were the main data, metadata or KPIs they looked at when trying to understand performance of the company and in what were they basing their decisions on to conclude on growth, budgeted forecast, company needs and the internationalization process.
4. Competition and Benchmark
4.1. Competition
To understand the competitive landscape, desk research methodology was applied. Therefore, I made a research with the major keywords such as “campervan rental” or “motorhome holidays” to have an unbiased research process to, afterwards, compare it with the marketing team to acknowledge if they were aware and agreed with the competitors I came across during my research.
I took every relevant competitor’s company name, its headquarters nationality, which brands and models were they renting, how many people could each model sleep, in how many locations were they operating and for each location I made a weight indicator based on the tourism traffic so I could get one comparable figure of the presence of each company throughout Europe. Additionally, I collected data on whether each company offered a one-way possibility (to pick-up and drop-off the campervan in different locations), what was the minimum rental period and if there were any limitations on the kilometres that could be done each day. Then, for seasonality terms, the nightly rates per model were collected for each month and since the strategic team was figuring whether to charge nightly or daily in 2018, all the related data was collected and furtherly analysed. (Refer to Appendix 1 for the detailed table)
4.2. Benchmark
Similar to the competitors’ analysis, a benchmark analysis was conducted in the countries where the campervan industry was already well established and major players were settled. New Zealand, Australia and the United States of America’s major campervan companies were likewise analysed to benchmark the European market and Indie Campers as a player. The industry in Europe was a few steps behind the benchmarked countries, though, Indie Campers and 3 other European major players – Wicked Campers, Kuku Campers and McRent –were
already delivering tantamount quality services and settling its leading positions in the market. (Refer to Appendix 2 for the detailed table)
5. Expansion Strategy
The expansion strategy follows a rationale of geographical proximity, which eases factors such as withdrawing allocated resources, cultural proximity, risk mitigation and increases propensity to succeed. This can be explained through the Uppsala internationalization model that refers to these aspects as psychic and physical proximity (Johanson, J. & Vahlne, J.-E. 1977). Market knowledge is the second aspect the model states that fits into the way Indie Campers internationalizes. Researching economic and tourism specific indicators explains the second unit of analysis and action Indie Campers goes through and, according to the model, are the state and change aspects in which market knowledge and, later, resource allocations take place. That explains the two main strands Indie Campers focus on while internationalizing. First, the proximity and market knowledge have led the Start Up to move from Portugal to Spain and settle there for one year. In 2017, one year later, following the same criteria, Indie Campers decided to expand to Italy and France and this strand explains the psychic and physical proximity as well as market knowledge. The second one follows the specific market knowledge and committed resources in which Indie Campers takes risk when settling depot locations by investing in warehouses and assigning vans to those depot locations and then, to test the market, remote locations were created in such a way that the depot locations and the vans in these locations are the base to serve remote locations that have no committed resources and no initial investment. Palermo, as an example, was tested as a remote location to Catania and, as Palermo turned out to be a profitable remote location and the number of contracts in 2017 was high – 26 in Palermo out of a total of 78 zone contracts in Catania –, for 2018, Palermo will become a depot location. As an opposite example, San Sebastian that was a remote location to Bilbao, the depot location, was decided to be let go because Bilbao had 345
contracts in 2017, out of which only 3 took place in San Sebastian, the remote. For 2018, and as a first insight into the assumptions for the forecast, the internationalization locations were decided based on the same criteria, informally named as stain expansion strategy at Indie Campers. Thus, after Portugal, Spain, France and Italy in 2017, for 2018, Indie Campers will expand to Belgium, Switzerland, Holland, Croatia, Germany and the United Kingdom.
6. Analysis
6.1. Metadata
With the previous information gathered, I could start narrowing down my analysis and the assumptions I should base my work on, starting to convert raw data and insights into metadata to define the model and achieve the dynamic pricing tool with the combination of a forecast, that will figure the cost per unit and, consequently, decide on the bottom bar of the dynamic pricing. With the competition landscape, that will enable Indie Campers to decide where they want to position themselves by setting the top bar and with the macro tourism indicators to understand how well the pricing range fits each location.
6.2. Model
6.2.1. Forecast Model
The forecast model is based on historical data, calculations to adjust historical data, assumptions and has as an output easily analysable and relatable metadata. Thus, to state the assumptions, three pillars must be highlighted before, due to the background base they serve as to the whole model. The three pillars are the seasonality, the revenue streams and the number of contracts estimated.
6.2.1.1 Seasonality
Seasonality, especially in the tourism sector, influences the business throng throughout the year and, to accurately forecast, this variable must be cautiously stated and, if the locations Indie Campers is internationalizing to suffer from different seasonality variations, they must, as well,
be properly adjusted. To accomplish historical seasonality, the number of contracts per month in 2017 was divided by the yearly contracts per location, giving the percentage of contracts in each month. Though, as stated before, to use these values for the forecast, care must be taken because in 2017 Indie Campers started with 96 active vans and ended up with 424 so, for the forecast, seasonality should be isolated from growth because these values will influence the number of contracts and, consequently, the number of nights sold. Therefore, the same precautions must be adopted when seasonality is used as an assumption for other forecasts, given that seasonality is one of the drivers influencing the forecast for the number of vans needed per month in each location and the number of operations’ employees ideally assigned. Thus, as the number of vans for 2018 is forecasted to have a maximum size to meet demand in high season, but during low season the new strategy is to decrease the fleet – by selling the vans – to a point where a maximum of 30% of the vans will be parked in the warehouse, seasonality will play a crucial role on this part of the forecast. For the new locations, as historical values do not exist, the seasonality used was the weighted average of all the active locations in 2017 with a comprehensive adjustment to isolate the growth from 2017 historical values. (Refer to Appendix 3 for the seasonality calculations table)
6.2.1.2 Revenue Streams
The second estimation measure used to forecast revenue distribution was the percentage of each revenue stream deducted from 2017 data. First, and with an average of 76,24% weight on the whole revenues, are the daily price charges. Then, all the other revenue streams – insurance, extras, pick-up and drop-off fees, one-way fees, service fees and additional charges – were calculated as a percentage of the daily price revenues so that, to be forecasted, the nightly revenues will be calculated based on the number of nights sold and respective monthly prices so that the other streams can be deducted and forecasted as a percentage of these figures. (Refer to Appendix 4 for the revenue streams calculations and figures table)
6.2.1.3. Number of contracts estimation
The number of contracts was calculated based on the growth Indie Campers has been incurring in in the last 3 years – 400% on average. As so, and complying with the already stated expansion strategy and plan, the number of contracts from 2017 to 2018 was assumed to grow at an average rate of 410%. This rate was deducted from homologous periods in different locations as follows: For Spain, the growth from 2017, the second operating year in the country, to 2018, the third, was calculated based on the growth in Portugal from the second operating year to the third. In France and Italy, 2018 is going to be the second operating year so the growth was calculated based on the average growth of every location in Spain from the first to the second operating year. For the new locations, the ratio between airport traffic and Indie Campers customers was calculated for all the existing locations and applied to new locations’ airport traffic to reach an approximation of potential clients and to allocate the nights sold and the vans to each location. The monthly contracts were analysed and due to the growth of the Start Up during 2017, the percentages applied to January – a low-season period – were higher than the percentages applied to November – low-season period as well. In January 2017, Indie Campers registered 53 contracts and in November the number was at 467. Assuming Indie Campers will be more stable in 2018, the forecasted number of contracts calculated for 2018 was 500% higher than 2017 for January and 300% for November, in order to smooth the growth effect, though, considering there would still be growth throughout 2018. In total, it was assumed the number of contracts would grow 410%, meaning there would be an increase in the number of contracts from 5812 in 2017 to 23830 in 2018. (Refer to Appendix 5 for the allocation of contracts monthly and per location)
6.2.1.4. Assumptions
The assumptions are, by definition, the pillars to base a forecast on and, according to the accuracy demanded for a practical and applicable forecast, these assumptions were either based
on historical information, given by the Start Up as new strategic decisions or given by departments who have forecasted their activities. Thus, they can be divided into business activity and operations assumptions.
6.2.1.4.1. Business activity
Business activity assumptions accrue to all the assumptions that are not directly related to the operating activities, though, have influence on operations. These assumptions can be straightforward applicable to the forecast such as the marketing expenditure and the human resources at the headquarters or can be assumptions that affect the approach chosen for the forecast such as nightly charging and dynamic pricing. This last one is, while on the subject, directly related to the way recommendations are concluded upon.
Nightly charging refers to the way Indie Campers charges its clients. The assumption is explained as follows: there are six charging options for this kind of business, being them charge nightly, daily or by every 24 hours a campervan is rented. Within each option, charging can be fixed or flexible. To understand the strengths and weaknesses of each option, KPIs were assigned and a score from 1 to 3 was given to each so that a final score could be reached to have comparison terms. (Refer to Appendix 6 for the KPIs table and respective scores) The strategic – though thoroughly analysed – conclusion was to charge nightly with flexibility. Thus, as during the current year it was charged daily with flexibility, processes changed and the forecasting approach must take that into consideration.
Dynamic pricing was a strategic decision that levers the benefits of capturing more value from market demand oscillations, that gives good insights and data on demand itself and continuously adapts to changing circumstances giving Indie Campers more flexibility and good opportunities to collect data, while also decreasing effort by avoiding manual pricing changes. To properly construe a dynamic pricing strategy, there must be reached a bottom and top bar
for which prices cannot exceed and the variables that make the price oscillate defined, asserted and properly weighted.
Marketing Expenditures were completely forecasted by the marketing department and are directly applicable to the aggregated forecast. The marketing department was given, for 2018, a budget of approximately €3,9 millions and allocated it according to the needs, expectations and plans for next year. This given budget will also be a good indicator for the assertiveness of the aggregated forecast because Indie Campers has internally decided, and they have historically been compromised to this measure, that marketing expenditures could not surpass 20% of the whole revenues.
Human Resources at the headquarters relate to the payroll costs of Indie Campers for 2018. The actual payroll sheet was summarized and updated for 2018 for the employees currently active in the Start Up and for the new positions that will be made available, the entry dates, expected monthly wages and headcount was stated so that a monthly cost could be discriminated and a yearly cost could be deducted.
6.2.1.4.2. Operations
The assumptions related to operations start with fleet size and are based on the number of contracts estimated previously, given that these two figures will allow for a good forecasting base for the whole operations’ activity. Therefore, to calculate the total vans needed, the number of contracts per van in 2017 was reached – 13,71 – and assuming that market experience and knowledge will let for better allocation of vans and increasing efficiency of the operations’ department will let for higher efficiency in van preparation, it was assumed that the contracts per van in 2018 would grow 47%, to 20,14 contracts per van. With these numbers – contracts and number of contracts per van – the number of optimal vans for 2018 was calculated: 1183. (Refer to Appendix 7 for the allocation of vans monthly and per location) Though, as Indie Campers is applying a de-fleeting strategy for 2018, this number of vans is
the maximum number of vans needed to serve the forecasted number of contracts. De-fleeting strategy is being thoroughly discussed with Giovanni, an external consultant to Indie Campers, and, even-though the total fleet size is already established, the de-fleeting, when applied, will promote fleet size fluctuations during the year in accordance with seasonality. The de-fleeting strategy aims at optimizing warehouse costs and all the costs associated with unused vans. In parallel, this strategy wants to use the vans for a small amount of time so they can be sold easily and above the cost of acquisition because the vans can be acquired at a quantity discount that allows for the re-selling of the vans to generate revenue.
The number of nights sold was calculated directly from the number of contracts, the average number of nights sold per contract in 2017 was calculated monthly and for 2018 it was comprehensively assumed a slight decrease – 5,8% – would happen due to the shift from charging daily to charging nightly. This shift explains that, for short rentals Indie Campers loses one charging period. For example, in a weekend rental instead of charging Friday, Saturday and Sunday – the daily charging – Indie Campers will only charge for two nights, Friday to Saturday and Saturday to Sunday. In January, for example, each contract will last 7,42 nights on average, meaning that for this month, the number of nights rented is forecasted at 1766; 7,42 nights times the number of forecasted contracts, 238. (Refer to Appendix 8 for the allocation of nights sold monthly)
Then, the contracts, nights sold and vans were allocated to each location according to the growth rates explained previously. Hence, warehouse costs were forecasted. For each existing warehouse, a parking space availability analysis was conducted to see which warehouses should be kept and which ones should be rehired to fit the number of vans forecasted for 2018. For this exercise, it was assumed – as advised by the strategic team – that each van needs 30 square meters for warehouses that would accommodate between 1 and 10 vans, for 10 to 20 vans the space per van is 25 square meters and for more than 20 vans the square meters needed
figure at 20 per van. Taking this into account, the warehouse cost per van was calculated for Lisbon – €75 – and having this as a basis, all the warehouse costs per van for the other locations were calculated as a percentage of this value with the number of vans allocated to each location. These percentages took into account the cost per square meter for the real estate market in the areas where the new depots will be located. Thereby, to reach a monthly warehouse cost per location, the warehouse cost per van was not multiplied by the total number of vans allocated to that location but rather by one third of the needed vans for that locations. Explanation is that as Indie Campers is de-fleeting during low-seasons and during high-seasons the occupancy rate will be between 75% and 100% the Start Up intends not to park in the warehouse more than one third of each location’s assigned vans. (Refer to appendix 9 for the overview of warehouse costs). To complete warehouse forecasting accurately, utilities need to be added to the warehouse costs so electricity, water, condo and internet costs were lifted from 2017 and applied to the forecast assuming values would remain equal and during low-season months these costs would be two thirds of the total because consumption of all resources is lower. For the new locations, the cost for France served as the estimation because it was the highest value and assuming these costs do not vary much across European countries, using the highest estimation gives a margin not to underestimate costs.
Afterwards, the number of operations’ employees needed each month and the respective function was calculated for each location, therefore the cost of each function – the operations’ employees’ wages – was settled and adjusted to each country. This adjustment was based on the assumptions given by Indie Campers for the operations department in Portugal and were compared through the minimum wage for each country and properly accustomed to Indie Campers reality. The categories of the operations department are segmented as location manager, location manager assistant, client manager, cleaning officer, shuttle officer and remote location manager and the wages, relative to Portugal, vary from -21% in Croatia to
110% in Switzerland. Furthermore, the operations’ employees were asked to fill a survey regarding the time each task per campervan rental takes to be completed. The tasks regarded airport transfer, pick-up and drop-off, cleaning, preparation of the van and other activities. With this, the number of needed working hours, per activity and in total, can be stated and as each operational works 8 hours per day and, for example, for January, there are 22 working days, subtracting the vacation days (divided equally throughout the year), and giving a margin of 2 days that represent justified absence divided by 12 (so they can be allocated monthly) gives 18 working days in January. These 18 days multiplied by the 8 daily working hours give the availability of one operational for each month in terms of hours. When the total activity hours – number of contracts times the time fragments each contract needs – are divided by the available working hours for each employee monthly, it equals the number of operational employees needed each month. Considering the number of contracts forecasted, the available working hours per employee, the total absence and the vacation days, the number of total assigned employees per location was settled. As then, the number of operations’ employees per location per month was established and the corresponding costs per operational function were assigned, the total costs of the operations department were forecasted for each location and discriminated monthly. (Refer to appendix 10 for operational employees’ headcount, cost per function and time spent per function)
Two other operational costs that make for the assumptions are the relocations’, which accrue to the costs of moving a van from one depot to another one nearby to meet demand due to shortage of vans, and the remotes’, which are the locations made available to offer pick-ups and drop-offs outside, though close-by, the depot location. The relocations were calculated for the existing locations by dividing the number of relocations made to that location by the number of contracts in that same location in 2017. Then, for the forecasted number of contracts in 2018, this percentage was applied to each location. Having the number of relocations, a cost per
relocation to each depot must be reached. For each depot location, the number of kilometres apart from the closest one was obtained and the cost of fuel and tolls for each relocation was estimated. For each route, the tolls’ costs were lifted and with these two variables, the costs assigned to each depot could be multiplied by the total number of relocations forecasted per location and reach the total relocation costs. (Refer to appendix 11 for relocations’ percentages and costs).
The remote costs follow the same rationale. For each depot that has remote locations attached, the cost of tolls and fuel was estimated based on the distance and itinerary from the depot to the remote. The number of remotes for 2018 was decided based on historical data from last year. As explained previously, remote locations are a way to test the market without committing resources and investing in infrastructure, as so, withdrawing from some remotes has no costs associated and means the market was tested and either it was not ready or it had not enough business volume to justify the costs. In 2017, Indie Campers decided to withdraw from 19 remote locations, because the benefits of retiring would be higher than the losses and created 9 new to test the markets. Similar to the relocations, the number of remote contracts was divided by the total contracts of the origin depot in 2017 and those percentages were applied to the number of contracts forecasted for 2018. For the new locations, depending on the number of remotes attached to the depot, a cost per remote – or an average cost of remotes if there is more than one to a location – was calculated based on distance – extrapolated to fuel cost and tolls. (Refer to appendix 12 for remotes’ percentages and costs)
The last group of assumptions are the costs per booking of unplanned events such as repairs, constant costs such as laundry, that is done in the end of every booking, and material wearing such as warehouse consumables and extras, which have lifecycles. All these costs were calculated for each country Indie Campers is operating in, because discriminating for locations would not have noticeable differences from one to another within the same country. For
laundry and repair, the historical costs were lifted from the accounting records and divided by the number of bookings, giving a cost per booking that, for repairs is an assigned cost and for laundry is the estimation of the actual cost per booking. The consumables were, as well, lifted from 2017 data and divided monthly so it can be forecasted as a monthly cost. The extras were analysed following a lifecycle criterion. First, the purchase of extras for each location was deducted and then, the lifecycle of each extra was deducted from those purchases. The total cost of extras was divided by the number of contracts giving an extras’ cost per booking that was used in the forecast multiplied by the number of contracts assigned to each location.
6.2.1.5. Forecast Model Development
The final step to have all the data for the final recommendations is putting all the information together, work with the data properly and forecast the costs and the business volume for the coming year based on the assumptions and derived from historical data. Ultimately, have a synthetized and self-explanatory cost forecast either aggregated and discriminated per location. (Refer to appendix 13 for the aggregated model). After the costs and the operations’ figures are summed up, the cost per unit – how much each rented night costs – is calculated based on total costs and forecasted number of nights sold and a minimum level of revenue is calculated based on that cost per unit – also known as zero-profit price point – and the revenue streams discriminated. (Refer to appendix 14 for the calculations). With all this information, a monthly P&L can be forecasted for 2018 for each location and aggregated. This cost per unit is the zero-profit price point because, as the total costs are divided by the forecasted number of nights rented, it means that, by the end of the year, the revenues at the zero-profit price point will equal the total costs. Nonetheless, Indie Campers breaks-even whilst mathematically applying this price point in all the locations except for Palermo and Cagliari. Which means that, even-though revenues equal costs by the end of the year, during the period between the breakeven
point and the 31st of December 2018, Indie Campers is profitable. (Refer to appendix 15 for
the graph)
As the company challenge did not have has a goal finding the quantities to break-even, this point was only calculated to analyse if Indie Campers could have revenues above costs at some point even though by the end of the year, these zero-profit price points would give zero returns. So, the break-even point, that theoretically aims at finding the quantities, for a certain price point, was inherently reached and gave an overview of the revenues compared to costs over the year. As referred before, the zero-profit price point as a conclusion of the forecasted costs in 2018, is one of the major breakthroughs of this work project.
Data was gathered and allocated to every location and then summed up for the aggregated figures. The first three sections of the model come from the data and assumptions stated before and are the base for the forecasting model. These sections are the primary data, the operations activity and, derived from the last one, the allocation of human resources to operations activity. Primary data gathers the number of available and working days per month, the seasonality for 2018 and the average nights sold per contract per month for each location. Then all the contracts and nights sold, that were previously calculated, are allocated to the data field, as explained in the assumptions. The contracts are deducted from the assumptions and allocated monthly by the seasonality. Then, if applicable, the remote contracts are calculated based on the percentage stated in the assumptions times the total contracts. Moreover, the number of nights sold monthly is calculated based on the number of contracts and the average nights per contract that change monthly and come from the assumptions. After this, to have the number of operations’ employees monthly allocated, the number of contracts is divided by the available days in each month so a number of contracts per day is achieved and, with the operating time needed per booking, the number of operations’ employees achieved. With the same rationale, but for the optimal number of vans allocated per month, the number of forecasted monthly nights sold is
divided by the number of available days in each month and – knowing that each van can, at most, be rented for 100% of the available days –, on top of this number, a margin is added up so the occupancy rate of the vans is always between 71% and 96%.
The final data set that brings all the elements together and makes way for the recommendations starts with the costs that are divided into operational, marketing, fleet and human resources’ costs. The operational costs derive directly from the assumptions and are, on this section, assigned to each location and calculated for warehouses – derived from the warehouse cost per van –, relocations, remotes, repairs, extras, laundry, utilities and van equipping. The marketing costs that, as explained previously, were forecasted and budgeted by the marketing department were allocated to every location by dividing the total costs by the number of contracts in the aggregated model and then allocated to each location by multiplying that number by each location’s contracts. Fleet costs that was a given assumption as it is being discussed by the strategic department with an external consultant and the CEO was divided, on the aggregated segment, by the number of vans and allocated to each location by multiplying that number by each location’s assigned vans. Thus, the human resources costs that, for the number of operational employees needed monthly in each location and the respective wages was forecasted by José Figueiredo and me as explained before, the marketing human resources was given by the marketing department and the headquarters human resources costs, excluding the marketing department, were given by the human resources’ department. With this set of data, all the costs are settled. With the primary data that gives the business volume for each location allocated monthly and the total costs that are divided the same way, the calculations segment that achieves the cost per unit, the revenues discriminated by revenue streams, the total net income and the inherent breakeven point is ready to be established.
These calculations are as follows: Monthly cost divided by number of nights sold (ratio done for operational costs and total costs) will accrue for the cost per unit that is applicable through
how much Indie Campers should charge per night to achieve a zero-profit price point each month and, when calculated with the yearly figures, the yearly cost per unit will give a good basis to mark-up on to achieve the bottom bar of the dynamic pricing. Though, as this price is calculated with the total costs and the number of nights sold, this value is still not accurately decomposed because the revenue streams other than the nightly revenues are not included in the price charged nightly. As so, the price to charge nightly is the value achieved with this ratio divided by 1+[percentage of fees, extras and insurance to the nightly revenues]. Thus, the fees, extras and insurance can be forecasted based on the nightly revenues forecasted and the percentages assigned for 2018 derived from 2017. For the aggregated values, the zero-profit price point was reached at €53,35, assuring that, if Indie Campers charges this price for all the nights sold in 2018 by the end of the year the revenues will equal total costs, giving zero profits. Thus, though not being the purpose of this analysis, a breakeven point is inherently reached as well because despite this zero-profit price point equals costs to revenues by the end of the year, Indie Campers is profitable in October and November. The breakeven point is reached by the 169 330th night sold that will occur on the 15th of October 2018.
6.2.2. Internationalization Model
Parallel to the forecast, a model to gather competition data and provide Indie Campers with the option to evaluate competitors and the option to choose on pricing positioning was developed. This section is not as strictly quantitative as the forecast because it requires a qualitative appreciation and full comprehension of the results to, potentially, acknowledge where the top bar of the dynamic pricing should be settled at. The final result is a percentage of how much can Indie Campers increase its prices to reach the average of the prices all competitors operating in that country are practicing. Along with this analysis a research on city attractiveness was developed so the positioning is decided not only based on competition but with macro market knowledge and adjusted to each locations’ reality.
6.2.2.1. Macro Tourism Indicators
For the macro analysis, a city attractiveness tool was developed to, firstly, analyse how attractive a new location is. By acknowledging the number of airport arrivals to each location, historical record of the percentage of airport arrivals to the number of Indie Campers’ inbound customers is lifted and applied to the new locations. With this, a number of possible customers is approximated. Then, an extensive analysis of Indie Campers’ customers nationalities was done to achieve the top 15 nationalities that amount to 87,66% of the contracts sold in 2017. A percentage of each of these nationalities traveling to these new locations is extracted from statistical data and applied to the total inbound travellers to that country to have a more precise potential customer pool. The second part, the macro environment analysis was, firstly, lifting the percentages of each of the 15 nationalities average expenditures on accommodation and transportation – that represent what a campervan offers – in regard to the total expenditure per day while travelling for tourism purposes in each of the countries Indie Campers will have new locations. These 15 nationalities spend, on average, 33% of their daily budgets whilst on vacation on accommodation and 32% on transportation. These amount to 65% of the total tourism expenditure being in transportation and accommodation for these nationalities, on average. Therefore, these percentages are multiplied by the average cost of tourism per day in the countries Indie Campers is already present and debuting and, in the end, an average of the expenditure of these nationalities in each country on accommodation and transportation is the output. Then, as a weight indicator this daily average expenditure is divided by the zero-profit price point to get a relative comparison on how above or below is the average expenditure of those nationalities whilst travelling to these countries compared to the cost per unit reached on the forecast.
6.2.2.2. Micro Competition Analysis
The micro environment analysis focuses on competition and, for a qualitative interpretation, I created a standardized formula on excel that collects data from a raw data worksheet to check
if, for the location Indie Campers wants to internationalize to, there are competitors originally from that country operating there and, if so, how many. Secondly, for the major competitors that were analysed and compared with the marketing department, following the same procedure, a formula gets the number of competitors operating in that country and, as prices for all the competitors were lifted, the average price competitors are practicing in that country is compared to the zero-profit price point in the form of a ratio. This point is calculated by dividing 1 by the cost per unit forecasted for Indie Campers in that country over the average of all the prices from the competitors operating in that same country minus one.
1/ 𝐼𝑛𝑑𝑖𝑒 𝐶𝑎𝑚𝑝𝑒𝑟𝑠 𝑓𝑜𝑟𝑒𝑐𝑎𝑠𝑡𝑒𝑑 𝑐𝑜𝑠𝑡 𝑝𝑒𝑟 𝑢𝑛𝑖𝑡 456789: ; 𝐴𝑣𝑒𝑟𝑎𝑔𝑒 𝑝𝑟𝑖𝑐𝑒 𝑜𝑓 𝑎𝑙𝑙 𝑐𝑜𝑚𝑝𝑒𝑡𝑖𝑡𝑜𝑟𝑠
456789: ; −
1
For example, competitors operating in Croatia are practicing prices 120% above the zero-profit price point, so, if Indie Campers wants to set the price below competitors it can set the top bar for dynamic pricing in Croatia until [Zero-profit price point*(1+1,2)].
7. Topic explanation
7.1. Sources used
The mix of empirical and theoretical framework are sourced from, firstly, my internship at Indie Campers and having the freedom to collect data and doing informal interviews and casual discussions with the other departments gave me most of the insights and the tools to collect the data and to approach the final recommendations in the best way. For the theoretical framework, most of the knowledge came from academic experience and further research throughout the semester. The statistical data collected sourced from Euromonitor, Eurostat, airports’ databases, each competitor’s website, indie campers reporting platform and Indie Campers’ internal documents.
7.2. Limitations
There were four main limitations during the development of this work project; first, it was hard to join a solid work project in academic terms with practical applicability for Indie Campers because concepts, at times, were not coincident and the balance between logical thinking, applicability and work project relatable material was hard to find. Secondly, as one variable of the challenge approached in this work project is the lack of data for Start Ups to develop accurate forecasts, collecting and treating data was one of my main concerns and, after this collection period, I had unrelated data and data that had the same background but with different outputs. Thus, when the time to narrow down the analysis and gather data to put the model together came, the excessive amount of data I collected and created was hard to relate and compose. Thirdly, and strongly related to the last one is the ever-changing landscape that provided many reinterpretations of the model and data adjustments throughout my internship. Lastly, the tourism indicators were a limitation because the availability of data in this area is very broad and aggregated. City specific indicators were not available which obliged statistical data to be extrapolated.
8. Conclusions
8.1. Main findings
Forecasting, analysing competition’s environment and macro indicators gives way for setting short-term goals and strategies and medium to long-term expectations, plans and strategical acts. Other than this, having dynamic pricing as one major strategic shift for 2018, made the forecast a good basis to understand where the bottom bar should be placed, made the competitors analysis a good tool for Indie Campers to have relative comparison terms and to choose where they may want to set the top bar on and position themselves against competitors. Lastly, other than understanding the total costs, the costs per unit, the bottom bar, the competitors, the positioning and the top bar, the macro analysis reflects the pool of potential
customers and how much are they spending in each of the locations Indie Campers is present on average. Therefore, Indie Campers can understand to which segment they are communicating and how much above or below the average expenditures on comparable services they want to have their dynamic pricings oscillating.
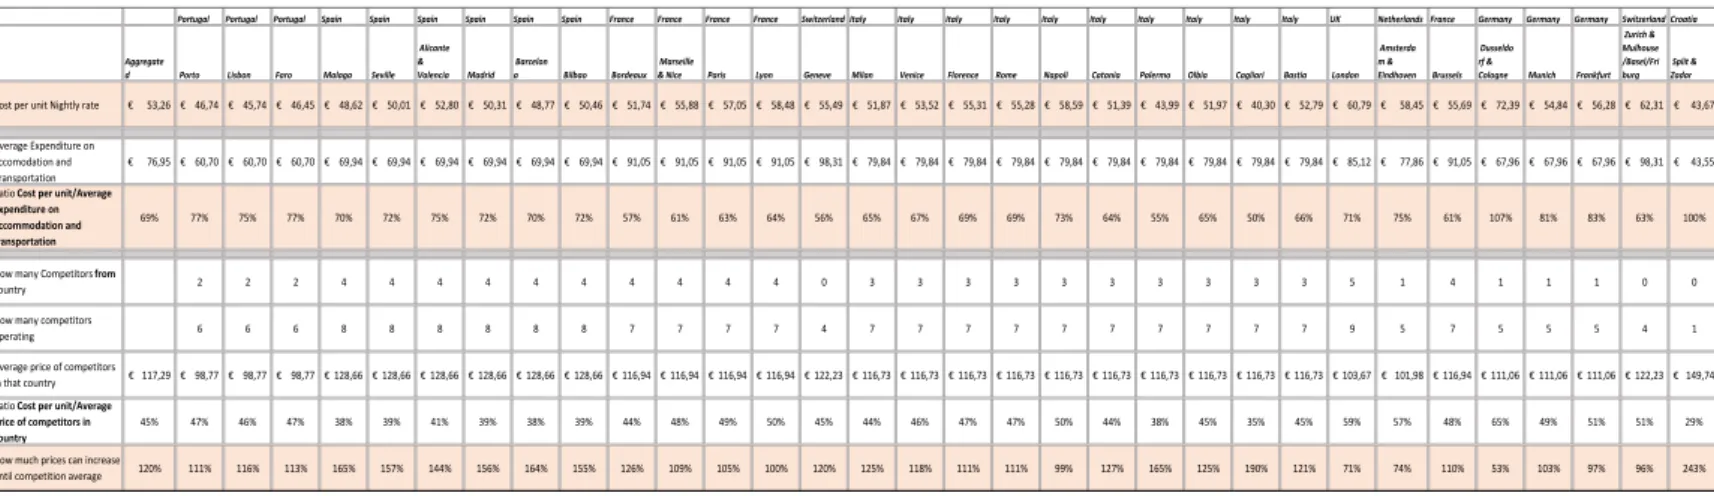
8.2. Recommendations
The final recommendations can be summed up in one table and to fully understand the final results, please refer to Table 1, presented below. In the table is presented the zero-profit price point for each location, the comparison with the average expenditures on transportation and accommodation for each country and the ratio of the cost per unit to the average price competitors are practicing in each country. Inside the whole model, a forecasting model is set and the way data was treated and assumptions stated makes the model replicable either to update throughout the year or to forecast for the upcoming years.
Wrapping-up, the recommendations settle information for Indie Campers to replicate the forecast, segment the market, decide on pricing positioning and apply it to the dynamic pricing, understand and compare the competitors’ landscape and, finally, choose with rigorous information the value they want to communicate to the potential customers.
Portugal Portugal Portugal Spain Spain Spain Spain Spain Spain France France France France Switzerland Italy Italy Italy Italy Italy Italy Italy Italy Italy Italy UK Netherlands France Germany Germany Germany Switzerland Croatia Aggregate
d Porto Lisbon Faro Malaga Seville Alicante & Valencia Madrid Barcelon a Bilbao Bordeaux Marseille
& Nice Paris Lyon Geneve Milan Venice Florence Rome Napoli Catania Palermo Olbia Cagliari Bastia London Amsterda m & Eindhoven Brussels
Dusseldo rf &
Cologne Munich Frankfurt Zurich & Mulhouse /Basel/Fri burg Split & Zadar Cost per unit Nightly rate € 53,26€ 46,74€ 45,74€ 46,45€ 48,62€ 50,01€ 52,80€ 50,31€ 48,77€ 50,46€ 51,74€ 55,88€ 57,05€ 58,48€ 55,49€ 51,87€ 53,52€ 55,31€ 55,28€ 58,59€ 51,39€ 43,99€ 51,97€ 40,30€ 52,79€ 60,79€ 58,45€ 55,69€ 72,39€ 54,84€ 56,28€ 62,31€ 43,67 Average Expenditure on accomodation and Transportation 76,95 € € 60,70€ 60,70€ 60,70€ 69,94€ 69,94€ 69,94€ 69,94€ 69,94€ 69,94€ 91,05€ 91,05€ 91,05€ 91,05€ 98,31€ 79,84€ 79,84€ 79,84€ 79,84€ 79,84€ 79,84€ 79,84€ 79,84€ 79,84€ 79,84€ 85,12€ 77,86€ 91,05€ 67,96€ 67,96€ 67,96€ 98,31€ 43,55 Ratio Cost per unit/Average expenditure on accommodation and transportation 69% 77% 75% 77% 70% 72% 75% 72% 70% 72% 57% 61% 63% 64% 56% 65% 67% 69% 69% 73% 64% 55% 65% 50% 66% 71% 75% 61% 107% 81% 83% 63% 100% How many Competitors from country 2 2 2 4 4 4 4 4 4 4 4 4 4 0 3 3 3 3 3 3 3 3 3 3 5 1 4 1 1 1 0 0 How many competitors operating 6 6 6 8 8 8 8 8 8 7 7 7 7 4 7 7 7 7 7 7 7 7 7 7 9 5 7 5 5 5 4 1 Average price of competitors in that country € 117,29€ 98,77€ 98,77€ 98,77€ 128,66€ 128,66€ 128,66€ 128,66€ 128,66€ 128,66€ 116,94€ 116,94€ 116,94€ 116,94€ 122,23 € 116,73 € 116,73 € 116,73 € 116,73 € 116,73 € 116,73 € 116,73€ 116,73€ 116,73€ 116,73€ 103,67€ 101,98€ 116,94€ 111,06€ 111,06€ 111,06€ 122,23€ 149,74 Ratio Cost per unit/Average Price of competitors in country 45% 47% 46% 47% 38% 39% 41% 39% 38% 39% 44% 48% 49% 50% 45% 44% 46% 47% 47% 50% 44% 38% 45% 35% 45% 59% 57% 48% 65% 49% 51% 51% 29% How much prices can increase until competition average 120% 111% 116% 113% 165% 157% 144% 156% 164% 155% 126% 109% 105% 100% 120% 125% 118% 111% 111% 99% 127% 165% 125% 190% 121% 71% 74% 110% 53% 103% 97% 96% 243% Table 1: Model to settle dynamic pricing range
9. References
Cooper, C., Fletcher, J., Fyall, A., Gilbert, D. and Wanhill, S. (2008). Tourism: Principles and
Practice.
Donaire, D., Pereira da Silva, M. and Antonio Gaspar, M. (2009). A rede de negócios do
turismo: um estudo sobre suas características e implicações estratégicas.
Hinterhuber, A. (2008). Customer value-based pricing strategies: why companies resist. Emerald Group, Journal of business strategy.
Hoozée, S., Vermeire, L. and Bruggeman, W. (2009). The Impact of Refinement on the
Accuracy of Time-driven ABC.
Johanson, J. and Vahlne, J. (1977). The Internationalization Process of the Firm-A Model of
Knowledge Development and Increasing Foreign Market Commitments. Journal of
International Business Studies.
Kalyanam, K. and Hanson, W. (2007). Internet Marketing and e-Commerce. p.Chapter 13. Lancaster, G. and Lomas, R. (1985). Forecasting for sales and materials management. London: Macmillan.
Makridakis, S. and Wheelwright, S. (1980). Forecasting Methods For Management. New York: AWiley-Interscience Publication.
Sohal, A. and Waddell, D. (1994). Forecasting: The key to managerial decision making. 32nd ed. pp.41-49.