A Work Project, presented as part of the requirements for the Award of a Master Degree in Finance
from the NOVA – School of Business and Economics
Growth is not over for Starbucks,
It is empowered by digital and Geographic
Expansion
Sofia Isabel Simões de Oliveira, 34018
Leonor Abrantes Santos, 33884
A Project carried out on the Master in Finance Program, under the supervision of:
Filipa Frade de Castro
Abstract
This paper is an equity research on Starbucks Corporation. During this report, it will be analyzed
the current status of the coffee retailing industry, how it is going to evolve in the future and how it
will influence Starbucks’ value creation. Moreover, Starbucks’ main revenue drivers will be studied
and projected until 2031, based on the company strategy and on the overall external conditions
affecting its activity. The result is the company’s cash-flows until 2031, which will be used to
compute the valuation of the company in 2020, using the fundamental analysis, predicting
Starbucks’ share price in this year. Lastly, it will be computed the return that shareholders should
expect, in order to release our final recommendation, which is to buy the stock.
Keywords (up to four)
Valuation
Research
Starbucks
Price
This work used infrastructure and resources funded by Fundação para a Ciência e a Tecnologia
(UID/ECO/00124/2013, UID/ECO/00124/2019 and Social Sciences DataLab, Project 22209), POR
Lisboa (LISBOA-01-0145-FEDER-007722 and Social Sciences DataLab, Project 22209) and POR
Norte (Social Sciences DataLab, Project 22209).
MASTER IN FINANCE
THIS REPORT WAS PREPARED EXCLUSIVELY FOR ACADEMIC PURPOSES BY SOFIA OLIVEIRA AND LEONOR SANTOS,MASTER IN
FINANCE STUDENTS OF NOVA SCHOOL OF BUSINESS AND ECONOMICS.THE REPORT WAS SUPERVISED BY A NOVA SBE FACULTY MEMBER, ACTING IN A MERE ACADEMIC CAPACITY, WHO REVIEWED THE VALUATION METHODOLOGY AND THE FINANCIAL MODEL.
(PLEASE REFER TO THE DISCLOSURES AND DISCLAIMERS AT END OF THE DOCUMENT)
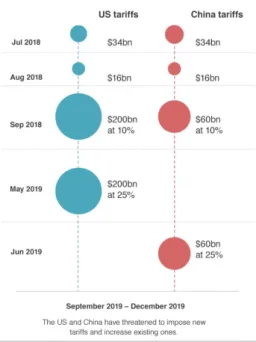
§ America still is the biggest market for Starbucks,
accounting 68% of consolidated total net revenues in fiscal 2018.
§ China, Asia, and Pacific (CAP) segment, the second
biggest market for Starbucks represents a huge opportunity. Spending on coffee in China is expected to increase by 11% annually over the next four years. Starbucks believes it will have a stronger presence in Asia than in the US itself.
§ Practical and technological coffee experience is crucial
for Starbucks success. Mobile orders represent 17% of total
transactions and will continue to increase. Starbucks’s desire to put
technology at the heart of the brand is paying off. Partnerships with Uber Eats in America and Alibaba in China allow for Starbucks delivery services, which will empower sales increase.
§ The exploration of the continuously rising millennial
population, as well the exploration of coffee premium drinking,
through Starbucks Reserve Stores will be key success factors. § Partnership with Nestle, to form the Global Coffee Aliance, will drive globalized awareness for Starbucks brand and will allow Starbucks to benefit from Nestlé’s international distribution network.
Company description
Starbucks is the number one specialty coffee retailer worldwide, with over 29,300 coffee shops spread across 80 countries. Trough Licensed and company-operated shops, the company offers coffee and teas, food items, roasted coffee beans, and coffee accessories.
S
TARBUCKS CORPORATION
C
OMPANY
R
EPORT
CONSUMER DISCRETIONARY SECTOR 03RDJANUARY 2020
S
TUDENTS:
S
OFIAO
LIVEIRA ANDL
EONORS
ANTOSGrowth is not over for Starbucks
It is empowered by digital and geographic expansion
Recommendation: BUY
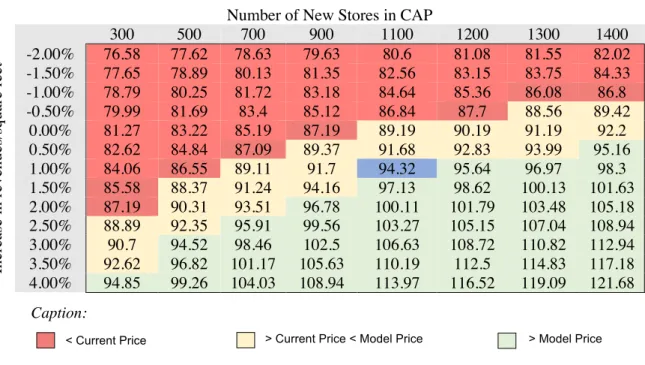
Price Target FY20: 94.32 $
Price (as of 31-Dec-19) 87.92 $
Reuters: SBUX.OQ, Bloomberg: SBUX US Equity
52-week range (USD) 61.40-99.72
Market Cap (USDm) 104,017,000
Outstanding Shares (m) 1184 Source: Bloomberg Source: Bloomberg (Values in USD millions) 2021F 2022F 2023F Revenues 28,676 30,313 32,048 EBITDA 6,021 6,371 6,742 EBIT 4,468 4,739 5,030 Net Profit 3,407 3,614 3,836 FCF 2,555 2,812 3,081
STARBUCKS CORPORATION COMPANY REPORT PAGE 2/34
Table of Contents
EXECUTIVE SUMMARY ... 3 COMPANY OVERVIEW ... 3 INDUSTRY OVERVIEW ... 3 VALUATION ... 3 COMPANY OVERVIEW ... 4 SHAREHOLDER STRUCTURE ... 5 INDUSTRY OVERVIEW ... 5 COMPETITORS ... 9 MARKET SEGMENTS ... 11 § Americas ... 11 § CAP ... 12 § EMEA ... 14 § Channel Development ... 16 RELATIVE VALUATION ... 16 INTRINSIC VALUATION ... 17 REVENUES ... 17 WORKING CAPITAL ... 21 CAPITAL EXPENDITURE ... 21GROSS MARGIN &COSTS PROJECTION ... 22
WACC ... 23
GROWTH RATE ... 24
TARGET PRICE ... 24
SENSITIVITY ANALYSIS ON DCFASSUMPTIONS ... 25
FINAL CONCLUSIONS ... 25
APPENDIX ... 26
INCOME STATEMENT ... 26
BALANCE SHEET ... 28
CASH-FLOW STATEMENT ... 29
DISCLOSURES AND DISCLAIMERS ... 30
STARBUCKS CORPORATION COMPANY REPORT
PAGE 3/34
Executive summary
The purpose of this Equity Research is to perform a valuation of Starbucks, in order to release an investment recommendation.
Company Overview
On the company overview section, it will be made an analysis of Starbucks company, specially its business focus and model, with the aim of providing key characteristics that will be used on the forecasting section. In short, Starbucks acts in five segments: CAP, Americas, EMEA and consumer-package goods (CPG), “offering several blends of coffee, handcrafted beverages, merchandise, and food items”1.
Industry Overview
In this section, it will be performed an extensive analysis on the coffee retailing industry, in order to build a strong base for the forecast. This industry is highly fragmentated, with a variety of players that go from large corporations to small shops around the corner. Premium products demand, health and sustainability
concerns, rising coffee consumption from the millennial population and higher digitalization are set to drive growth in the industry.
Valuation
In a first phase, it will be presented a relative valuation, which provides the first perspective of the firm value.
With the analysis on the external factors affecting Starbucks in mind, the main revenue drivers will be identified and projected for 2031.
Since Starbucks is exploring new markets, it was needed a forecasting period
from 2018 to 2031, in order to ensure a stabilized growth rate. From 2032
onwards, a terminal value with a perpetual growth rate of 2.63% has been incorporated into the model, which is in line with the forecasted inflation rate by
the International Monetary Fund (IMF). Furthermore, a WACC of 6.16% was
used to discount the Cash Flows, that yielded an Enterprise Value of USD
115.437 million.
1 Source: Global Data. 2019. “Starbucks Corp (SBUX) Financial and Strategic SWOT Analysis Review” Our valuation results suggest
that the market is undervaluing Starbucks
STARBUCKS CORPORATION COMPANY REPORT PAGE 4/34 17,454 3,320 8,530 20
# Stores per Segment
Americas EMEA CAP Corporate and Other
Company overview
Starbucks is the number one roaster, marketer and retailer of coffee worldwide.2
In FY18, the Company operated nearly 15,300 company-operated stores and
14,000 licensees and franchisees, totalizing about 29,300 stores across 80 countries. Furthermore, Starbucks generated revenues through
consumer-packaged goods and foodservice operations3.
Company description
Founded in 1971, Starbucks is a global coffee retail company specialized in coffee and other beverages.
Starbucks aims to be “one of the most recognized and respected brands in the world”4. This objective is to be accomplished through disciplined expansion of its
global store base, adding stores in both existing and developed markets such as
the United States (US), but most important, more recent, higher-growth markets such as China.
The company operates its business through five segments: Americas, China/Asia Pacific (CAP), Channel Development, Europe Middle East and Africa (EMEA) and Corporate and Other. At the end of FY18, the company operated 17,454 stores in Americas, 8,530 stores in CAP, 3,320 stores in EMEA and 20 Corporate and Other stores (Figure 1).
Moreover, Starbucks business includes two varieties of stores: company-operated stores and licensed stores. In FY2018, 52% of Starbucks revenues derived from company-operated stores, while the remaining 48% were generated from licensed stores (Figure 1).
The upscaling of the brand is supported by Starbucks' digital offerings (including My Starbucks Rewards and Mobile Order & Pay platforms), consumer packaged
goods efforts (K-Cups, Nespresso-compatible products, and other), geographic expansion opportunities (mainly China, India, and Japan), and a complementary
brand portfolio (the Starbucks Reserve sub-brand in particular, bringing a premium food and craft coffee experience to its clients).
The company will also have the opportunity to expand its presence on grocery and mass-channel shelves across the globe through a partnership with Nestle to
2 Source: Thomson Reuters
3 Source: Zacks Investment Research Inc. 2019. “Starbucks Corp (SBUX)” 4 Source: Company Report. 2018.
Figure 1: Number of stores in FY18,
per segment and type4 13,983 15,341
# Stores per type
STARBUCKS CORPORATION COMPANY REPORT
PAGE 5/34
market, sell, and distribute the Starbucks, Teavana, VIA, and other brands across more than 190 markets across the globe.
Finally, trough the partnership with Uber Eats, the company is expecting to provide for delivery services in 11 markets in 2019, which is expected to increase sales5.
Shareholder structure
Starbucks stock is publicly listed since 1992, under the name of SBUX, with its initial public offering (IPO) at USD 17 per share.
Starbucks’ shareholder base is comprised of institutional ownership, insider ownership, general public ownership and private company ownership. Institutional ownership represents 75.89% of total shares. Insider ownership consist of managers having the stock of the company and represents nearly 2.66%, which can be considered a significant holding given the fact that Starbucks is a large-cap stock.
Lastly, general public ownership represents 21.45% and private companies represent 0.00018%, an insignificant holding, motivated mainly by strategic interests and potential capital gains.
In what concerns to dividend policy, Starbucks is particularly determined on putting shareholder returns first, which is noticed by the evolution of its dividend payout since 2015. The company pays dividends on a quarterly basis. Since 2015, Starbucks' quarterly dividend payout rose by 125%, from USD 0.16 to USD 0.36. On an annualized basis, Starbucks' quarterly dividend translates to USD 1.44 per share7.
Industry Overview
Starbucks Corporation acts in the coffee retailing industry, on the consumer discretionary sector.
Coffee retailing industry is composed by specialist outlets, that focus on the sale
of coffee, along with other drinks and snacks. The coffee retailing industry
product portfolio is mainly characterized by two types of goods: beverages and complementary food items. Beverages include a variety of hot drinks (brewed coffees and teas), cold blended beverages, bottled water and soft drinks. Food
5Source: Business Insider. 2019. “Starbucks to launch uber eats delivery across US”, Accessed October 31st 2019
https://www.businessinsider.com/starbucks-to-launch-uber-eats-delivery-across-us-2020-2019-7
6 Source: NASDAQ
7 Source: Motley Fool. 2018. “4 Reasons to Love Starbucks Dividend” Accessed October 31st 2019,
https://www.fool.com/investing/2018/08/23/4-reasons-to-love-starbucks-dividend.aspx
OWNER NAME Value (In k$)
Vanguard Group Inc $7,402,992 Blackrock Inc $6,644,223 State Street Corp $4,315,130 Magellan Asset
Management Ltd $2,516,183 Bank of New York Mellon
Corp
$1,807,038 Northern Trust Corp $1,649,960 Geode Capital
Management, LLC
$1,481,327 Invesco LTD. $1,421,357 Bank of America Corp /DE/ $1,392,877 Loomies Sayles & Co LP $1,345,858
Table 1: Top 10 Institutional
STARBUCKS CORPORATION COMPANY REPORT
PAGE 6/34
products range from pastries to bakery items, desserts, sandwiches, and candy8.
This industry is highly competitive and fragmented, with a variety of players. Since tastes for coffee are different among the world, every market has its own local competitors, smaller chains and independent coffee bars, all trying to differentiate themselves. The major players on this industry, and Starbucks’ competitors, are: McCafé, Costa Coffee, Dunkin Brands, Luckin Coffee and
Caffe Coffee Day as well as some little shops of premium coffee that do not belong
to any large group of companies as the ones mentioned before.
Coffee-drinking has evolved considerably in the past few decades. According to the National Coffee Data Trends Report, by the National Coffee Organization, 64% of the American adults consume coffee on a daily basis. From all the trends seen in the industry, Ready-to-drink (RTD) coffee is posing new opportunities for the promotion of new products, particularly among younger costumers, which also brings more competition into the industry. “The Global RTD coffee market was valued at USD 19.05 Billion in 2017 and is projected to reach USD 36.60 billion by the end of 2025, exhibiting a CAGR of 8.5%”, according to Fortune Business Insights.
Launching of innovative beverages, rising demand for higher quality
products, and increasing disposable income of consumers (see Figure 2) are
believed to incentive growth in the industry. The exploration of the continuously
rising millennial population, the exploration of coffee premium drinking, the rising of environmental and health concerns and digital engagement will be
key success factors for coffee market participants. • Premium Coffee
The growing demand of premium beverages, commercialized to target customer segments that search for unique features and higher quality, is expected to foster growth. The “National Coffee Data Trends” report, conducted by the National Coffee Organization in the US can be a clear example of this trend. This study used a sample of 2,815 people who reported drinking a beverage other than water within the past day. This study claims that “for the first time in the report’s 69-year history, gourmet coffee reached a 60/40 advantage over traditional non-gourmet coffee among past-day drinkers.”10
USA and Europe show higher consumption per capita and higher household consumption of premium coffee. According to a survey taken by Allegra WCP in 2017, a rising number of Americans is demanding higher quality coffee. 55% of
8Source: Grin. 2018. “Coffee Shop Industry - A Strategic Analysis” Accessed October 31st 2019, https://www.grin.com/document/111348 9 Source: Market Line
10 Source: Daily Coffee News. 2019. “2019 Coffee and Beverage Trends: Inside the NCA’s Annual Report” Accessed October 31st 2019,
https://dailycoffeenews.com/2019/03/11/2019-coffee-and-beverage-trends-inside-the-ncas-annual-report/
Figure 2: Households with an Annual
Disposable Income over 10,000USD in million9
STARBUCKS CORPORATION COMPANY REPORT
PAGE 7/34
over 5,000 consumers surveyed responded they would be willing to pay a higher price to consume better quality coffee, giving a price ceiling of $3.18 per beverage on average11. This survey leads us to conclude that in the future, there is a
premium market for Starbucks to continue to explore. Actually, Starbucks has
already started to explore this market, through Starbucks’ Reserve Stores and also with new products on its existent stores. Launching of new beverages such as the "Flat White" espresso and "Shaken" iced teas, which can be considered to be premium, are a key factor to increase revenues, since these drinks are more expensive than regular ones and costumers are willing to pay for it. Moreover, Starbucks’ baked products also saw price increases over the years, since recipes have changed to guarantee higher quality and authenticity.
• Health and Environmental Concerns
As part of an evolving cultural pursuit of healthier food habits and
environmental concerns, consumer preferences are changing towards the
consumption of nutritious and high-quality hot beverages, which come from sustainable sources, over more artificial drinks. There is an increasing demand for products from natural origin associated with health benefits, in opposition to more processed foods. According to L.E.K.’s 2018 consumer food and beverage survey, ”nearly 1,600 consumers demand health claims to be more nuanced and carry specific attributes. Among this group, 73% to 86% say they would pay extra for food products with health and wellness attributes that resonate. This is about 15 to 20 percentage points more than in 2016”12.
• Rising Millennial Population
According to Financial Times and the World Data Lab, the global
spending power of millennials will soon surpass that of any other generation. Millennials, a 19-34-year-old demographic, are an
important driving force on the coffee market expansion and are set to drive the future of economy. As reported by the National Coffee Association, millennials are responsible for nearly 44% of the United States coffee consumption. In eight years, until 2016, daily coffee intake among millennials has risen from 34% to 48%.
11 Source: Coffee Talk. 2016. “Boom in US coffee shop market set to continue” Accessed October 31st 2019,
https://coffeetalk.com/ctpress/10-2016/37079/
12 Source: L.E.K Consulting. 2018. “Consumer Health Claims 3.0: The Next Generation of Mindful Food Consumption” Accessed October 31st 2019, https://www.lek.com/insights/ei/next-generation-mindful-food-consumption
13 Source: Financial Times
STARBUCKS CORPORATION COMPANY REPORT PAGE 8/34 13.3 14.2 14.9 15.1 15.3 16.3 16.8 17.2 0 2 4 6 8 10 12 14 16 18 20 Q4
FY17 FY18Q1 FY18Q2 FY18Q3 FY18Q4 FY19Q1 FY19Q2 FY19Q3
# of Active Members (M) of the Loyalty Program
• Digital Coffee Experience
Besides the quality and the investment on premium coffee, there is an increasing trend towards a more technological coffee experience. Since the launch of its mobile app in 2015, when other competitors did not have such features, Starbucks has been the leader on mobile ordering. The company is known for being a pioneer in using its digital platform to enhance costumer’s coffee experience while gaining revenue and customer loyalty. Trough Starbucks Rewards program, loyal customers can achieve certain benefits depending on their consumption levels.
Management expects rewards-member acquisition, mobile order-and-pay adoption and the new rewards program launched in fiscal 2Q to boost same-store sales by 1-2 percentage points a year. US results have been strong so far
in 2019.
Mobile order and pay adoption boosted same-store sales by 2 percentage
points, achieving 16% of total transactions in the US in 3Q 2019 (Figure 5).
Delivery is another important trend on the restaurants sector. Starbucks has
taken a great effort on this matter, recently shown by the its partnership with Uber
Eats in the US, to provide delivery services among the country. It also entered a partnership with Ele.me, the leading Chinese food delivery platform, to bring
delivery services to 30 cities across China. This focus on customer services through digital means, can be considered a significant competitive advantage, coming essentially from being the first coffee retailer offering these facilities. When comparing Starbucks to its most direct competitor, Costa Coffee, one can see that Starbucks is clearly at advantage as it allows customers to pay trough the app on their phones, while Costa Coffee only allows for collecting points that can be used when making a purchase at the store. Recently, Costa Coffee has also launched a new mobile app that allow for digital purchasing. However, Starbucks has its app since 2015, it had the chance to build a much higher client network than companies that are starting now to invest on reward and mobile-order programs.
Following the abovementioned trends, the players of coffee industry are betting on higher quality, allied with the right use of technology, to transform coffee in an experience.
14 Source: Company Information
Figure 4: Active Members of the
Loyalty Program (in millions) 14
Figure 5:
Mobile Order Transactions as % of Total Transactions 4 10% 11% 12% 13% 14% 15% 15% 16% Q4 FY17 Q1 FY18 Q2 FY18 Q3 FY18 Q4 FY18 Q1 FY19 Q2 FY19 Q3 FY19 Mobile Order Transactions as % of Total
Transactions (US Company-Operated Stores only)
STARBUCKS CORPORATION COMPANY REPORT
PAGE 9/34
Competitors
Competition in the coffee retailing industry has escalated in recent years, with multiple competitors joining the market, trying to take advantage of the unexplored trends of the industry.
1) The Coca-Cola Company is a beverage company, with presence in more than 200 countries. Recently, The Coca-Cola company acquired Costa Coffee, which was previously owned by Whitbread. Costa Coffee is the largest coffee retailer in the United Kingdom (UK) and the second largest worldwide, after Starbucks. It has over 3000 stores spread across 30 countries. In the UK alone, it operates more than 2000 restaurants. However, in the US it has no presence. Costa Coffee has a business focus more similar to Starbucks than other competitors we are going to mention because, like Starbucks, its effort is the promotion and sale of coffee, while all the other coffee retailers present a more diverse product mix. Like Starbucks, Costa Coffee is looking at international expansion to drive growth, being the second company with higher presence in
China, after Starbucks.
2) McDonalds – McCafe was founded in 1993 in Australia and implemented in 2001 in the United States. McCafe strongly arose as one of Starbucks’ competitors, gaining market share through the years. Backed by the extensive spread of McDonald’s stores worldwide, McCafe offers food and other drinks, in addition to coffee. When compared to Starbucks, it presents a lower price on coffee, which can be considered a competitive advantage for McCafe. However, these two companies compete against each other simply because both sell coffee. While Starbucks is making an effort to increase its market share mostly in the premium sector, McDonald’s is striving for Starbucks’ original customer segment, by offering specialty coffee.
3) Dunkin Donuts is a donut and coffee seller based in Massachusetts, in the U.S.
It runs its business through more than 11,500 outlets, present in more than 35 countries
.
Dunkin aims to operate in over 18,000 U.S. locations, according to its annual report. It is also investing on drive-thru facilities and in a digital platform which is currently being tested. Unlike Starbucks, the company is not only focused on coffee retailing, though it started to explore the coffee market years ago. The
15 Source Bloomberg Table 2:
The Coca-Cola Company main Financial Figures 15
Table 3: McDonalds’ main
Financial Figures 5
The Coca-Cola Company (in million USD)
Revenues 2018 31,856 Revenues 2019 (Current) 33,558 EBITDA 2018 9,786 EBITDA 2019 10,576 Net income 2018 6,434 Net income 2019 (Current) 7,748
Table 4:
Dunkin Brands’ main Financial Figures 5
McDonalds (in million USD)
Revenues 2018 21,025 Revenues 2019 (Current) 20,891 EBITDA 2018 10,219 EBITDA 2019 11,872 Net income 2018 5,857 Net income 2019 (Current) 6,088
Dunkin Brands (in million USD)
Revenues 2018 1,322 Revenues 2019 (Current) 1,354 EBITDA 2018 459 EBITDA 2019 515 Net income 2018 231 Net income 2019 (Current) 248
STARBUCKS CORPORATION COMPANY REPORT
PAGE 10/34
chain’s management has revealed its commitment to offer the lowest price in the market, allying quality to low prices. However, through a higher product customization and a clear focus on the client’s experience, Starbucks created an exclusive brand, which is what makes it distinct from Dunkin. While Dunkin’s space is much more alike to a fast-food chain outlet, Starbucks spaces invite people to spend time there, transforming coffee-drinking in a remarkable experience.
4) Café Coffee Day is a global company with headquarters in Bangalore, India, and the largest Arabica beans producer and Exporter in Asia. As at 2018, Café Coffee Day operated 1,700 cafes, spread across 245 cities in India. Additionally, Café Coffee Day has approximately 600 kiosks and 30,000 vending machines operating in India17. Besides its regular coffee shops, this company offers varied
coffee experiences, targeting different costumer segments. For example, its Café Coffee Day Lounges are made for families, while Café Coffee Day Square targets people who search for single-origin, premium coffees.
This company has now expanded to Czech Republic, Nepal, as well as some countries in Africa. It is considered a big competitor for Starbucks in the Asian market, especially in India, since it is a brand that is already well stablished and naturally fits better in the Asian culture than Starbucks.
5) Luckin coffee is a Chinese coffee retailer, founded in 2017. Luckin appeared with the goal of developing the coffee culture in China, through innovative mobile technologies and low prices.
Nowadays, Luckin is opening stores at a rate of 200 to 300 in a month, with the goal of overcoming Starbucks’ presence in China, which now has about 3,700 coffee shops on that market. Besides growing through the number of stores, Luckin has developed a mobile App with coffee delivery where the first order is for free, as a way of attracting new clients in a faster way, which is considered a competitive advantage. However, Starbucks recently partnered with Alibaba as a way of preventing the fierce competition. This strategy of rapid growth has caused Luckin to have negative earnings, that the company believes it will recover in the future. 6) Restaurant Brands is one of the leading fast-food restaurant companies worldwide, and the owner of Burger King, Tim Hortons, and Popeyes. Currently, it has presence in over 100 countries, counting with approximately 26,000 outlets.
16 Source: Bloomberg
17 Source: QZ. 2015. “This Indian Coffee Chain is beating Starbucks at its own game”, Accessed November 2019
https://qz.com/india/416670/this-indian-coffee-chain-is-beating-starbucks-at-its-own-game/
18 Source: Company Report
Table 5:
Café Coffee Day’s main Financial Figures16
Coffee Day Enterprises (in million USD)
Revenues 2018 519 Revenues 2019 (Current) 600 EBITDA 2018 108 EBITDA 2019 81 Net income 2018 10 Net income 2019 (Current) 18
Table 6:
Luckin main Financial Figures 6
Luckin Coffee (in million USD)
Revenues 2018 120 Revenues 2019 (Current) 299 EBITDA 2018 -213 EBITDA 2019 -298 Net income 2018 -456 Net income 2019 (Current) -531
STARBUCKS CORPORATION COMPANY REPORT
PAGE 11/34
8671 9019 9413 9684
6132 6588 7146 7770
FY15A FY16A FY17A FY18A
Evolution of the number of stores in Americas
# Company-operated stores # Licensed stores
Restaurant Brands became a direct competitor for Starbucks since 2014, when it acquired the Tim Hortons brand. Tim Hortons was founded in 1964 and it is the one-stop shop for coffee, breakfast, lunch and doughnuts in Canada, and one of the main coffee retailers in the US, where it operates more than 4,500 stores.
Market Segments
§
Americas
The Americas segment is the most important market for Starbucks, being the most relevant both in terms of sales and number of stores.
In FY18, the Americas segment reported revenues of US$16,732.2 million (67.7% of the company's total revenue), which grew 7.1% YoY, and reported a CAGR of 8.7% during 2014-1810.
In the US, Starbucks is the “leading specialty coffee retailer”21 with over 14,400
company-owned and licensed locations.
Revenue in the US coffee segment amounts to US$80,916m in 2019 and the market is expected to grow annually by 4.5% (CAGR 2019-2023)9. The United
States continues to be one of the major coffee importers in the world, which implies a high coffee consumption. The average per capita coffee consumption is set at 3.7 kg in 2019. Moreover, in FY18, Coffee consumption in the US amounted to nearly 26.5 million 60-kilogram bags, which represented a 3% growth when comparing with the previous fiscal year, according to Statista (Figure 7).
Millennials (aged 18-39) are driving the coffee industry in the U.S. to historic
records. According the National Coffee Association (NCA), 44% of US coffee consumers are millennials.
The American consumer enthusiasm for coffee varieties is also driving the coffee consumption increase. The demand for gourmet coffee, which includes espresso-based and ready-to-drink beverages is growing significantly.
Furthermore, the drink has benefited from promotion as a healthy beverage. A study of 2017 published in ‘Annals of Internal Medicine’ journal, showed the benefits of drinking coffee regularly to the improvement of life expectancy.
19 Source: Bloomberg 20 Source: Statista
21 Source: Zacks Investment Research Inc. 2019. “Starbucks Corp (SBUX)” 22 Source: Company Report
Table 7: Restaurant Brands main
financial figures19
Restaurant Brands (in million $)
Revenues 2018 5,357 Revenues 2019 (Current) 5,509 EBITDA 2018 2,182 EBITDA 2019 2,403.5 Net income 2018 743.5 Net income 2019 (Current) 848.4
Figure 7:
Domestic consumption of coffee in the United States from 2013/14 to 2018/19 (in million 60-kilogram bags) 20
Figure 8:
Evolution of the number of stores in America 22 23.81 23.58 25.11 25.02 25.84 26.5 2013/2014 2014/2015 2015/2016 2016/2017 2017/2018 2018/2019
Domestic consumption of coffee in the United States from 2013/14 to 2018/19 (in million 60-kilogram bags)
STARBUCKS CORPORATION COMPANY REPORT
PAGE 12/34
According to the National Coffee Association (NCA), after the results of the study were disclosed, daily coffee drinkers increased from 57% to 62% in that year. However, since Americas is a mature market, Starbucks has been innovating, namely in what concerns to delivery offer and technological use.
This can be noticed by the revenue mix that composes the Americas segment, mainly in the United States. Cafés accounted for only 51% of Starbucks' US revenues in 2018. 37% of revenues came from Drive thru orders and 12% from mobile orders23. US demand for mobile ordering and pick-up is high and the
company aims to expand delivery services in the US in early 2020. A clear example of this is Starbucks’ partnership with Uber Eats to bring its beverages to US customers' doorsteps, as it had already done in China.
Besides the emphasis in digital engagement (particularly building the rewards program, delivery and adding mobile-ordering and payment), Starbucks is focused on improving the customer experience, by adding more ‘Reserve and Roastery’ stores to its portfolio and on beverage innovation (‘Nitro Cold Brew’, ‘Cloud Macchiato’, ‘Refreshers’ and other cold beverages) to continue its growth.
In fact, the three mentioned factors are driving same-store sales growth acceleration in this segment and will continue to do that over the next years
§
CAP
Nowadays, CAP segment, mainly China, is crucial for the success of Starbucks long-term strategy. In FY18, the CAP segment reported revenues of USD 4,473.6 million (18.1% of the company's total revenue), which grew 38.1% YoY, and reported a CAGR of 41.1% during 2014-1824.Although tea drinkers dominate in
China, Chinese consumers are increasingly turning to coffee. Currently, the average person consumes only three cups of coffee per year versus 363 cups for the average U.S. consumer25. Therefore, coffee retail has a lot of future growth
potential in China as spending on coffee is expected to increase by 11% annually over the next four years26.
Consequently, Starbucks is taking advantage of this market opportunity, aiming to open 3,000 new stores in China, and thus doubling the current number over
23 Source: Business Insider. 2019. “Starbucks to launch uber eats delivery across US”, Accessed October 31st 2019
https://www.businessinsider.com/starbucks-to-launch-uber-eats-delivery-across-us-2020-2019-7
24 Source: Company Report
25 Source: Fool. 2019. “Reasons Starbucks stock is a Buy ahead of Earnings”, Accessed October 31st 2019
https://www.fool.com/investing/2019/10/22/3-reasons-starbucks-stock-is-a-buy-ahead-of-earnin.aspx
26 Source: Statista
Figure 9:
Evolution of the number of Stores in CAP 24
2452 2811 3070 5159
3010 3632
4409
3371
FY15A FY16A FY17A FY18A Evolution of the number of stores in CAP
STARBUCKS CORPORATION COMPANY REPORT
PAGE 13/34
the next five years. This aligns with the company’s goal of operating 10,000 stores
in China within 10 years27.
However, Chinese economy is slowing down, continuing to suffer the consequences from the trade war with the United States, which can undermine Starbucks strategy to boost coffee demand in this market.
Starbucks is also seeing increasing competition for those selling coffee and tea in the country. Competitors include chains such as KFC and Luckin Coffee, both of which are also rapidly expanding locations in a bid to attract coffee lovers with lower-priced products. Luckin, for example, is seeking to overtake Starbucks by opening more stores in two years than the industry giant has in 20 years.
Yet, Starbucks is keen to capture first-mover advantage in China. This translates into plans for mid-teens annual new-unit growth in the next several years, with over 60% of these stores to be built in China's top 13 cities. New locations will make up about 80% of the Asia-Pacific region's revenue growth, with same-store sales accounting for the other 20%.
Beyond the geographic expansion of Starbucks stores, Starbucks also aims to improve results in China market by expanding its loyalty program, delivery and
adding mobile-ordering and payment. China has the largest online food delivery
market in the world, mainly due to China's economy strong economic growth in the last decades, that changed lifestyles and increased digitalization. Moreover, its large young population also contributes to the huge dimension of this market. Regarding the mobile-ordering and payment, Starbucks has been has been betting on delivery service, after partnering with Ele.me, the food-delivery platform owned by Alibaba (BABA). Mobile order and pay options are now available in 300 stores in Beijing and Shanghai.30 In consequence, last year, ‘Rewards’
members in China grew 45% to 10MM and digital ordering has expanded from near zero to 10%, with 7% from delivery and 3% from mobile order and pick up
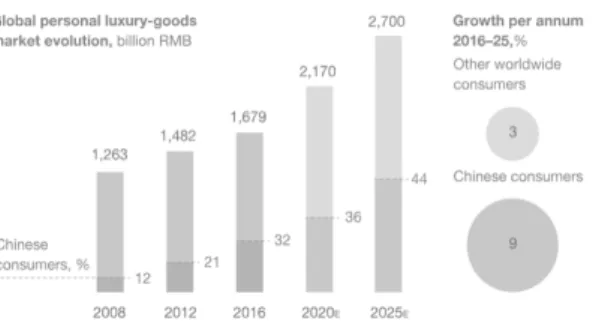
Finally, luxury and premium goods consumption in China is
forecasted to grow strongly due to increasing affluence levels
(Figure 12), which encompass premium coffee drinks. Given this, by opening a high-end coffee store in Shangai, “Reserve Roastery”, Starbucks is looking to profit from increasing consumer spending.31
27 Source: Fool. 2019. “Reasons Starbucks stock is a Buy ahead of Earnings”, Accessed October 31st 2019
https://www.fool.com/investing/2019/10/22/3-reasons-starbucks-stock-is-a-buy-ahead-of-earnin.aspx
28 Source: Company Report and JP Morgan Estimates 29 Source: BMI/National Statistics
32 Source: McKinsey and Company Figure 10:
Total Coffee Market Size in China (USD)28
Figure 11: Coffee Sales Growth in
China (in millions CNY)29
Figure 12: Spend of Chinese people in luxury goods32
4.79 5.42 6.42 8.61 10.4 12.66 16.47 21.18 25.83
2015 2016 2017 2018 2019E 2020E 2021E 2022E 2023E Total Coffee Market Size in China (USD)
STARBUCKS CORPORATION COMPANY REPORT
PAGE 14/34
§ EMEA
Europe Middle East and Africa (EMEA) is a segment where Starbucks intents to increase its presence, expecting 300 new stores per year, virtually all licensed, for the next years.
In FY18, the EMEA segment reported revenues of USD 1,048 million (4.2% of the company's total revenue), which grew 9.3% YoY, and reported negative growth of 5.1% during 2014-1815.
According to the company’s report, “EMEA total net revenues for fiscal 2018 increased USD 89 million (9%) over fiscal 2017, primarily due to higher revenue from licensed stores (USD 64 million) and company-operated stores (USD 25 million). Company-operated stores increased USD 25 million (4%), mainly due to favorable currency translation (USD 31 million). Licensed store revenues increased USD 64 million (16%) due to higher product sales and royalty revenues from licensees (USD 56 million), resulting from the opening of 356 net new licensed stores, and favorable foreign currency translation (USD 4 million)”.
Starbucks has been changing its model in EMEA from company operated stores
to a licensed model instead, which is noticeable in the Middle European markets,
especially in Germany, France and Switzerland. This shift from company operated stores comes from the need of adapting more easily to each countries’ culture. When compared to America, EMEA segment has a much wider variety of preferences in what concerns to types of coffee and food habits.
This different consumer preferences had hindered Starbucks success in the past and led Starbucks to rely on its licensees’ knowledge to satisfy each country’s specific demand.
Moreover, the licensing model also allows for a greater geographical expansion than company operated stores. Relying on these licensing partnerships leads Starbucks’ to focus on its main strategic goals, which currently are more related with the CAP and Americas segments. On top of that, the licensing model has a higher operating margin than the company operating one. Since all the costs of maintenance are borne by the licensee, Starbucks collects its licensing fee, without incurring on so many costs as under the company operating model. Besides that fact, the company can significantly reduce its maintenance and expansion capital on this segment, freeing capital for investing in more promising markets.
Furthermore, Starbucks is planning on moving its licensing support center to London and close the existing one in Amsterdam. With this decision, Starbucks
31 Source: Fitch Solution Store – Market Research Analysis & Industry Reports 32 Source: McKinsey and Company
33 Source: Company Report Figure 13: Evolution of the number
of stores in EMEA33
737 523 502 490
1625 2119 2472 2830
FY15A FY16A FY17A FY18A
Evolution of the number of stores in EMEA
STARBUCKS CORPORATION COMPANY REPORT
PAGE 15/34
believes it will be able to better monitor its licensing model in Europe, ensuring long-term growth.
This strategy, together with the high coffee consumption in EMEA is helping Starbucks to improve its results in Europe. European market represented 33% of
the global coffee consumption in 2018, totalizing 3,222 thousand tonnes of
coffee, having the highest consumption of coffee per capita in the world, according to the Coffee Market Report, by the International Coffee Organization34.
However, there are some risks in the European market, mainly due to Brexit. A study performed by Allegra Consultancy in 2018, showed that uncertainty regarding UK’s future relationship with the European Union affected the coffee sector in 2018. “Nearly half (49%) of industry leaders surveyed by Allegra stated that Brexit was harming their business, while 46% of the participants remained neutral and the remaining 5% stated they faced a positive impact. 69% agreed that UK's exit negatively impacted consumption levels, while 87% of industry leaders surveyed believed Brexit negatively affected UK economy”36.
Besides impacting coffee consumption levels, Brexit can lead to slower processes and increasing administrative expenses, as well as logistics barriers between countries, which harms the transactions between global companies. Consequently, this can affect Starbucks licensing model in Europe, which is now centered in London.
On the positive side, though the European coffee market can be considered to be stagnated, the increasing population and the development of new beverages will be key factors to the growth of this market. The rising demand for specialty coffee, with attributes such as signature blends and specially crafted will be a key driver for the EMEA market.
As of 2018, United Kingdom has the highest number of new coffee shops in Europe37. Following the present consumer trends, mainly the quest of digital
features and the demand for exclusive and healthy products, industry players are all trying to differentiate themselves.
34 Source: CBI, Market Information. 2019. “Coffe Trade Statistics”, Accessed November 21st 2019,
https://www.cbi.eu/market-information/coffee/trade-statistics/
35 Source: International Coffee Organization
36 Source: The Caterer. 2019. “Growth of Coffee Shops could be slowed by hard Brexit”, Accessed 21st November 2019,
https://www.thecaterer.com/news/foodservice/growth-of-coffee-shops-could-be-slowed-by-hard-brexit
37 Source: Mordor Intelligence. 2019. “Europe Coffee Market – Growth, Trends, and Forecast (2020-2025)”, Accessed November 21st 2019, https://www.mordorintelligence.com/industry-reports/europe-coffee-market
Figure 14: Per Capita Coffee
Consumption by country 35 12 9.9 8.7 8.4 8.2 7.8 Finla nd Norwa y Denm ark Neth erlan ds Swed en Switze rland
Per Capita Coffee Consumption in European Countries, Volume in Kg
STARBUCKS CORPORATION COMPANY REPORT
PAGE 16/34
§ Channel Development
Besides EMEA, CAP and America, Starbucks has a fifth segment – Channel Development Segment, which has been a key driver of profit growth for the company.
In FY18, the Channel Development segment presented revenues of USD 2,297.3 million, which accounted for 9.3% of the company's total revenue, growing 1.8% year on year, and reporting a CAGR (2014-2018) of 10.4%38.
This segment includes product sales that are external to the company's traditional coffee shops, namely roasted whole bean and ground coffees, Seattle's Best Coffee, Starbucks and Teavana-branded single-serve products and ready-to-drink beverages38.
In 2018, Starbucks announced an alliance with Nestlé S.A. Within this alliance, the main goal for Starbucks is to increase and accelerate its presence in international markets where the company has no CPG (Consumer Packaged Goods) presence. Under this alliance, Nestlé will sell Starbucks packaged coffee globally, by selling Nespresso and Nescafé Dolce Gusto capsules with Starbucks signature.
As a consequence of this alliance, a large portion of the Channel Development segment, and all the consumer package goods business were included in the licensing model of Starbucks, in the fiscal year of 2018.
Relative Valuation
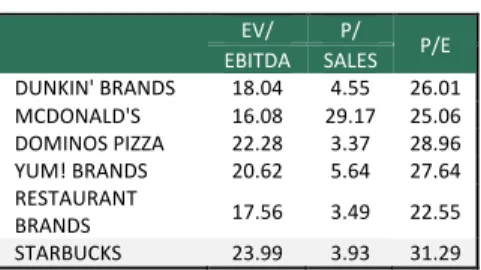
To value Starbucks using the relative valuation method, five comparable firms were selected: Restaurant Brands, McDonalds, Dunkin Brands, Yum! Brands and Dominos Pizza. These companies, like Starbucks, belong to the restaurants industry, have a strong presence in the US as well as in the rest of the world and have the higher market capitalization among the industry.
Afterwards, EBITDA was considered the most suitable metric to compute Starbucks’ enterprise value, whereas P/Earnings and P/Sales were used to compute the firm’s fair value of equity. The previously mentioned figures were
38 Source: Company Report. 2018 39 Source: Bloomberg
Table 8: Multiples of Comparable
Companies 39
Table 9: Comparables Information
EBITDA EV/ SALES P/ P/E
DUNKIN' BRANDS 18.04 4.55 26.01 MCDONALD'S 16.08 29.17 25.06 DOMINOS PIZZA 22.28 3.37 28.96 YUM! BRANDS 20.62 5.64 27.64 RESTAURANT BRANDS 17.56 3.49 22.55 STARBUCKS 23.99 3.93 31.29
Profit Margin ~ # Countries ~ # Stores Market Cap
DUNKIN' BRANDS GROUP INC 17.5% 35 18,800,000 6,339,000,000 MCDONALD'S CORP 27.4% 115 37,000,000 147,800,000,000 DOMINOS PIZZA 10.8% 85 11,600,000 11,940,000,000 YUM! Brands 20.9% 125 45,000,000 30,000,000,000 RESTAURANT BRANDS 11.6% 100 26,000,000 30,267,000,000 STARBUCKS 14.3% 80 29,300,000 104,683,100,000
STARBUCKS CORPORATION COMPANY REPORT
PAGE 17/34
regarded as the best proxies to the firm’s free cash flows, thereby used as vehicles to perform an accurate relative valuation of the firm. Moreover, it was used the median of the comparables’ multiples, as a way of excluding outliers.
Even though the comparable companies were chosen to be the most similar to Starbucks possible, it is not easy to find fair comparables for Starbucks, due to its business being exclusively focused on the retail of coffee and due to its atypical capital structure, with an extremely low debt-to-equity ratio (0.11). This capital structure led us to take into account price ratios, since they do not consider the debt of companies.
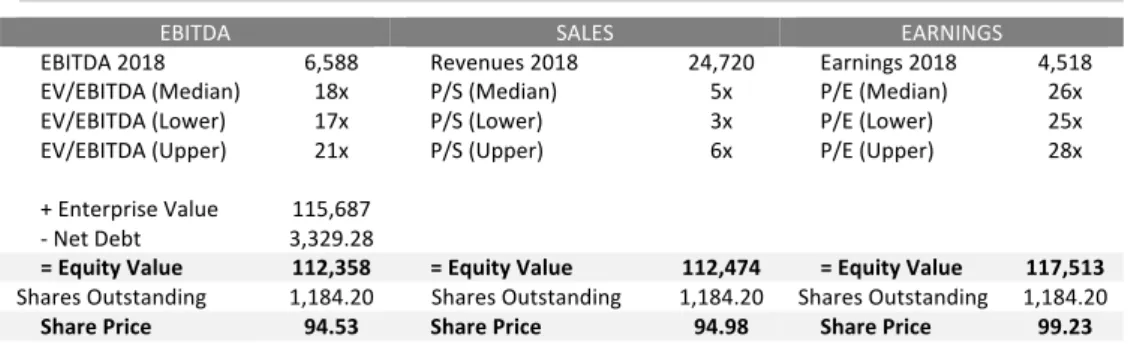
The multiples valuation results can be seen in the following table:
These multiple results led us to conclude that the market is undervaluing Starbucks. However, they should be used to calibrate and complement the intrinsic valuation results and should not be taken in consideration alone.
Intrinsic Valuation
Revenues
Under an intrinsic valuation model, such as DCF and APV models, revenues projection is crucial and a main driver for the valuation results.
Since Starbucks structures itself within four segments, and each segment has its own growth targets, revenues forecast was performed taking this structure into account, resulting on a sales forecast for every segment.
Starbucks has realigned its priorities to focus its business on the Asia/Pacific and America segments. To sustain that growth, Starbucks reorganized its support team and freed up resources by closing its Teavana retail stores and partnering with Nestle to create the "global coffee alliance". Hence, these two segments will have the biggest impact in future total net sales.
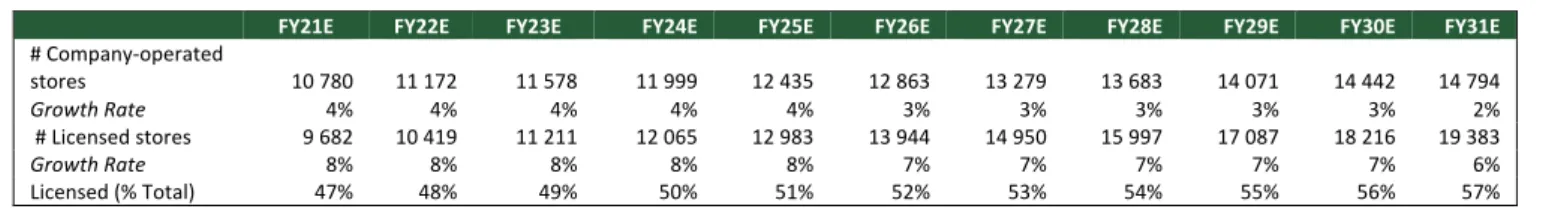
• Americas Segment
For the American market, where the USA is undoubtedly the main driver, it was estimated a growth in the number of stores by 4% in the first five years of the
Table 10: Multiples Valuation Results
EBITDA SALES EARNINGS
EBITDA 2018 6,588 Revenues 2018 24,720 Earnings 2018 4,518
EV/EBITDA (Median) 18x P/S (Median) 5x P/E (Median) 26x
EV/EBITDA (Lower) 17x P/S (Lower) 3x P/E (Lower) 25x
EV/EBITDA (Upper) 21x P/S (Upper) 6x P/E (Upper) 28x
+ Enterprise Value 115,687
- Net Debt 3,329.28
= Equity Value 112,358 = Equity Value 112,474 = Equity Value 117,513
Shares Outstanding 1,184.20 Shares Outstanding 1,184.20 Shares Outstanding 1,184.20
STARBUCKS CORPORATION COMPANY REPORT
PAGE 18/34
forecasting period. Historically, Starbucks has been growing at an average of
about 4% in this market. The growing specialist coffee market in the US (with an expected CAGR of 4.5% for the next five years), the rising of the millennial population, said to be a main driver for the coffee market, and the increasing coffee consumption due to health benefits, support this growth rate.
Furthermore, we expect this growth rate to be decreasing until it achieves 2%,
the inflation rate for the US. We believe Starbucks will continue to grow in this
market, but not as dependent on the number of stores as before. Though the number of stores will continue to increase to cover more locations and support the strategic realignment mentioned above, it is expected that the partnership with Uber Eats in the US will drive more revenues per store without the need for a 4% rate of growth in the number of stores over all of the forecasting years, as occurred in the past. We believe that the trend is to reduce the growth of the stores number and
start selling more per store. Moreover, the partnership with Uber Eats will contribute to increase the revenues per square feet of US stores. Though this
metric has been relatively stable over the years, at USD 0.0007mln/square feet on average, we expect this value to increase over the forecasting period, to converge to USD 0.0008mln revenue per square feet, implying a 1% increase each year. Over this increase, it was applied the expected inflation rate for the US over the forecasting period.
Moreover, the potential increase in Reserve Stores and the “premiumisation” of Starbucks brand will also contribute to the increase in revenues per square feet, due to possible price increases. Reserve stores are a key long-term growth driver, which is just on an infancy stage, that helps the company to play on the premium coffee sector, that was discussed on the industry overview section, said
to be a main driver for coffee retailing industry success.
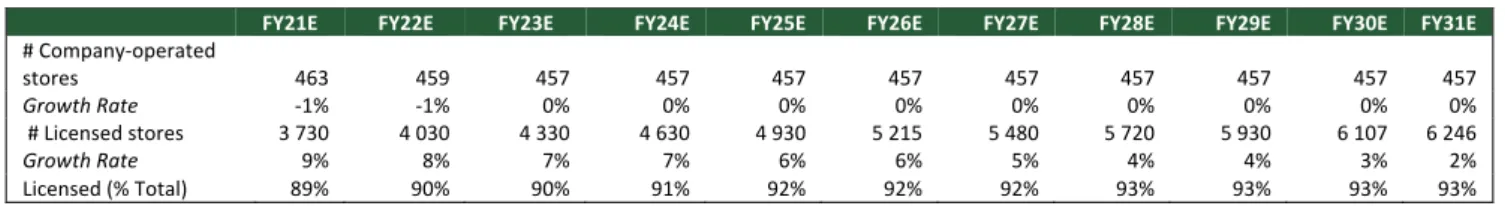
• EMEA Segment
In EMEA market, the trend is an increase in licensed stores over company
operated stores. As mentioned before, this shift in the portfolio towards more
licensed stores will impact the company’s value mainly due to increasing operating margin, quicker expansion and a higher engagement to the local culture, which Starbucks consider key when opening stores in different markets. A clear example
Table 11: Forecasted Number of Stores in Americas
FY21E FY22E FY23E FY24E FY25E FY26E FY27E FY28E FY29E FY30E FY31E
# Company-operated stores 10 780 11 172 11 578 11 999 12 435 12 863 13 279 13 683 14 071 14 442 14 794 Growth Rate 4% 4% 4% 4% 4% 3% 3% 3% 3% 3% 2% # Licensed stores 9 682 10 419 11 211 12 065 12 983 13 944 14 950 15 997 17 087 18 216 19 383 Growth Rate 8% 8% 8% 8% 8% 7% 7% 7% 7% 7% 6% Licensed (% Total) 47% 48% 49% 50% 51% 52% 53% 54% 55% 56% 57%
STARBUCKS CORPORATION COMPANY REPORT
PAGE 19/34
of this strategic measure is the fact that Starbucks fully licensed Starbucks operations in France, the Netherlands, Belgium and Luxemburg to its longstanding strategic partner Alsea, the largest independent chain restaurant operator in Latin America, which will operate and develop Starbucks stores in EMEA markets, building on Starbucks growth agenda. It is expected that Starbucks will continue to license more stores in EMEA as a way of focusing on its key markets – Americas and CAP. Hence, EMEA stores growth will be mainly through licensing partnerships, with an increase of 300 licensing stores per year, according to company’s guidance, disclosed on company’s results presentation. In what concerns to company operated stores, this type of store was set to decrease
over the forecasting period, according to the company’s current trend and stabilize at year 2023, with about 460 stores.
Concerning revenues per square feet, it was assumed that they will continue to be equal to the historical average, increasing only by the expected inflation. Though it would be possible to increase this metric through price increases and more reserve stores, the risks mentioned on the industry overview section lead us to believe that it would be the same on average, only increasing at the expected inflation rate for the UK (given by IMF), as a proxy for the whole market, since it is the European country where Starbucks has higher presence.
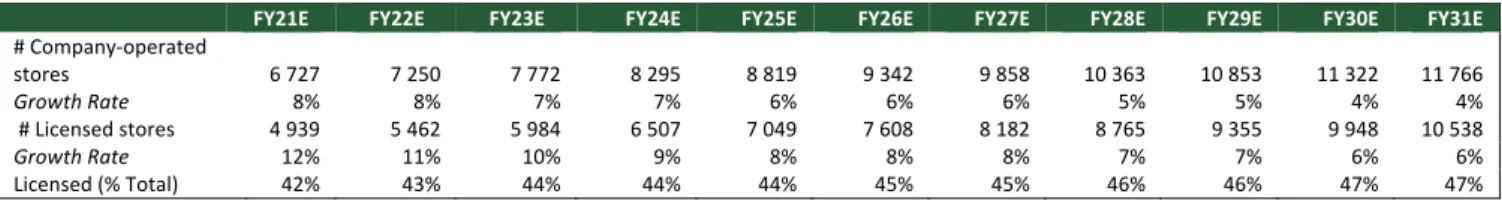
• CAP Segment
For the CAP market, where China and Japan are the biggest markets, it was forecasted an ambitious increase on the number of stores, due to the relevant potential growth that China represents and Starbucks strategic focus. For 2021, the target is to have 11.700 stores in the CAP segment, which implies opening 1100 stores per year, including company operated and licensed. It was assumed that Starbucks will continue to open about 1100 per year until 2024, which implies a
7% growth rate in company operated stores and 9% in licensed stores, which
goes in accordance with the expected growth rate for this market (8% in 2024 according with a report from Global Industry Analysts Inc).
The ratio of licensed stores over the total number of stores has been relatively stable over the years, at an average of 52%, so this ratio was maintained over the forecasting period, to divide the 1100 stores per year in company operated and licensed.
Table 12: Forecasted Number of Stores in EMEA
FY21E FY22E FY23E FY24E FY25E FY26E FY27E FY28E FY29E FY30E FY31E
# Company-operated stores 463 459 457 457 457 457 457 457 457 457 457 Growth Rate -1% -1% 0% 0% 0% 0% 0% 0% 0% 0% 0% # Licensed stores 3 730 4 030 4 330 4 630 4 930 5 215 5 480 5 720 5 930 6 107 6 246 Growth Rate 9% 8% 7% 7% 6% 6% 5% 4% 4% 3% 2% Licensed (% Total) 89% 90% 90% 91% 92% 92% 92% 93% 93% 93% 93%
STARBUCKS CORPORATION COMPANY REPORT
PAGE 20/34
The growth on the number of stores in this segment is sustained by the increasing demand of coffee in Asia, due to changes in consumption habits, increasing population and increased purchase power among Asian countries (Japan and China essentially), together with breakthrough mobile technology and delivery services.
Revenues per square feet were set to increase 1% per year until they reach
$0.00053mln per square feet. This increase is sustained by the partnership
between Starbucks and Alibaba, to provide for delivery services, assuming that
Starbucks will earn clients through this mean that would not be consuming Starbucks products otherwise. Over this increase, it was applied the expected
inflation rate for China in the forecasting period, as a proxy for the whole segment.
Finally, in what concerns to the channel development sector, it was forecasted to be a function of nestle sales, due to the recent Global Alliance Strategy of Starbucks with Nestle.
Having the number of licensed and company stores and the revenue per square feet forecasted, it is needed to estimate the square feet per store. For licensed stores, the license royalty has also to be estimated.
License sales-based fee was estimated according to the historical values for each segment, since each segment has its own licensed fee and this value has remained stable over the past 5 years. For Americas segment, it was maintained as 15.33%, for the CAP segment it was maintained at 10.05% and for the EMEA segment it was maintained at 13.36%.
Square feet per store was maintained on average, according to historical values. According to analyst estimations, the average Starbucks store size varies depending on urban versus suburban location, but it ranges from 1,900 - 2,100 square feet, so the average value was considered (2000 square feet per store).
Table 13: Forecasted Number of Stores in CAP
FY21E FY22E FY23E FY24E FY25E FY26E FY27E FY28E FY29E FY30E FY31E
# Company-operated stores 6 727 7 250 7 772 8 295 8 819 9 342 9 858 10 363 10 853 11 322 11 766 Growth Rate 8% 8% 7% 7% 6% 6% 6% 5% 5% 4% 4% # Licensed stores 4 939 5 462 5 984 6 507 7 049 7 608 8 182 8 765 9 355 9 948 10 538 Growth Rate 12% 11% 10% 9% 8% 8% 8% 7% 7% 6% 6% Licensed (% Total) 42% 43% 44% 44% 44% 45% 45% 46% 46% 47% 47%
STARBUCKS CORPORATION COMPANY REPORT PAGE 21/34 Accounts payable, 2,427.49 Accrued liabilities, 4,049.56 Insurance reserves, 373.24 Stored value card liability, 2,635.48 Accounts receivable, net, 1,636.01 Inventories, 2,940.96
Prepaid expenses and other current assets,
793.39
Working Capital Items in FY31E (in million USD)
Accounts payable, 1,179.30 Accrued liabilities, 2,298.40 Insurance reserves, 213.70 Stored value card liability, 1,642.90 Accounts receivable, net, 693.10 Inventories, 1,400.50 Prepaid expenses and
other current assets, 1,462.80
Working Capital Items in FY18 (in million USD)
Working Capital
Starbucks’ current assets comprise trade accounts receivable, inventory, and
prepaid expenses and other current assets. Starbucks’ core current liabilities
include those liabilities that are related to the ongoing operations of the firm, such as accounts payable, accrued liabilities, insurance reserves and store value
card liability. The latter, together with accounts receivable, accounts payable and
inventories has a huge impact on Starbucks working capital needs. Stored value card liability accounts for nearly 6% of the company’s liabilities and comes from the value that costumers hold in the Starbucks’ mobile app, as well as the value that costumers carry on their gift cards. Every time a costumer tops up a gift card or its account in the mobile app, the company recognizes the top up value as a liability on the balance sheet.
This liability was predicted as a percentage of revenues, considering the historical average of the stored value card liability over revenues.
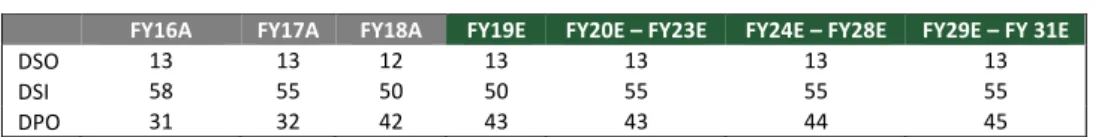
Accounts Payable, accounts receivable and inventories were estimated with the following days outstanding:
Days Sale Outstanding (DSO) and Days of Sale Inventory (DSI) were assumed to be constant over the forecasting period, since historically they were stable
and way better when compared to the industry values.
Looking at the Days Payable Outstanding (DPO), one can notice an upward trend. However, it still is below the industry level (49 days). This led us to predict that DPO will tend to increase slightly each year, till 45 days, following the Starbucks effort to increase this metric.
Capital Expenditure
The property, plant and equipment (PP&E) of Starbucks depends on the number of company-operated stores opened every year (which imply all the required equipment and the furniture).
That being said, it was calculated the PP&E per company-operated store, that showed an increase from USD 0.32 million in FY14 to USD 0.41 million FY18. This ratio takes into account the tendency to increase the number of licensed stores over company operated stores, and the consequent impact on the investment in
Figure 15: Main working capital
captions in FY18 (in Million USD)
Table 14: DSO, DSI and DPO actual and forecasted
FY16A FY17A FY18A FY19E FY20E – FY23E FY24E – FY28E FY29E – FY 31E
DSO 13 13 12 13 13 13 13
DSI 58 55 50 50 55 55 55
DPO 31 32 42 43 43 44 45
Figure 16: Main working capital
captions in FY31 Estimated (in Million USD)
Figure 17: DSI, DPO and DSO
metrics 49 27 62 45 13 55
DPO DSO DSI
Starbucks vs Costumer Discretionary Sector in DSI, DPO and DSO
STARBUCKS CORPORATION COMPANY REPORT
PAGE 22/34
PP&E. The ratio increase already reflects the premium strategy implementation, as it is part of Starbucks’ culture to invest many resources on the its spaces as a way of differentiating itself against competitors. Moreover, the opening of ‘Reserve and Roastery’ stores also requires high investment. Thus, it was assumed the ratio will remain at USD 0.41 in the forecasting years.
Regarding the forecast of intangible assets, it was assumed a percentage of
revenues equal to the one observed in the last year (FY2018). Actually, this
percentage has been increasing over the historical years, assuming a value of 4.2% of revenues in FY2018 (comparing with 1.7% in FY14). The increase observed was mainly due to high investments made by the company to improve the technological coffee experience (e.g. the Mobile Order & Pay system). Since Starbucks will continue to invest on its digital features in the coming years, it is
assumed the ratio will remain as high as in 2018.
Finally, since we do not have any expectation of future acquisitions by Starbucks in the next years and the goodwill impairment is unexpected and unusual (not something we would project in future periods), it was assumed the goodwill will
remain flat over the projection period and the same as in FY18 (USD 3,542 million).
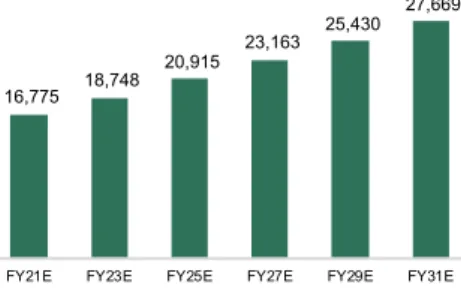
Gross Margin & Costs Projection
Starbuck’s operating costs include cost of sales, occupancy costs (such as rent and insurance), store operating expenses, depreciation and amortization expenses and general and administrative expenses, according to company report.
Firstly, cost of sales was projected as a percentage of revenues. The cost of sales/revenues ratio has been increasing over the last three years, reaching a level of 41% in FY18. According to the company’s reports, these costs have been increasing mainly in the US, due to a product mix more focused on premium food and to company’s commitment in innovation. Starbucks is expected to continue implementing this strategy, so it was assumed a ratio for the forecasting period
of 42%, implying a higher investment on premium products and food quality.
In its turn, store operating expenses were estimated as a percentage of PP&E,
representing 29.10% of PP&E in FY18. Process and capacity growing efficiency,
trough the continuous improvement of processes and workflows is a key success factor for Starbucks. One example of these initiatives is the adjustment of personnel to sudden changes in demand, allowing for a greater cost efficiency. Thus, assuming Starbucks will continue to improve its operational efficiency, it was assumed a decrease of about 2 basis points per year, in order to reach a 28% percentage of stores operating expenses/PP&E.
Figure 18: Costs Projection from
2021 to 2031 (in million USD)
11,900 13,300 14,837 16,432 18,040 19,629 1,554 1,712 1,877 2,040 2,194 2,336 1,863 2,082 2,322 2,572 2,824 3,072 8,188 9,138 10,180 11,258 12,343 13,410
FY21E FY23E FY25E FY27E FY29E FY31E
Costs Projection
Store operating expenses General and administrative expenses Depreciation and amortization expenses Other operating expenses
STARBUCKS CORPORATION COMPANY REPORT
PAGE 23/34
16,775 18,748
20,915 23,163
25,430 27,669
FY21E FY23E FY25E FY27E FY29E FY31E Gross Margin Evolution (Million USD)
Depreciation and Amortization expenses were forecasted as a percentage of PP&E (21.05% 5-year historic average), since these costs are a function of the
number of company-operated stores.
Finally, over the last five years, the SG&A represented 6-7% of revenues. Consequently, it was assumed that this ratio will remain at 6.50% in the forecasting period.
WACC
In order to estimate Starbucks Corporation’s weighted average cost of capital, it was needed to compute the cost of equity and cost of debt, as well as estimate the capital structure the company will maintain in the future.
Concerning the cost of debt, it was taken in consideration the yield of maturity of the company’s latest issued senior unsecured bond with 30 years to maturity (3.49%), Starbucks debt recovery rate and annualized probability of default. The recovery rate and annualized probability of default were based on Moody’s annual default study and the credit rating for Starbucks (Baa1). Considering the yield of
3.49%, an annualized probability of default of 0.15% and a recovery rate of 31.3%, the cost of debt for Starbucks is 3.39%, which implies a debt beta of 0.27.
Moreover, to compute the cost of Equity, the Capital Asset Pricing Model was used. This model shows that the expected return on a security depends on the beta of the security, the risk-free return and a risk premium.
For the risk-free rate, it was used the yield of a 10-year US Government Bond, which at the current date trades at 1.74%.
To determine the beta of the stock, we performed a regression on Starbuck’s three-year weekly stock returns and S&P 500 Index three-three-year weekly returns. These calculations yielded to a beta of 0.77, inserted in a 95% confidence interval of 0.6 to 1.
The resulting beta was then compared with Starbuck’s comparables beta, by computing and unlevering the betas from the following companies: Dunkin Brands, Dominos Pizza, Restaurant Brands, Yum! Brands and McDonalds, using the respective capital structures. The median of these results has been applied to Starbucks’ market debt-to-equity ratio of 11%, which yields a levered beta of 0.50. To be more conservative, this beta was not used, since, as said before, there is no business similar enough to Starbucks.
The last input needed to compute Starbuck’s cost of equity was the market risk premium. A weighted average was performed, using US risk premium as a proxy for Americas segment, China risk premium as a proxy for Asia/Pacific segment and
40 Source: New York University
Figure 19: Projected Gross Margin
Evolution (in million USD)
Rating Baa1
Yield 3.49%
Probability default 0.15%
Recovery rate 31.3%
Rd 3.39%
Table 15: Starbucks’ cost of debt
estimation
Table 16: Country risk premium
estimation40
Country Premium Risk Revenues per Segment Weight
China 7% 4,473.60 20% UK 7% 1,048.00 5% US 6% 16,732.20 75% Total 6.2% 22,253.80