Article
Situation and development of worldwide agri-environment:
Agricultural land uses, fertilizers consumption and carbon dioxide
equivalent emissions
WenJun Zhang1, GuangHua Liu2 1
School of Life Sciences, Sun Yat-sen University, Guangzhou 510275, China; International Academy of Ecology and Environmental Sciences, Hong Kong
2
Guangdong AIB Polytech College, Guangzhou 510507, China
E-mail: zhwj@mail.sysu.edu.cn, wjzhang@iaees.org, ghliu@gdaib.edu.cn
Received 27 November 2016; Accepted 24 December 2016; Published online 1 March 2017
Abstract
Based on FAO data on environment worldwide, we choose ten major countries to analyse
agri-environment situation and development worldwide. The results showed that China has the greatest agricultural area, seconded by Australia and USA, and third by Brazil and India. USA is the largest country in arable land area, seconded by India, and third by China. Since earlier 1990s, China has become the largest country in the
area of permanent crops, seconded by India. Brazil is the largest country in the annual growth of arable land area, seconded by China, and third by Australia. In the area of permanent meadows and pastures, China grows
mostly and seconded by Brazil and third by India. India has the largest harvested area, closely seconded by China, and third by USA. Australia is the most fast growing country in area harvested, seconded by Brazil and third by India. China and India are the two countries with most emissions of agricultural CO2 and equivalents, seconded by Brazil, and third by USA. China grows mostly in emissions of agricultural CO2 and equivalents, seconded by Brazil and India, and followed by Canada and USA. China is the largest country of fertilizers
consumption, seconded by India, and third by USA and Brazil. China grows mostly in P and K fertilizers consumption. India holds the No. 1 position in the annual growth of N consumption.
In general, China and India have the largest amount of emissions of agricultural CO2 and equivalents and fertilizers consumption. Annual growths of arable land area and permanent meadows and pastures of China are also the highest. Agri-environment of China, India, and Brazil has deteriorated significantly. Agri-environment
of Australia seems to be deteriorated in the past years. Agri-environment of European countries is relatively optimistic.
Keywords agri-environment; agricultural land uses; cereals production; carbon dioxide emissions; fertilizers consumption; world; countries.
Environmental Skeptics and Critics ISSN 22244263
URL: http://www.iaees.org/publications/journals/environsc/onlineversion.asp RSS: http://www.iaees.org/publications/journals/environsc/rss.xml
Email: environsc@iaees.org EditorinChief: WenJun Zhang
1 Introduction
Agri-environment topics cover land uses, green house gases emissions, fertilizers and pesticides uses, etc.
Expansion of agricultural land expansion is one of the most significant human alterations to the global environment (Zhang, 2016). In the past several hundred years, agricultural land area worldwide increased at the annual rate of 1.66% (Grigg, 1993; Matson et al., 1997). Excessive land use and agricultural intensification
has been deteriorating global climate and environmental quality (Matson et al., 1997; Tilman et al., 2001; Tahir et al., 2013).
Emissions of various agricultural gases, such as CO2, methane, etc., are one of the major sources for greenhouse gases in the air, and thus contribute significantly to global warming and environmental changes (Wu and Zhang, 2012; Zhang and Liu, 2012; Zhang and Zhang, 2012; Sundar et al., 2014; Lamani et al., 2016;
Shabani et al., 2016).
Since the mid-twentieth century, crops production has being increased and the uses of chemical fertilizers
have being increased rapidly (Nambiar, 1994). However, fertilizers consumption has led to negative environmental consequences (Tilman et al., 2001). Excessive addition of phosphates caused eutrophication of surface waters, increases in the greenhouse gas, loss of biodiversity and changes in species compositions in
ecosystems, acidification of soils and freshwaters, etc (Vitousek et al., 1997a, b; Tilman et al., 2001; Good et al., 2004; Matson et al., 1997, 2002; Zhang, 2006).
In present study, we tried to analyse the situation and development of agri-environment worldwide, based on FAO data on agri-environment. Ten major countries, in the world, Australia, Brazil, Canada, China, France, Germany, India, Japan, UK, and USA were chosen for present study.
2 Material and Methods
Agri-environment data of ten major countries in the world, Australia, Brazil, Canada, China, France, Germany, India, Japan, UK, and USA were collected from FAOSTAT (http://www.fao.org/faostat/en/#home). Agricultural area (1961-2014), including arable land (1000ha), permanent crops (1000ha), and permanent
meadows and pastures (1000ha), cereals production (1961-2014), including area harvested (ha), production (tonnes), and yield (hg/ha), agricultural CO2 and equivalents emissions (gigagrams; 1990-2014), fertilizers consumption (2002-2014), including nitrogen fertilizers (N total nutrients), phosphate fertilizers (P2O5 total nutrients), and potash fertilizers (K2O total nutrients), were analyzed (Figs 1-4). Cereal yield of China was recorded from 1990 and 2014; Permanent meadows and pastures of Japan were recorded from 1961 and 2000.
Time series of above 10 indices were generally a linear function of year. So we use linear regression (Zhang et al., 2006; Zhang, et al., 2007; Zhang and Zhang, 2007; Zhang, 2008) to fit the trends for each of the
indices (Tables 1-4): x = a + b t, where t is year, x is the index value at t, and b is the annual growth rate of the index. Linear regressions were statistically tested with F-statistic, based on r2 for the regression.
3 Results
3.1 Agricultural area
Fig. 1 indicates that USA is the largest country in arable land area, seconded by India, third by China. For the area of permanent crops, the years 1985 to 1990 were a transition phase. Before 1985, Canada was the No. 1 country in the area of permanent crops, seconded by Brazil. Since around 1993, China has become the largest
country in the area of permanent crops, seconded by India. Concerning the area of permanent meadows and pastures, Australia was the largest country before around 2013. After that China and Australia are both the
In terms of arable land, Canada lists the top country of area declining (Table 2), seconded by USA, and followed by UK, Japan, India, and Germany. Brazil is the largest country in the annual growth of arable land area, seconded by China, third by Australia, followed by France. Canada holds the top position in the annual growth of permanent crops area, seconded by China, and third by India. France declines mostly in the area of permanent crops (Table 2). Australia declines mostly in the area of permanent meadows and pastures, seconded by USA, and followed by France and India. China grows mostly and seconded by Brazil and third by India (Table 2).
Fig. 1 Time series of agricultural area of ten major countries.
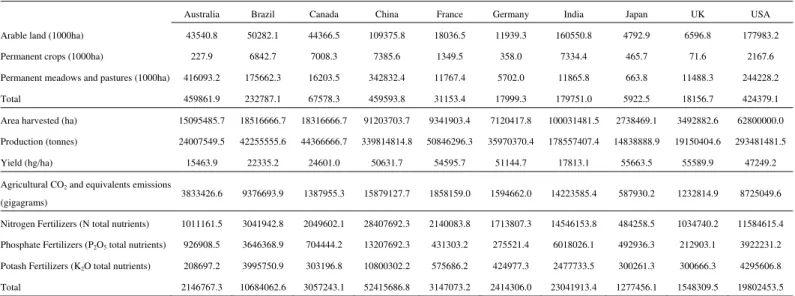
Table 1 Means of 10 indices for past years.
Australia Brazil Canada China France Germany India Japan UK USA
Arable land (1000ha) 43540.8 50282.1 44366.5 109375.8 18036.5 11939.3 160550.8 4792.9 6596.8 177983.2
Permanent crops (1000ha) 227.9 6842.7 7008.3 7385.6 1349.5 358.0 7334.4 465.7 71.6 2167.6
Permanent meadows and pastures (1000ha) 416093.2 175662.3 16203.5 342832.4 11767.4 5702.0 11865.8 663.8 11488.3 244228.2
Total 459861.9 232787.1 67578.3 459593.8 31153.4 17999.3 179751.0 5922.5 18156.7 424379.1
Area harvested (ha) 15095485.7 18516666.7 18316666.7 91203703.7 9341903.4 7120417.8 100031481.5 2738469.1 3492882.6 62800000.0
Production (tonnes) 24007549.5 42255555.6 44366666.7 339814814.8 50846296.3 35970370.4 178557407.4 14838888.9 19150404.6 293481481.5
Yield (hg/ha) 15463.9 22335.2 24601.0 50631.7 54595.7 51144.7 17813.1 55663.5 55589.9 47249.2
Agricultural CO2 and equivalents emissions
(gigagrams) 3833426.6 9376693.9 1387955.3 15879127.7 1858159.0 1594662.0 14223585.4 587930.2 1232814.9 8725049.6
Nitrogen Fertilizers (N total nutrients) 1011161.5 3041942.8 2049602.1 28407692.3 2140083.8 1713807.3 14546153.8 484258.5 1034740.2 11584615.4
Phosphate Fertilizers (P2O5total nutrients) 926908.5 3646368.9 704444.2 13207692.3 431303.2 275521.4 6018026.1 492936.3 212903.1 3922231.2
Potash Fertilizers (K2O total nutrients) 208697.2 3995750.9 303196.8 10800302.2 575686.2 424977.3 2477733.5 300261.3 300666.3 4295606.8
Total 2146767.3 10684062.6 3057243.1 52415686.8 3147073.2 2414306.0 23041913.4 1277456.1 1548309.5 19802453.5
Agricultural area (1961-2014); Cereals production (1961-2014); Agricultural CO2 and equivalents emissions (1990-2014); Fertilizers consumprion (2002-2014). Cereals yield of
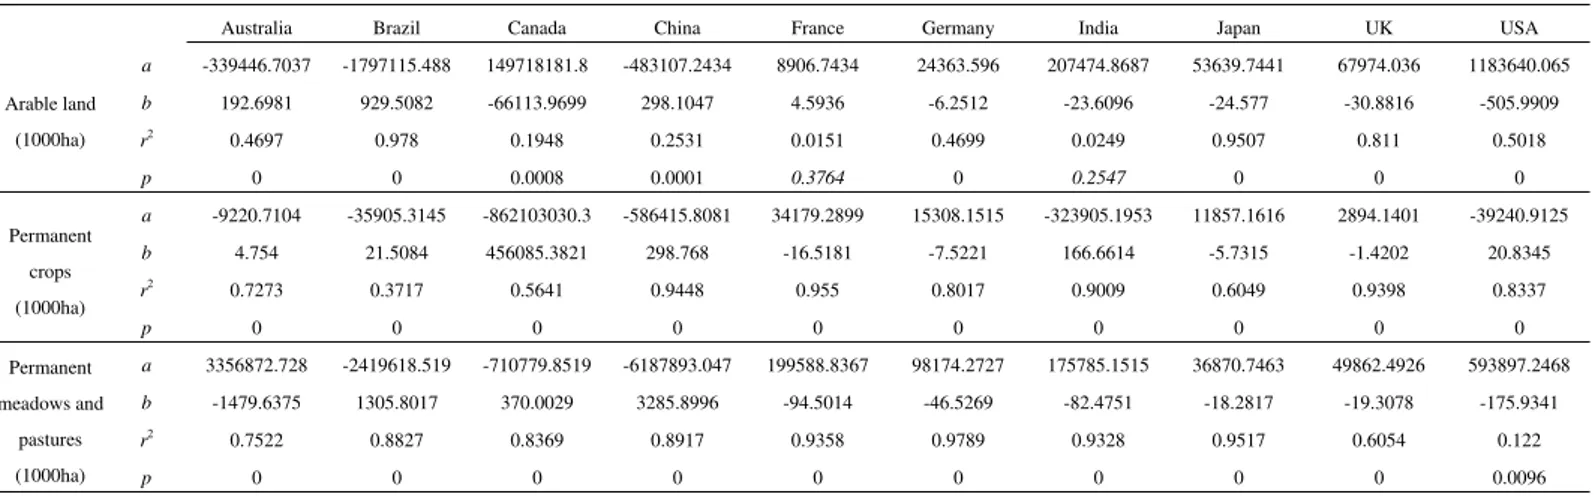
Table 2 Parameters and statistic significance of linear regressions of agricultural area (1961-2014).
Australia Brazil Canada China France Germany India Japan UK USA
Arable land
(1000ha)
a -339446.7037 -1797115.488 149718181.8 -483107.2434 8906.7434 24363.596 207474.8687 53639.7441 67974.036 1183640.065
b 192.6981 929.5082 -66113.9699 298.1047 4.5936 -6.2512 -23.6096 -24.577 -30.8816 -505.9909
r2 0.4697 0.978 0.1948 0.2531 0.0151 0.4699 0.0249 0.9507 0.811 0.5018
p 0 0 0.0008 0.0001 0.3764 0 0.2547 0 0 0
Permanent
crops
(1000ha)
a -9220.7104 -35905.3145 -862103030.3 -586415.8081 34179.2899 15308.1515 -323905.1953 11857.1616 2894.1401 -39240.9125
b 4.754 21.5084 456085.3821 298.768 -16.5181 -7.5221 166.6614 -5.7315 -1.4202 20.8345
r2
0.7273 0.3717 0.5641 0.9448 0.955 0.8017 0.9009 0.6049 0.9398 0.8337
p 0 0 0 0 0 0 0 0 0 0
Permanent
meadows and
pastures
(1000ha)
a 3356872.728 -2419618.519 -710779.8519 -6187893.047 199588.8367 98174.2727 175785.1515 36870.7463 49862.4926 593897.2468
b -1479.6375 1305.8017 370.0029 3285.8996 -94.5014 -46.5269 -82.4751 -18.2817 -19.3078 -175.9341
r2 0.7522 0.8827 0.8369 0.8917 0.9358 0.9789 0.9328 0.9517 0.6054 0.122
p 0 0 0 0 0 0 0 0 0 0.0096
Italic p values mean no statistic significance at p=0.05. Permanent meadows and pastures of Japan is recorded from 1961 and 2000.
3.2 Cereals production
Fig. 2 and Table 1 show that India has the largest harvested area, closely seconded by China, and third by USA. Cereals production of almost all countries grows continually in the past years. In recent years, China holds the No.1 position in cereals production, seconded by USA and third by India. France, USA and Germany have the highest yield.
Australia is the most fast growing country in area harvested (Table 3), seconded by Brazil and third by India. USA declines mostly in the area harvested, seconded by China and Canada, and third by Japan. China holds the No. 1 position in the annual growth of cereals production, seconded by USA and India, and third by Brazil. France, Germany, USA and UK are the most fast growing countries in cereals yield, seconded by China.
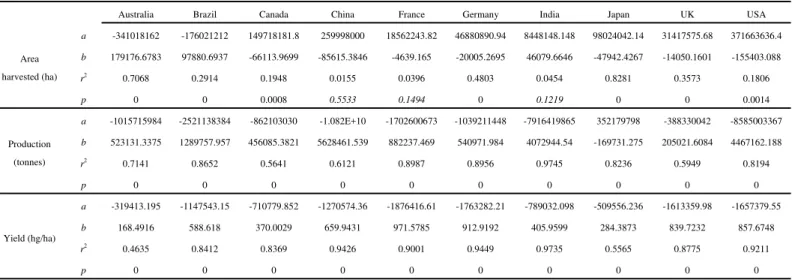
Table 3 Parameters and statistic significance of linear regressions of cereals production (1961-2014).
Australia Brazil Canada China France Germany India Japan UK USA
Area
harvested (ha)
a -341018162 -176021212 149718181.8 259998000 18562243.82 46880890.94 8448148.148 98024042.14 31417575.68 371663636.4
b 179176.6783 97880.6937 -66113.9699 -85615.3846 -4639.165 -20005.2695 46079.6646 -47942.4267 -14050.1601 -155403.088
r2
0.7068 0.2914 0.1948 0.0155 0.0396 0.4803 0.0454 0.8281 0.3573 0.1806
p 0 0 0.0008 0.5533 0.1494 0 0.1219 0 0 0.0014
Production
(tonnes)
a -1015715984 -2521138384 -862103030 -1.082E+10 -1702600673 -1039211448 -7916419865 352179798 -388330042 -8585003367
b 523131.3375 1289757.957 456085.3821 5628461.539 882237.469 540971.984 4072944.54 -169731.275 205021.6084 4467162.188
r2
0.7141 0.8652 0.5641 0.6121 0.8987 0.8956 0.9745 0.8236 0.5949 0.8194
p 0 0 0 0 0 0 0 0 0 0
Yield (hg/ha)
a -319413.195 -1147543.15 -710779.852 -1270574.36 -1876416.61 -1763282.21 -789032.098 -509556.236 -1613359.98 -1657379.55
b 168.4916 588.618 370.0029 659.9431 971.5785 912.9192 405.9599 284.3873 839.7232 857.6748
r2
0.4635 0.8412 0.8369 0.9426 0.9001 0.9449 0.9735 0.5565 0.8775 0.9211
p 0 0 0 0 0 0 0 0 0 0
Italic p value means no statistic significance at p=0.05. Cereal yield of China is recorded from 1990 and 2014.
3.3 Agricultural CO2 and equivalents emissions
As indicated in Table 1 and Fig. 3, China and India are the two countries with most emissions of agricultural CO2 and equivalents, seconded by Brazil, and third by USA. China grows mostly in emissions of agricultural CO2 and equivalents, seconded by Brazil and India, and followed by Canada and USA (Table 4). In general, emissions of Australia, Germany, UK, and France declined in the past years.
Fig. 3 Time series of agricultural CO2 and equivalents emissions of ten major countries.
Table 4 Parameters and statistic significance of linear regressions of agricultural CO2 and equivalents emissions (gigagrams)
(1990-2014).
Australia Brazil Canada China France Germany India Japan UK USA
a 1791255.053 -12892632.88 -794786.7599 -13893663.71 913784.3514 1356534.459 -10531298.03 535879.3122 1321503.788 -451594.4895
b -818.1409 6627.2231 424.7278 7257.1573 -419.3097 -645.7283 5544.5761 -255.9251 -635.4601 399.8983
r2
0.0555 0.9376 0.7627 0.9269 0.8138 0.7729 0.9382 0.9182 0.9113 0.2665
p 0.2568 0 0 0 0 0 0 0 0 0.0083
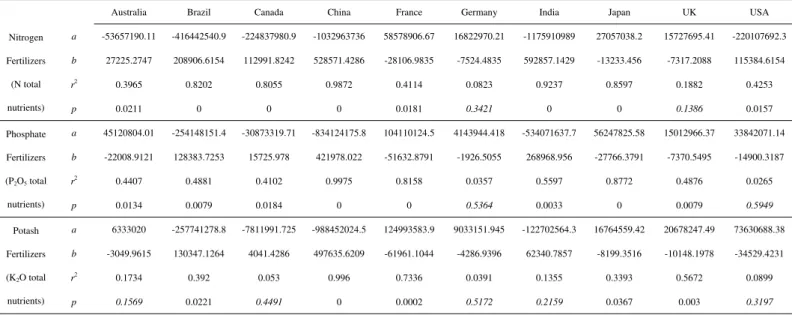
3.4 Fertilizers consumption
According to Table 1 and Fig. 4, China is the largest country of fertilizers consumption, seconded by India, and third by USA and Brazil.
China grows mostly in P and K fertilizers consumption. India holds the NO. 1 in the annual growth of N consumption, seconded by China, and third by Brazil. N, P and K fertilizers consumptions of France, Japan, Germany, and UK decline in the past years. P and K consumptions of USA and Australia decline also.
Fig. 4 Time series of fertilizers consumption of ten major countries.
Table 5 Parameters and statistic significance of linear regressions of fertilizers consumption in nutrients (tonnes of nutrients)
(2002-2014).
Australia Brazil Canada China France Germany India Japan UK USA
Nitrogen
Fertilizers
(N total
nutrients)
a -53657190.11 -416442540.9 -224837980.9 -1032963736 58578906.67 16822970.21 -1175910989 27057038.2 15727695.41 -220107692.3
b 27225.2747 208906.6154 112991.8242 528571.4286 -28106.9835 -7524.4835 592857.1429 -13233.456 -7317.2088 115384.6154
r2
0.3965 0.8202 0.8055 0.9872 0.4114 0.0823 0.9237 0.8597 0.1882 0.4253
p 0.0211 0 0 0 0.0181 0.3421 0 0 0.1386 0.0157
Phosphate
Fertilizers
(P2O5 total
nutrients)
a 45120804.01 -254148151.4 -30873319.71 -834124175.8 104110124.5 4143944.418 -534071637.7 56247825.58 15012966.37 33842071.14
b -22008.9121 128383.7253 15725.978 421978.022 -51632.8791 -1926.5055 268968.956 -27766.3791 -7370.5495 -14900.3187
r2
0.4407 0.4881 0.4102 0.9975 0.8158 0.0357 0.5597 0.8772 0.4876 0.0265
p 0.0134 0.0079 0.0184 0 0 0.5364 0.0033 0 0.0079 0.5949
Potash
Fertilizers
(K2O total
nutrients)
a 6333020 -257741278.8 -7811991.725 -988452024.5 124993583.9 9033151.945 -122702564.3 16764559.42 20678247.49 73630688.38
b -3049.9615 130347.1264 4041.4286 497635.6209 -61961.1044 -4286.9396 62340.7857 -8199.3516 -10148.1978 -34529.4231
r2
0.1734 0.392 0.053 0.996 0.7336 0.0391 0.1355 0.3393 0.5672 0.0899
p 0.1569 0.0221 0.4491 0 0.0002 0.5172 0.2159 0.0367 0.003 0.3197
4 Conclusions and Discussion
China has the greatest agricultural area, seconded by Australia and USA, and third by Brazil and India. Of which USA is the largest country in arable land area, seconded by India, and third by China. Since earlier 1990s, China has become the largest country in the area of permanent crops, seconded by India. Brazil is the largest country in the annual growth of arable land area, seconded by China, third by Australia, followed by France. In the area of permanent meadows and pastures, China grows mostly and seconded by Brazil and third by India. India has the largest harvested area, closely seconded by China, and third by USA. Cereals production of almost all countries grows continually in the past years. In recent years China holds the No.1 position in cereals production, seconded by USA and third by India. France, USA and Germany have the highest yield. Australia is the most fast growing country in area harvested, seconded by Brazil and third by India. China holds the No. 1 position in the annual growth of cereals production, seconded by USA and India, and third by Brazil. France, Germany, USA and UK are the most fast growing countries in cereals yield, seconded by China.
China and India are the two countries with most emissions of agricultural CO2 and equivalents, seconded by Brazil, and third by USA. China grows mostly in emissions of agricultural CO2 and equivalents, seconded by Brazil and India, and followed by Canada and USA.
China is the largest country of fertilizers consumption, seconded by India, and third by USA and Brazil. China grows mostly in P and K fertilizers consumption. India holds the NO. 1 in the annual growth of N consumption.
In general, China and India have the largest amount of emissions of agricultural CO2 and equivalents and fertilizers consumption. Annual growths of arable land area, permanent meadows and pastures, and cereals production of China are also the highest. Agri-environment of Brazil degrades significantly. Agri-environment of Australia seems to be deteriorated in the past years.Agri-environment of European countries are relatively optimistic.
References
Girgg OB. 1993. The World Food Problem, Blackwell, Oxford, UK
Good AG, Shrawat AK, Muench DG. 2004. Can less yield more? Is reducing nutrient input into the environment compatible with maintaining crop production? Trends in Plant Science, 9(2): 597-605
Lamani N, Shivaprasad D, Swamy KR, et al. 2016. Effect of elevated carbon dioxide concentration on photosynthetic and transpiration rate in Sandal (Santalum album L.). Proceedings of the International Academy of Ecology and Environmental Sciences, 6(2): 44-52
Matson P, Lohse KA, Hall SJ. 2002. The globalization of nitrogen deposition: Consequences for terrestrial ecosystems. Ambio, 31(2): 113-119
Matson PA, Parton WJ, Power AG, Swift MJ. 1997. Agricultural intensification and ecosystem properties. Science, 277: 504-509
Nambiar KKM. 1994. Soil Fertility and Crop Productivity Under Long-Term Fertilizer Use in India. Indian Council of Agricultural Research, New Delhi, India
Shabani M, Sayadi MH, Rezaei MR. 2016. CO2 bio-sequestration by Chlorella vulgaris and Spirulina
platensis in response to different levels of salinity and CO2. Proceedings of the International Academy of Ecology and Environmental Sciences, 6(2): 53-61
Tahir M, Imam E, Hussain T. 2013. Evaluation of land use/land cover changes in Mekelle City, Ethiopia using Remote Sensing and GIS. Computational Ecology and Software, 3(1): 9-16
Tilman D, Fargione J, Wolff B, et al. 2001. Forecasting agriculturally driven global environmental change. Science, 292: 281-284
Vitousek PM, Aber JD, Howarth RW, Likens GE, et al. 1997a. Human alteration of the global nitrogen cycle:
causes and consequences. Ecological Applications, 7: 737-750
Vitousek PM, Mooney HA, Lubchenco J, Melillo JM. 1997b. Human domination of Earth’s ecosystems.
Science, 277(5325): 494-500
Wu SH, Zhang WJ. 2012. Current status, crisis and conservation of coral reef ecosystems in China. Proceedings of the International Academy of Ecology and Environmental Sciences, 2(1): 1-11
Zhang J, Zhang WJ. 2012. Controversies, development and trends of biofuel industry in the world. Environmental Skeptics and Critics, 1(3): 48-55
Zhang WJ. 2008. A forecast analysis on world population and urbanization process. Environment, Development and Sustainability, 10: 717-730
Zhang WJ, Bai CJ, Liu GD. 2007.A longer-term forecast on global supply and demand of food products. Journal of Food, Agriculture and Environment, 5(1): 105-110
Zhang WJ, Liu CH. 2012. Some thoughts on global climate change: will it get warmer and warmer? Environmental Skeptics and Critics, 1(1): 1-7
Zhang WJ, Qi YH, Zhang ZG. 2006. A long-term forecast analysis on worldwide land uses. Environmental Monitoring and Assessment, 119: 609-620