UNIVERSIDADE DE LISBOA
FACULDADE DE MEDICINA DENTÁRIA
Legal-Medical age estimation in a population with special
needs appointment: Application of the Atlas of AlQahtani
Lucianna Maria Russell
Dissertação
Mestrado Integrado em Medicina Dentária
2018
UNIVERSIDADE DE LISBOA
FACULDADE DE MEDICINA DENTÁRIA
Legal-Medical age estimation in a population with special
needs appointment: Application of the Atlas of AlQahtani
Lucianna Maria Russell
Dissertação orientada por:
Professora Doutora Cristiana Palmela Pereira Professor Doutor Rui Filipe Vargas de Sousa Santos
Mestrado Integrado em Medicina Dentária
2018
i ACKNOWLEGMENTS
This dissertation wouldn´t be possible without the help of some people, to whom I would like to show my sincere appreciation and gratitude for their help.
To my Professor Cristiana Palmela Pereira, for the guidance, patience and availability in helping me achieve this final project. I was fortunate to work in a subject that I like and with a person whom I admire immensely, for her scientific knowledge has no limits.
To Professor Rui Filipe Vargas de Sousa Santos, for the statistics, it wouldn’t be possible without his help.
To Dr Isabel Bagão for the patience in helping me with the access to the hundreds of files I needed for this project.
To Maria for the company and help, for all the work we did together, for the laughs we had when we were tired and needing a break. Our difference in work methods allowed us to think outside of the box and adapt to different methodologies. This thesis allowed us to create a new friendship and grow as researchers.
To my family, I would like to express my deepest feeling of gratitude, as well as to give a heartfelt homage by dedicating this work to them. To my mother for the immense fortitude, support and for being exactly the way she is. To my sister for the enormous support, always keeps me on track. To my father for the support and making me laugh.
To my friends for the patience for listening to me when I was tired and for the supportive company and wise words when needed.
iii RESUMO
A estimativa médico-legal da idade cronológica tem vindo a ter um papel cada vez mais importante, não só na identificação de cadáveres e/ou restos cadavéricos, mas a sua importância e utilização em indivíduos vivos tem expandido nos últimos anos, particularmente pelo aumento do fenómeno da imigração (Schmeling et al., 2007; Oliveira and Gomes, 2017; Ribeiro, Estrela and Machado, 2017).
A sua necessidade enquadra-se, quando se refere a indivíduos vivos, a situações relacionadas com dilemas judiciais associados a menoridade, paternidade, responsabilidade criminal em indivíduos sem documentos de identificação ou com documentação falsa, pedidos de asilo político, refugiados e imigrantes ilegais, adoção sem certidão de nascimento e em indivíduos com problemas psicológicos (Schmeling et al., 2007, 2016; Oliveira and Gomes, 2017; Sykes, Bhayat and Bernitz, 2017).
A estimativa biológica de idade é aplicada quando a data de nascimento é desconhecida. Esta não é uma avaliação precisa, pois recorre às características biológicas individuais relacionadas com o grau de desenvolvimento que varia com fatores genéticos, metabólicos, nutricionais e ambientais (Garn, Lewis and Kerewsky, 1965; Elamin and Liversidge, 2013).
Em situações em que a idade cronológica é desconhecida ou dissimulada, é necessário entender que um individuo pode aparentar uma idade que não corresponde à real. Isto é, pode ter uma idade biológica maior que a cronológica por ter sofrido de várias doenças durante a vida; ou ter uma idade biológica menor à idade cronológica, por apresentar um atraso no desenvolvimento. Para estimar a idade cronológica através da idade biológica é necessário recorrer a métodos científicos para aferir os parâmetros biológicos através do desenvolvimento ósseo, sexual e dentário (Hala et al., 2016; Pinchi et al., 2018).
Existem vários métodos de estimativa da idade dentária que podem ser classificados de invasivos, quando requerem a extração dos dentes; subdividindo em morfológicos, bioquímicos e histológicos, que não são aplicados em indivíduos vivos; e de não-invasivos, nos quais os métodos são baseados no desenvolvimento dentário com recurso a tabelas ou diagramas aplicados a exames radiográficos – metodologia indireta (Maber, Liversidge and Hector, 2006; Cameriere et al., 2008; AlQahtani, Hector and Liversidge, 2014). Os métodos não invasivos são os que detêm maior relevância. Ambos os métodos diferem consoante a faixa etária a que se destinam: aqueles que são aplicados em crianças e adolescentes, baseados na erupção e mineralização dos dentes e, nos quais,
iv
o desenvolvimento dentário não está finalizado; e aqueles que são aplicados em adultos, baseados no binómio alterações dentárias/idade, uma vez que o desenvolvimento dentário se encontra concluído (Massler, Schour and Poncher, 1941).
Contudo, importa referir que nenhum método é 100% exato na estimativa da idade dentária, sendo que as principais razões para tal são os erros sistemáticos inerentes a cada método, a variabilidade intra e inter-observador (Popović and Thomas, 2017) e, com os fatores relacionados com a população em estudo; como a etnia, o nível socioeconómico e as alterações patológicas, levando a situações de sobrestima ou subestima, consoante o método utilizado (Schmeling et al., 2007, 2008; Cesário et al., 2016; Pinchi et al., 2018).
O recurso a radiografias dentárias tem sido utilizado para a estimativa da idade dentária, demonstrando ser uma fonte importante de informação para a Medicina Dentária Forense. Diversos métodos, desenvolvidos por diferentes autores, têm utilizado radiografias periapicais e/ou ortopantomografias como base para os procedimentos de determinação da idade dentária (Cameriere et al., 2008).
A dificuldade aumenta quando se trata de indivíduos com necessidades especiais, devido a síndromes ou outras condições fisiopatológicas que podem modificar o desenvolvimento dentário normal (Diz, Limeres, A.F. Salgado, et al., 2011). Em tais crianças com patologias sistémicas, alguns dos dentes podem aparecer distorcidos na ortopantomografia devido à falta de cooperação durante a execução da mesma. Os distúrbios cromossómicos e síndromes, que surgem de defeitos numéricos e estruturais dos cromossomas, frequentemente incluem manifestações que afetam a região craniofacial, sendo que, muitos desses, apresentam manifestações orais características, como, por exemplo, agenesias múltiplas e erupção tardia da dentição decídua e dentição permanente (Suri, Tompson and Atenafu, 2011; Patil, Rao and Majumdar, 2014).
Existem vários métodos de aplicação a radiografias, entre os quais o Atlas de Londres ou de AlQahtani, (AlQahtani, 2012) o qual já foi aplicado a várias populações, entre as quais una população portuguesa que não apresentou quaisquer diferenças estatisticamente significativas com a população original do método (Pavlović, Pereira and Santos, 2017).
O objetivo principal desta investigação foi realizar a estimativa da idade cronológica de uma população com consulta de necessidades especiais (com deficiências físicas e mentais) da Faculdade de Medicina Dentária da Universidade de Lisboa (FMDUL) e no Hospital Santa Maria (HSM), no âmbito da identificação médico-legal através da aplicação do Atlas de AlQahtani. Este estudo baseou-se na análise de
v
ortopantomografias, exames complementares de diagnóstico utilizados em vários estudos, por forma a realizar a estimativa de idade, demonstrando ser uma importante fonte de informação para a medicina dentária forense. Existem vários métodos, desenvolvidos por diferentes autores, que utilizaram radiografias periapicais e/ou ortopantomografias como base para procedimentos de determinação da idade dentária, que são menos dispendiosos e mais rápidos em comparação com outros métodos e são, portanto, os escolhidos na prática pericial (Kvaal et al., 1995; Schmeling et al., 2007; Macha et al., 2017).
A amostra foi selecionada da população referida através de um processo de amostragem sistemática que compreende 163 ortopantomografias, de 133 pacientes de ambos os sexos com idade compreendida entre 4 e 23 anos. Todos os dados foram registados em quatro folhas do Microsoft Excel® e a análise estatística dos dados foi
realizada utilizando o software estatístico de análise de dados IBM® SPSS® Statistics 25
(Statistical Package for the Social Sciences).
A partir dos resultados obtidos neste estudo podemos concluir que que não houve diferenças estatisticamente significativas entre as estimativas obtidas através do lado esquerdo e do lado direito (p > 0,05), mas há claramente diferenças quando comparamos a idade cronológica com a idade estimada, revelando que as estimativas são enviesadas na população em estudo, ou seja, que há um erro sistemático.
Em relação à instituição e ao género, os nossos resultados mostram que não há diferenças significativas, portanto, o mesmo atlas pode ser usado para ambas as circunstâncias. Verificou-se que houve uma prevalência geral de subestimação em todos os grupos, exceto para as faixas etárias abaixo de 6 e de 7 a 12 anos.
A autora deparou que tinha dificuldades na estimativa da idade no grupo de indíviduos com pelo menos 16 anos (M16), pelo que sugere que o atlas tenha melhor qualidade de imagens dos ápices nos diagramas que descrevam as formas morfológicas e mudanças nos dentes, mais especificamente, para idades próximas a 16 anos. Logo é mais fácil classificar e estimar a idade em menores de 16 anos do que em maiores de 16 anos (Pinchi et al., 2018). O erro médio de subestimação no grupo de indíviduos com menos de 16 anos (m16) foi muito menor (0,75 meses à direita e 0,37 meses à esquerda) do que no grupo M16 (26,10 meses à direita e 26,79 meses à esquerda).
Embora o erro em M16 tenha sido muito maior devido à dificuldade em avaliar corretamente a idade dentária em dentes molares, quando presente, apesar de para este estudo a presença de todos os terceiros molares não fosse um critério de inclusão, deve
vi
ser considerado como tal, para melhor avaliação da idade em maiores de 16 anos (Branco, Pestana and Pereira, 2012; Pavlović, Pereira and Santos, 2017). Isso poderia explicar o motivo das discrepâncias entre os grupos etários, além da baixa qualidade do OPG.
Os resultados obtidos mostram que o Atlas de AlQahtani pode ser usado como um método na estimativa médico-legal de idade para fins periciais numa população com necessidades especiais, mas com precaução em relação ao limite de 16 anos.
Uma última análise foi realizada para aferir se existem diferenças estatisticamente significantes nos pacientes com alterações sistémicas e outras patologias com repercussões dentárias. Os resultados mostraram uma discrepância na estimação de direita versus real e esquerda versus real, o que nos impede de concluir completamente se a hipótese nula pode ou não ser rejeitada. No geral, ainda podemos estabelecer uma tendência de subestimação sem diferenças estatisticamente significativas entre as estimativas direita versus esquerda. Verificamos que no grupo de patologias com repercussões dentárias têm um erro maior na subestimação, portanto, o ponto médio deve ser aumentado em cerca de 15 meses em pacientes com síndrome de Down, alterações cromossómicas, síndromes e distúrbios do sistema nervoso. Enquanto que no grupo sem repercussões dentárias, a subestimação média foi de cerca de 7 meses.
O Atlas de AlQahtani pode potencialmente ser usado como uma ferramenta para a estimativa médico-legal da idade no grupo de indivíduos com patologias sistémicas com repercussão no desenvolvimento dentário, mas sugerimos estudos adicionais com amostras maiores para criar um atlas adequado para esta população, com particular enfoque na idade aproximada de 16 anos.
Palavras-chave: Estimativa Médico-Legal da Idade; Atlas de AlQahtani;
vii ABSTRACT
The medico-legal estimation of chronological age has played an increasingly important role, not only in the identification of humans and/or human remains, but also in the living individuals it has expanded in recent years due to the phenomenon of immigration.
The aim of this investigation was to validate the Atlas of AlQahtani in a population with special needs, to estimate chronological age in a medical-legal context. A sample of 163 orthopantomograms from two institutions was collected from 133 patients aged between 4 and 23 years.
Our results show no statistically significant difference between left and right side (p>0.05), but if we compare chronological versus estimated there clearly is a difference, the estimates are biased, i.e., a systematic error was made. Regarding institution and gender our results show that there are no differences, therefore the same atlas can be used for both circumstances. There is a general prevalence for underestimation, except for the age groups of under 6 and 7 to 12 years.
The average underestimation error in the group under 16 years is much lower (0.75 months right and 0.37 months left) than in the group of at least 16 years old (26.10 months right and 26.79 months left). For those with or without dental repercussions, we can verify that those with dental repercussions have a higher error in underestimation, therefore the midpoint should be increased to about 15 months in patients with Down´s syndrome, chromosomic alterations, syndromes, and central nervous system disorders. For those without dental repercussions, the midpoint for the author was 7 months.
This atlas can be potentially used as a tool for age estimation, but we suggest further studies with larger samples to create adequate atlases for all the required scenarios, in particular, diagrams for patients with special needs with an approximate age of 16 years.
Keywords: Medico-legal Age Estimation; AlQahtani Atlas;
ix INDEX Acknowledgments i Resumo iii Palavras-chave vi Abstract vii Keywords vii 1. Introduction 1 1.1. Final considerations 3 2. Objectives 4 2.1. Main objective 4
2.1.1. Difference between chronological age and estimated dental age 4
2.1.2. Difference between under 16 or over 16 years of age 4
2.2. Secondary objectives 4
2.2.1. Difference between left and right side 4
2.2.2. Difference between gender 5
2.2.3. Difference between institutions 5
3. Materials and methods 6
3.1. Experimental design 6
3.2. Population sample 6
3.2.1. Inclusion criteria 6
3.2.2. Exclusion criteria 6
3.3. Data collection 7
3.4. Methodologies of the study analysis 8
3.5. Data validation methodology 8
3.5.1. Interobserver validation 9 3.5.2. Intraobserver validation 9 3.6. Statistical analysis 10 4. Results 11 4.1. Descriptive analysis 11 4.2. Intraobserver agreement 12 4.3. Interobserver agreement 12
x 4.5. Accuracy of estimates 14 4.6. Institution 15 4.6.1. HSM 15 4.6.2. FMDUL 16 4.6.3. HSM versus FMDUL 16 4.7. Gender 17 4.7.1. Male gender 17 4.7.2. Female gender 17
4.7.3. Male versus Female gender 18
4.8. Age 18
4.8.1. Under 16 years of age (m16) and over 16 years of age (M16) 18
4.8.1.1. m16 19
4.8.1.2. M16 19
4.8.2. Different age groups 20
4.8.2.1. Under 6 years of age 20
4.8.2.2. Between 7 and 12 years of age 20
4.8.2.3. Between 13 and 16 years of age 21
4.8.2.4. At least 17 years of age 21
4.9. Disease 22
4.9.1. Without dental repercussions 22
4.9.1.1. Pathologies with no dental symptoms 22
4.9.1.2. Others 23
4.9.2. With dental repercussions 23
4.9.2.1. Down´s syndrome 23
4.9.2.2. Chromosomic alterations 23
4.9.2.3. Syndromes 24
4.9.2.4. Central nervous system 24
4.9.3. With dental repercussions versus without dental repercussions 24
5. Discussion 26
5.1. Integrity of the experimental methodology 26
5.2. Intraobserver and interobserver validity 26
5.3. Discussion of the results 26
xi
6.1. From the experimental hypotheses 30
6.2. General conclusions 30
Bibliographic references Appendices
31
Appendix 1 – List of abbreviations I
Appendix 2 – Index of tables, graphics and figures II
Appendix 3 – Atlas of AlQahtani 2009 III
Appendix 4 – Favorable appreciation by the Ethics Committee of FMDUL V
Appendix 5 - Diagnosed systemic Diseases (DsD) VI
Appendix 6 - Microsoft Excel® sheet with sample number, gender;
institution and all data collected following the application of the Atlas of AlQahtani. Right Side
VII
Appendix 7 - Microsoft Excel® sheet with sample number, gender;
institution and all data collected following the application of the Atlas of AlQahtani. Left Side
XI
Appendix 8 - Microsoft Excel® sheet with 10% of the sample - Calibration
List for Left and right side
XV
Appendix 9 - Microsoft Excel® sheet that contains the sample number,
gender, institution, real age and estimated age attributed by both observers for the left and right side (FDI)
XVI
Appendix 10 - Distribution of the sample by institution, gender and
chronological age
XXXII
Appendix 11 – Intraobserver agreement XXXIV
Appendix 12 – Estimation frequencies and differences for the Intraobserver
agreement
XXXV
Appendix 13 – Interobserver Agreement (M versus L) XXXVI
Appendix 14 - Estimation frequencies and differences for the Interobserver
agreement
XXXVIII
Appendix 15 - Wilcoxon test for estimated versus chronological (left and
right)
XL
Appendix 16 - Difference Right chronological versus estimated XLII
Appendix 17 – Absolute difference Right chronological versus estimate XLV
xii
Appendix 19 – Absolute difference Left Real L
Appendix 20 – Institution LII
Appendix 21 – Gender LV
Appendix 22 - Differences amongst Age groups LVIII
Appendix 23 - Differences amongst Age groups – 16-year threshold LXI
Appendix 24 – Age estimation in SD and SND LXIV
1 1. INTRODUCTION
In Forensic Sciences, the estimation of chronological age has played an increasingly important role in medical-legal cases, not only in the identification of humans and/or human remains, but it´s importance and use in the living individuals has expanded in recent years, particularly due to the increasing phenomenon of immigration (Schmeling et al., 2007; Oliveira and Gomes, 2017; Ribeiro, Estrela and Machado, 2017; Sykes, Bhayat and Bernitz, 2017).
Knowledge of an individual's chronological age is a basic right, and having it documented is what gives us our individual identity. The date of birth is fundamental to carry out various daily activities such as enrolling in school, starting a career path, marriage, retirement; which are of great legal importance. Chronological and biological age are distinct concepts, the first one relates to the time elapsed since birth, measured in units of time, extending to any point in time being used in research and development monitoring as a legal measure of grouping individuals. The second refers to bone, dental and sexual age; being estimated from the analysis of the maturation of one or more tissues or organs, such as bones or teeth, where maturation is graded by the occurrence of an event or a sequence of events that are irreversible; and which are compared to normal standards (Willems, 2016; Pinchi et al., 2018).
Age estimation is applied when the date of birth is unknown, and this is not an accurate assessment, it recounts to the individual characteristics related to the degree of development that varies with genetic, metabolic, nutritional and environmental factors (Garn, Lewis and Kerewsky, 1965; Elamin and Liversidge, 2013). It is a fundamental and a challenging subject, constantly evolving. It is of great interest in the clinical scope, both medical and medical-dental, at the level of diagnosis, prognosis and evaluation of treatments, as well as in forensic human identification. But it is in the medical-legal aspect that it becomes categorical and determinant (Schmeling et al., 2007, 2016).
Age estimation can support the confirmation of the identity of a human or human remains, however it depends on the quantity and quality of these mortal remains, the environmental conditions in which they are found and the time elapsed, based on the anthropological and dental characteristics (Pereira, Caldas and Pestana, 2013; Macha et al., 2017). Subsequently in living individuals the estimate has to be as accurate as possible since it is assumed that such information is needed in a legal environment (Branco, Pestana and Pereira, 2012), and its applicability in criminal law (validation of documents, imputability and political asylum) and civil law (social benefits, employment and
2
marriage) (Diário da República, 2008; Sykes, Bhayat and Bernitz, 2017). As Ambroise Paré said “It is the application of medical knowledge to judicial problems” (Boyd Howard Hill, 1960).
In recent years, the application of the medico-legal age estimate has been of great importance to the level of expertise in living individuals, and it is necessary to find precise techniques for this purpose (Pereira, Escobar and Santos, 2015). Its necessity is related, when referring to living individuals, to situations involving judicial and civil dilemmas associated with minority, paternity, criminal responsibility for individuals without identification documents or with false documentation, political asylum applications, refugees and illegal immigrants, adoption without birth certificate, alleged incapacity and claim of old age pensions (Schmeling et al., 2016; Oliveira and Gomes, 2017). The estimation of age by dental methods was included as part of the process of asylum seeking in Portugal and the legal framework of forensic examination is based on biomedical ethics (Diário da República, 2004). In 2016, 40 people were registered as victims of human trafficking. Of this total, eight victims were minors. There is also evidence of 24 requests for asylum by unaccompanied minors, 21 originating from Africa (mostly aged between 16 and 17 years) (Oliveira and Gomes, 2017; Ribeiro, Estrela and Machado, 2017). Unaccompanied minors are a very vulnerable group in need of protection and therefore special measures are taken by the government of the first EU country where they enter and apply for asylum, where a legal guardian is appointed, who is legally responsible for the care and well-being of these minors. According to EU directives, all individuals claiming an age minority have the fundamental rights of child protection, health care and education established in the UN conventions on Rights of the Child (United Nations High Commissioner for Refugees, 1954; European Commission, 1989; Maber, Liversidge and Hector, 2006; Pereira, Escobar and Santos, 2015).
Dental development has several structural changes throughout life that make them good age indicators, and their mineralization and eruption are less affected by endocrine, environmental and nutritional changes, compared to bone markers; thus, being extremely significant and primordial in estimating age (Garn, Lewis and Polacheck, 1959; Garn, Lewis and Kerewsky, 1965; Schmeling et al., 2007; Elamin and Liversidge, 2013).
Dental radiographs have been used for dental age estimation, proving to be an important source of information for Forensic Dentistry. Several methods, developed by different authors, have used periapical radiographs and/or OPGs as a basis for dental age determination procedures, which are less expensive and faster compared to other methods
3
and are therefore the ones chosen (Kvaal et al., 1995; Schmeling et al., 2007; Macha et al., 2017).
However, it should be noted that no method is 100% accurate in estimating dental age and the main reasons for this are the systematic errors inherent to each method, intra- and interobserver variability (Popović and Thomas, 2017) and with factors related to the study population such as ethnicity, socioeconomic level and pathological alterations, leading to situations of overestimation or underestimation, depending on the method used (Schmeling et al., 2008; Cesário et al., 2016; Willems, 2016).
The difficulty surges when it comes to individuals with special needs whether it´s due to a syndrome or other conditions, that may modify normal dental development (Seagriff-Curtin, Pugliese and Romer, 2006; Diz, Limeres, A.F. Salgado, et al., 2011). In such syndromic children, some teeth may appear distorted in the OPG due to the lack of cooperation during the execution of the exam. Chromosomal disorders and syndromes arising from numerical and structural defects of chromosomes often include manifestations affecting the craniofacial region, and many of these chromosomal and multifactorial disorders have characteristic oral manifestations, such as multiple agenesis and late eruption of the deciduous dentition and permanent dentition (Seagriff-Curtin, Pugliese and Romer, 2006; Suri, Tompson and Atenafu, 2011; Patil, Rao and Majumdar, 2014; Pinchi et al., 2018). The prevalence of births with chromosomal anomalies was 34.8 cases/10000 births, Down´s syndrome being the group of congenital anomalies with a higher prevalence (19.6 cases/10000 births) (Cuoghi et al., 2016; Braz, Machado and Dias, 2017).
There are several methods of age estimation through the use of radiography, including the Atlas of London or AlQahtani (AlQahtani, 2012)(Appendix 3) which has already been applied to several populations, including the Portuguese population (Cesário et al., 2016; Pavlović, Pereira and Santos, 2017) and did not present a statistically significant difference with the original population of the method, although a statistically significant bias has been found in the age estimation of males.
1.1. Final considerations
In this way, the objective of this investigation is to validate the Atlas of AlQahtani, by means of panoramic radiographs, in a population with physical and mental congenital deficiencies, in order to be able to estimate chronological age in a medical-legal context.
4 2. OBJECTIVES
2.1. Main objective
The main objective of this research was to estimate the chronological age of a population with a special needs consultation at the Faculdade de Medicina Dentária da Universidade de Lisboa (FMDUL) and at the Hospital Santa Maria (HSM), within the scope of medical-legal identification, through the application of the Atlas of AlQahtani. This study was based on the analysis of OPGs. For this purpose, the following experimental hypotheses were formulated:
2.1.1. Difference between chronological age and estimated dental age
H0: There are no statistically significant differences between the medians
of chronological age and of the estimated dental age by the Atlas of AlQahtani.
H1: There are statistically significant differences between the medians of
chronological age and of estimated dental age by the Atlas of AlQahtani.
2.1.2. Difference between under or over 16 years of age
H0: There are no statistically significant differences between the accuracy
of age estimates obtained by Atlas of AlQahtani in children under 16 years and over 16 years old.
H1: There are statistically significant differences between the accuracy of
age estimates obtained by Atlas of AlQahtani in children under 16 years and over 16 years old.
2.2. Secondary objectives
Corroborate if there are any differences between the application of the method to the left side and the right side in the OPGs; if there are any differences between the application of the method to the male gender (MG) and to the female gender (FG); and differences between institutions;
For this purpose, the following experimental hypotheses were formulated:
2.2.1. Difference between left and right side
H0: There are no statistically significant differences between age estimates
5 H1: There are statistically significant differences between age estimates
obtained by Atlas of AlQahtani through the left side and through the right side.
2.2.2. Difference between gender
Corroborate if there are any differences between the MG and the FG. For this purpose, the following experimental hypotheses were formulated:
H0: There are no statistically significant differences between the accuracy
of age estimates obtained by the Atlas of AlQahtani to the MG and to the FG.
H1: There are statistically significant differences between the accuracy of
age estimates obtained by the Atlas of AlQahtani to the MG and to the FG.
2.2.3. Difference between institutions
Corroborate if there are any differences between FMDUL and HSM. For this purpose, the following experimental hypotheses were formulated:
H0: There are no statistically significant differences between the accuracy
of age estimates obtained by the Atlas of AlQahtani in the FMDUL and in the HSM.
H1: There are statistically significant differences between the accuracy of
6 3. MATERIALS AND METHODS
3.1. Experimental design
The research was carried out at the Faculdade de Medicina Dentária da Universidade de Lisboa (FMDUL) and Hospital de Santa Maria (HSM) and had as target a population of patients with special needs from these two institutions whose clinical records are in the Pre-Graduation Clinics in Dental Medicine, Oral Hygiene, in the Department of Post-Graduation in Orthodontics and in the Service of Stomatology of Centro Hospitalar Lisboa Norte, EPE.
The sample was selected from the referred population through a systematic sampling process and would comprise a minimum of 100 cases of both genders, aged between 2.5 and 23 years, all with an OPGs. In this study, a total of 163 OPGs were analyzed, from 133 patients, of which 60 were females (76 OPGs) and 73 were males (87 OPGs), collected from the Faculdade de Medicina Dentária da Universidade de Lisboa and Centro Hospitalar Lisboa Norte, EPE. The chronological age of each subject was calculated by subtracting the date of the X-ray from the date of birth, after converting both into months. The experimental protocol was evaluated by the Ethics Committee of FMDUL and duly authorized by this entity (Appendix 4) and by Professor Doutor Francisco Salvado, director of the stomatology service of the special needs appointments of HSM.
3.2. Population sample
The selection of the sample was based on the following criteria:
3.2.1. Inclusion criteria (a) Dental parameters:
- Presence of healthy teeth that are in the period of mineralization and eruption.
(b) Identification parameters:
- Age between 2.5 years and 23 years.
3.2.2. Exclusion criteria (a) Dental parameters:
- Presence of extensive dental caries lesions; - Presence of direct or indirect restorations; - Presence of trauma or dental fracture; - Presence of periodontal disease;
7
- Presence of dental rotations;
- Presence of dental rehabilitation with fixed prosthesis; - Presence of orthodontic appliance;
- Presence of internal or external dental resorption, calcification, pulp fibrosis or periapical pathology;
- Presence of endodontic treatment.
(b) Radiographic parameters:
- Presence of dental overlaps, which interfere with the application of the Atlas of AlQahtani;
- Distortion on the radiograph.
3.3. Data Collection
The data that was obtained from the clinical files where: - Number of the file;
- Date of birth (DoB); - Gender;
- Date of the radiography (DoR), with the corresponding age at that moment, in years and months;
- Systemic disease of the patient (Appendix 5).
The OPGs were assigned with an individual number, which was different from the protocol number to ensure the confidentiality of data. The dental classification utilized for the tables was FDI World Dental Federation Notation. All data was recorded on four sheets of Microsoft Excel®:
• The first sheet which contains the sample number and the corresponding clinical file number, name of the patient, DoB and age (registered in years and months), DoR (registered in years and months) and the diagnosed systemic disease (DsD). Chronological age was calculated using the simple formula DoB and DoR registered in years and months. This sheet was eliminated once the investigation was terminated;
• A second sheet, that contains the sample number, gender, institution and all data collected following the application of the Atlas of AlQahtani (Appendix 6 (right side) and Appendix 7 (left side));
• A third sheet that contains sample number, gender, institution and all the data collected following the repetition of the application of the Atlas of AlQahtani on 10% of the sample (Appendix 8);
8
• A fourth sheet that contains the sample number, gender, institution, real age and estimated age attributed by both observers for the left and right side (Appendix 9).
3.4. Methodologies of the study analysis
The radiographs where analyzed following the mineralization table proposed by AlQahtani by means of the following steps:
a) Compare the radiographic image of each of the teeth in formation and recording
the data in Microsoft Excel® sheets;
b) Estimate the mineralization stage of each tooth analyzed and identify the time
interval (in months and years) to which it corresponds;
c) After the analysis of all the teeth, obtain a series of minimum and maximum
estimated values;
d) The minimum and maximum age discrepancies where discarded to reduce
possible errors;
e) Register the mean of the estimated minimum ages and another of the estimated
maximum ages, thus establishing the probable age range of the examined at the time of the radiographic examination;
f) When the tooth examined was between two stages of mineralization, it was
considered the upper limit of the lower stage and the lower limit of the upper stage. After the radiographic analysis, a comparison of the estimated age range of each individual with their actual age, which until then was unknown by the researchers, will be performed.
3.5. Data validation methodology
The data of the clinical files was collected by the author and by a second appraiser, therefore it was necessary to evaluate the Intra-class correlation (ICC), thus the interobserver and intraobserver reliability was calculated. In summary, when researchers report measurement variability, it is critical that they report exactly what they mean. The lowest level of variability occurs when a predefined frame within the clip was re-measured by the original observer (intraobserver variability) or a second one (interobserver variability). A second level occurs when different clips/frames from the same study are chosen for reanalysis. For each sample case an age estimate was assigned for each tooth and for the left and right side of every sample case, as well as analysis by institution, gender and age group.
This is a validation measure of the method used to evaluate the degree of agreement of the results, generally ranging from 0 to 1. The distribution of the difference
9
between the results of the same observer and between the two observers was obtained, and the agreement was measured through the intraclass correlation coefficient that can be interpreted as follows (Fleiss, 1999):
• Up to 0.39 – Poor agreement;
• Between 0.40 and 0.74 – Moderate to good agreement; • Superior then 0.75 – Excellent agreement.
3.5.1. Interobserver validation
Intra-class correlation (ICC) was calculated to evaluate interobserver reliability. The interobserver variability corresponds to the lack of reproducibility between two or more observers. When this discrepancy occurs, errors are introduced. To reduce random errors, the validation of the data collected from the clinical files was performed by two previously calibrated observers and the degree of interobserver variability was assessed, as both observers would apply the same method to multiple OPGs to reduce possible bias. All cases were evaluated by both observers individually.
3.5.2. Intraobserver validation
Intraobserver variability consists of non-reproducibility of data due to the involuntary alteration of the application of the criteria over time, leading to the introduction of systematic errors at any time.
Systematic errors should be avoided by clearly applying the defined criteria. To reduce random errors, the validation of the data collected by the author will be done by a repetition of a predetermined number of observations with an interval period large enough to eliminate the memory effect. This interval was of 3 months and with a reanalysis of 10% of the sample was performed, a total of 17 radiograms. The sample selection was on a random basis.
The data obtained in the first analysis was concealed from the author during the repetition of the observations. Subsequently, the values obtained in the first analysis were compared with those of the second analysis (intraobserver agreement) and the second observer (interobserver agreement).
To avoid that the results of the study were favored in any way that it favors the agreement between results, these were kept in different sheets of Microsoft Excel® where
10 3.6. Statistical analysis
The Statistical analysis of the data was performed using the statistical data analysis software IBM® SPSS® Statistics 25 (Statistical Package for the Social Sciences).
The program was used to make a datasheet, to enter, check and analyze the data. For all tests, the significance level was 5% (α=0.05). This indicates the probability of rejecting the null hypothesis when it is true. To obtain the estimated age in function of the institution, gender and age group, the means, medians, minimum and maximum of each of these variables were calculated, and the Wilcoxon non-parametric test for related samples applied to compare the medians. Parametric tests were not applied since the normality of any of the variables under study was always rejected in the application of the Kolmogorov-Sminrnov test (all obtained p-values were equal or quite close to zero). These results were already expected as the variables are valued in number of months and therefore they are not truly continuous. In addition to the chronological age, the age estimates obtained by Atlas of AlQahtani though the left side and through the right side, the following variables were used:
• Dif_Right_Real = Estimated age London atlas right (months) - Chronological age (months);
• Abs_Dif_Right_Real = Absolute value of Dif_Right_Real;
• Dif_Left_Real = Estimated age London atlas left (months) - Chronological age (months);
• Abs_Dif_Left_Real = Absolute value of Dif_Left_Real;
• Dif_Right_Left = Estimated age London atlas right (months) - Estimated age London atlas left (months);
11 4. RESULTS
4.1. Descriptive analysis
For this study a sample of 163 orthopantomograms from two institutions, FMDUL (n=112) and HSM (n=51), were collected from 133 patients. The sample from FMDUL represents 68.7% and HSM sample represents 31.3% of the over-all sample. The distribution between institutions was not symmetrical (Chart 1).
The sample entailed 133 individuals (60 female and 73 male), of which a total of 163 orthopantomograms were used for this study, of whom 76 were female and 87 were male, aged between 4 and 23 years. The distribution of the sample within each institution by age and gender shows a larger number of individuals in the age groups of 10, 11 and 17 years. The male gender (MG) sample represents 53.4% and the female gender (FG) represents 46.6% of the total sample (n=163) (Appendix 10).
Chart 1 - Sample distribution by institution
12 4.2. Intraobserver agreement
The intraobserver agreement was evaluated using the intraclass correlation coefficient (ICC) for the right and the left side. For that, a reanalysis of 10% (n=17) of the observations of the total sample was conducted after a period of 3 months (Appendix 8).
The values of 0.956 (London_Right_1 versus a London_Right_2) and 0.977 (London_Left_1 versus a London_Left_2), correspond to an almost perfect agreement. The upper and lower limits for the right side were 0.984 and 0.886, correspondingly, as for the left side, upper and lower limits were 0.991 and 0.938, correspondingly (Chart 3). This suggests that good results were obtained, with no problem for the intraobserver analysis (Appendix 11). Moreover, the same estimates were obtained in both evaluations in the majority of the individuals, without any significant differences in the others (despite 36 months difference in one case) (Appendix 12).
4.3. Interobserver agreement
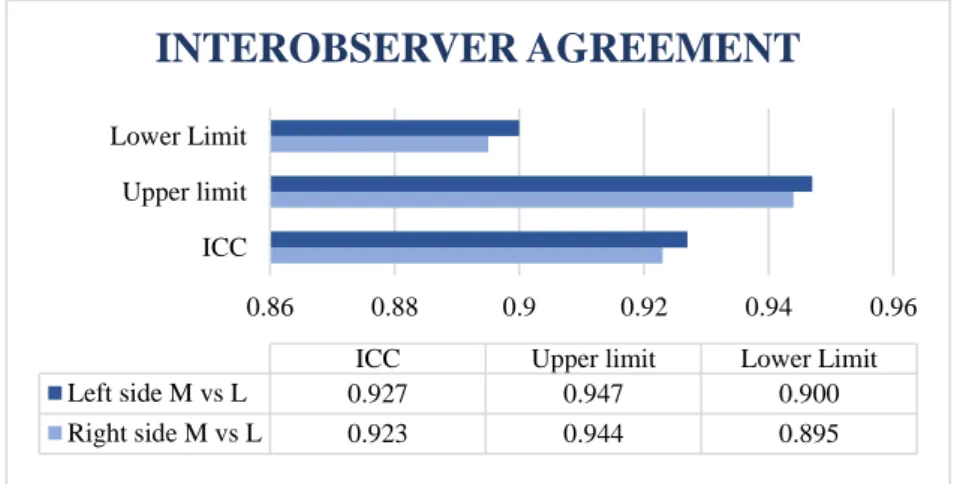
The interobserver agreement was evaluated using the intraclass correlation coefficient (ICC) for both observers. They were denominated as observer M and observer L. For the analysis of the right side, from the total sample n=163 (100%), a sample of 157 (96.3%) was used due to the exclusion of 6 (3.7%). As for the left side, from the total sample n=163 (100%), a sample of 156 (95.7%) was used due to the exclusion of 7 (4.3%). The values of 0.923 (London_Right_M versus London_Right_L) and 0.927 (London_Left_M versus London_Left_L), correspond to an almost perfect agreement between observers (Appendix 13) (Chart 4).
0.8 0.85 0.9 0.95 1
ICC Upper limit Lower Limit
ICC Upper limit Lower Limit
Left side 0.977 0.991 0.938
Right side 0.956 0.984 0.886
INTRAOBSERVER AGREEMENT
13
The upper and lower limits for the right side where 0.944 and 0.895, correspondingly, as for the left side, upper and lower limits where 0.947 and 0.900, correspondingly. This suggests that good results were obtained, thus, in both cases the values are good, with no problem at the level of the interobserver analysis (Appendix 13). However, when comparing the estimates, it was observed that in some cases there are a few discrepancies between observers, therefore some considerations on the comparison between the estimates of the two observers should be mentioned (Table 1) (Appendix 14):
• On both sides there were 3 cases (1.9%) with an error greater than 48 months, as well as 9 cases with error equal to 48 months (5.7%). Nevertheless, in most cases, 116 (73.9%) on the right side and 121 (77.6%) on the left side, the difference is at most 12 months;
• The mean difference between the estimatesfrom the two observers for the right (as well as for the left) side was 4 months.
0.86 0.88 0.9 0.92 0.94 0.96
ICC Upper limit Lower Limit
ICC Upper limit Lower Limit
Left side M vs L 0.927 0.947 0.900
Right side M vs L 0.923 0.944 0.895
INTEROBSERVER AGREEMENT
Chart 4 - Interobserver agreement
14 4.4. Right versus left
For this evaluation the total sample of n=163 was utilized. Some considerations on the comparison between the right and left side estimation using the Dif_Right_Left and Abs_ Dif_Right_Left variables:
• The difference between the two estimates was, on average, 0.07 months; • In one individual the difference between the two estimates was 36 months, • In 7 individuals the difference between the two estimates was 24 months (in 3 the right estimate was higher than the left and the other 4 the opposite);
• In 40 individuals it was 12 months (in 23 the right estimate was higher than the left and in the remaining 17 the opposite was the case);
• In the remaining 115 cases (70.6% of the sample) the estimates are the same. In the Wilcoxon non-parametric test for comparison of medians in related samples, the test p-value was 0.864, therefore the conclusion is to not reject the null hypothesis, so there is no evidence that the median of the two estimates is different. This analysis seems to illustrate that there are no significant differences between the two estimates (right versus left) although this conclusion does not state anything about the accuracy of the obtained estimates, since they have not yet been compared with the chronological age (Appendix 15).
4.5. Accuracy of estimates
Some considerations about the Estimated age London atlas right using the Dif_Right_Real (Appendix 16) and Abs_ Dif_Right_Real variables (Appendix 17):
• The underestimation is, on average, 11.64 months (the estimate obtained was, on average, 11.64 months below the chronological age);
• The observed maximum underestimation error was 123 months (there was an individual whose estimate was 123 months below the chronological age);
• The observed maximum error of overestimation was 67 months (there was an individual whose estimate was 67 months higher than the chronological age);
• The average error of estimation (in absolute value) was about 22 months;
Since the t-test should only be used in variables with a normal distribution (which is not the case), Wilcoxon's non-parametric test to compare the right estimates with the
15
real age was applied for related samples, which compares the medians. The test p-value was 0.000 (reject the null hypothesis, so there is evidence that the median is different).
Some considerations about the Estimated age London atlas left using the variables Dif_Left_Real (Appendix 18) and Abs_Dif_Left_Real (Appendix 19):
• The underestimation was, on average, 11.71 months (the estimate obtained was, on average, 11.71 months below the chronological age);
• The observed maximum underestimation error was 123 months (there was an individual whose estimate was 123 months below the chronological age);
• The maximum error of overestimation was 67 months (there was an individual whose estimate was 67 months higher than the chronological age);
• The average error of estimation (in absolute value) was about 22.31 months. In the Wilcoxon non-parametric test for comparison of medians in related samples, the value of the test p-value was 0.000, therefore the conclusion was equivalent (reject the null hypothesis so there is evidence that the median is different). Therefore, it seems that the estimates obtained on both sides are biased, i.e., that a systematic error was made when using this estimation procedure.
4.6. Institution
When separating the HSM (n=51) data from the FMDUL (n=112) some differences were observed (Appendix 20).
4.6.1. HSM
In the HSM data, there was a trend for underestimation, on average, of 8.43 months (right side) and of 7.96 months (left side). The average error of estimation (in absolute value) was, for the right side, 17.96 months and for the left side 18.67 months. On both sides, the observed maximum underestimation error was 77 months and the maximum error of overestimation was 33 months. When we compare right versus left the average error was 0.47 months (absolute value of 3.29), where the maximum difference was 36 months.
In the non-parametric hypotheses tests, it seems to reach the same conclusions, to reject the equality of averages and/or medians when comparing estimates with the real values:
16
• p-value = 0.060 (left versus real); • p-value = 0.776 (right versus left).
The results showed a discrepancy in the estimation of right versus real and left versus real which prevents us from making a full conclusion as to whether the null hypothesis can or not be rejected. Overall, we can still establish a trend towards underestimation and there were no statistically significant differences between estimates right versus left. Although the p-value is higher than the 5% significance level, the difference is minimal. Nevertheless, based only on the p-value the null hypothesis should not be rejected.
4.6.2. FMDUL
In the FMDUL data, there was an error of underestimation, in average, of 13.10 months (right side) and of 13.42 months (left side). The average error of estimation (in absolute value) was 23.94 months for the right side and 23.97 months for the left. On both sides, the observed maximum underestimation error was 123 months and the maximum error of overestimation was 67 months. When we compare right versus left the average difference was 0.32 months (absolute value of 4.61), where the maximum difference between the two estimates was 24 months.
In the non-parametric hypotheses tests, it seems to arrive to the conclusion to reject the equality of averages and/or medians when comparing estimates with the real values:
• p-value = 0.000 (right versus real); • p-value = 0.000 (left versus real); • p-value = 0.726 (right versus left).
There seems to be significant differences between the estimates (left and right) and real age, with no differences between the right versus left.
4.6.3. HSM versus FMDUL
In the application of tests to compare the means and/or medians of the estimation errors of HSM data with those of FMDUL no significant differences were found:
• p-value = 0.302 Dif_Right_Real (HSM versus FMDUL); • p-value = 0.272 Dif_Left_Real (HSM versus FMDUL); • p-value = 0.495 Dif_Right_Left (HSM versus FMDUL).
17
Thus, we cannot reject the equality of the estimates accuracy when we compare the estimates from HSM to the estimates from FMDUL.
4.7. Gender
When separating the data in the gender group (FG versus MG) we have n=87 MG and n=76 FG. We also noticed some differences amongst them but none statistically significant (Appendix 21).
4.7.1. Male gender
In the MG there was an error of underestimation, on average, of 15.31 months (right side) and 15.86 months (left side). The average error of estimation (in absolute value) was, for the right side was 22.44 months and for the left side was 23.01 months. On the right side, the observed maximum underestimation error was 123 months and the maximum error of overestimation was 33 months. As for the left side, the observed maximum underestimation error was 123 months and the maximum error of overestimation was 37 months. When we compare right versus left the average difference was 0.55 months (absolute value of 4.14), where the maximum difference was 24 months.
In the non-parametric hypothesis tests, we reached the following results: • p-value = 0.000 (right versus real);
• p-value = 0.000 (left versus real); • p-value = 0.567 (right versus left).
In the MG, there seems to be significant differences between the estimates (left and right) and real age, with no differences between the right versus left.
4.7.2. Female gender
In the FG there was an error of underestimation, on average, of 7.43 months (right side) and 6.96 months (left side). The average error of estimation (in absolute value) was, for the right side 21.64 months and for the left 21.51 months. On the right side, the observed maximum underestimation error was 91 months and the maximum error of overestimation was 67 months. As for the left side, the observed maximum underestimation error was 79 months and the maximum error of overestimation was 67 months. When we compare right versus left the average difference was 0.47 months (absolute value of 4.26), where the maximum difference was 36 months.
18
• p-value = 0.032 (right versus real); • p-value = 0.052 (left versus real); • p-value = 0.705 (right versus left).
The results showed a discrepancy in the estimation of right versus real and left versus real which prevents us from making a full conclusion as to whether the null hypothesis can or not be rejected. Overall, we can still establish a trend towards underestimation and there were no statistically significant differences between estimates right versus left. When analyzing the accuracy of the estimates, there is a p-value higher than the 5% significance level, but the difference is minimal, therefore, based only on the p-value the null hypothesis should not be rejected on the left side. This case seems to indicate that we are on the threshold of rejecting and not rejecting the null hypothesis, because it does not detect differences between the left and right estimates, nor between the left estimates and the real values, but it detects between the right estimates and the real values.
4.7.3. Male versus Female gender
In the application of tests to compare the medians of the errors of the data MG with the FG, no significant differences were presented in the non-parametric test:
• p-value = 0.133 Dif_Right_Real (MG versus FG); • p-value = 0.073 Dif_Left_Real (MG versus FG); • p-value = 0.563 Dif_Right_Left (MG versus FG).
Thereby, the results reveal no significant differences between MG and FG.
4.8. Age
When separating the data into the age groups, we noticed some differences between the different groups of under and at least 16-years of age. When we separate the age groups into the subgroups of up to 6 years, between 7 and 12 years, between 13 and 16 years, and at least 17 years old we can appreciate different results in the age estimation (Appendix 22).
19 4.8.1. Under 16 years of age (m16) and over 16 years of age(M16)
When dividing the sample into two groups, under 16 years (m16) and at least 16 years (M16), the results are completely dissimilar. For this section we have 93 individuals for m16 and 70 individuals for M16 (Appendix 23).
4.8.1.1. m16
For this group we have n=93, there was an error of underestimation, on average, of 0.75 months (right side) and 0.37 months (left side). The average error of estimation (in absolute value) was, for the right side 14.80 months and for the left 14.11 months. On the right side, the observed maximum underestimation error was 51 months and the maximum error of overestimation was 67 months. As for the left side, the observed maximum underestimation error was 63 months and the maximum error of overestimation was 67 months. When we compare right versus left the average difference was 0.39 months (absolute value of 2.97), where the maximum difference was 24 months.
In the non-parametric hypothesis tests, we reached the following conclusions: • p-value = 0.532 (right versus real);
• p-value = 0.859 (left versus real) • p-value = 0.549 (right versus left).
The results reveal no significant differences; therefore, the null hypothesis is not rejected on both sides, either comparing to real age or when comparing sides. Of the 93 m16 individuals there were 90 (96.8%) (same estimates on the left and right sides) that were well classified as m16.
4.8.1.2. M16
For this group we have n=70, there was an error of underestimation, on average, of 26.10 months (right side) and 26.79 months (left side). The average error of estimation (in absolute value) was, for the right side 31.73 months and for the left 33.21 months. On the right side, the observed maximum underestimation error was 123 months and the maximum error of overestimation was 32 months. As for the left side, the observed maximum underestimation error was 123 months and the maximum error of overestimation was 37 months. When we compare right versus left the average difference was 0.69 months (absolute value of 5.83), where the maximum difference was 36 months.
20
• p-value = 0.000 (right versus real); • p-value = 0.000 (left versus real); • p-value = 0.557 (right versus left).
In this group (M16) the null hypothesis is clearly rejected (p-value equal to zero) in the first two hypothesis tests. Of the 70 M16 individuals there are 53 (75.7%) (right) and 52 (74.3%) (left) who have an estimate of at least 16 years of age. (Appendix 23). As in the previous cases, no differences were verified in right versus left estimates.
4.8.2. Different age groups 4.8.2.1. Up to 6 years of age
For this group we have n=7, there was an error of overestimation, on average, of 4.57 months (right side) and 2.86 months (left side). The average error of estimation (in absolute value) was, for the right side 8.00 months and for the left 6.00 months. On the right side, the observed maximum underestimation error was 8 months and the maximum error of overestimation was 20 months. As for the left side, the observed maximum underestimation error was 8 months and the maximum error of overestimation was 11 months. When we compare right versus left the average difference was 1.71 months (absolute value of 5.14), where the maximum difference was 12 months (Appendix 22).
In the non-parametric hypothesis tests, we reached the following conclusions: • p-value = 0.395 (right versus real);
• p-value = 0.268 (left versus real); • p-value = 0.564 (right versus left).
The estimates seem to be unbiased in this age group, therefore the null hypothesis is not rejected (both for right and the left side versus real). Also, no differences between right versus left were found.
4.8.2.2. Between 7 and 12 years of age
For this group we have n=59, there was an error of overestimation, on average, of 2.02 months on both sides. The average error of estimation (in absolute value) was, for the right side 15.10 months and for the left 14.97 months. On the right side, the observed maximum underestimation error was 51 months and the maximum error of overestimation was 67 months. As for the left side, the observed maximum underestimation error was 63 months and the maximum error of overestimation was 67
21
months. When we compare right versus left the average difference was 0 months (absolute value of 2.44), where the maximum difference was 24 months (Appendix 22).
In the non-parametric hypothesis tests, we reached the following conclusions: • p-value = 0.453 (right versus real);
• p-value = 0.311 (left versus real); • p-value = 1.000 (right versus left).
Therefore, the estimates seem to be unbiased in this group. The null hypothesis is not rejected (both for the right and the left side versus real). Also, no differences were found between right versus left estimates.
4.8.2.3. Between 13 and 16 years of age
For this group we have n=37, there was an error of underestimation, on average, of 7.95 months (right side) and 6.97 months (left side). The average error of estimation (in absolute value) was, for the right side 16.11 months and for the left 16.59 months. On the right side, the observed maximum underestimation error was 30 months and the maximum error of overestimation was 33 months. As for the left side, the observed maximum underestimation error was 50 months and the maximum error of overestimation was 37 months. When we compare right versus left the average difference was 0.97 months (absolute value of 4.22), where the maximum difference was 24 (Appendix 22).
In the non-parametric hypothesis tests, we reached the following conclusions: • p-value = 0.006 (right versus real);
• p-value = 0.026 (left versus real); • p-value = 0.477 (right versus left).
In this group the results reveal significant differences between estimates and real age, thus the estimates seem to be biased towards underestimation. The null hypothesis was rejected (both for the right and the left side versus real). No differences between right versus left estimates were found.
4.8.2.4. At least 17 years of age
For this group we have n=60, there was an error of underestimation, on average, of 29.23 months (right side) and 29.83 months (left side). The average error of estimation (in absolute value) was, for the right side 34.23 months and for the left 34.97 months. On
22
both sides, the observed maximum underestimation error was 123 months and the maximum error of overestimation was 32 months. When we compare right versus left the average difference was 0.60 months (absolute value of 5.80), where the maximum difference was 36 (Appendix 22).
In the non-parametric hypothesis tests, we reached the following conclusions: • p-value = 0.000 (right versus real);
• p-value = 0.000 (left versus real); • p-value = 0.583 (right versus left).
In this group the results reveal significant differences between estimates and real age, thus the estimates seem to be biased towards underestimation. The null hypothesis was rejected (both for the right and the left side versus real). No differences between right versus left estimates were found.
4.9. Disease
For this section, a division was made into two groups of the diagnosed diseases of the population in study. A group where no repercussions in the mineralization and dental eruption was evident and a group where dental repercussions where evident. The repercussions group was divided into several sub-groups where we divided the systemic diseases into Down´s Syndrome, chromosomic alterations, syndromes and central nervous system (Appendix 5, 24 and 25).
4.9.1.Without dental repercussions
In this group without dental repercussions we have n=68. These groups were sub-divided as follows:
4.9.1.1. Pathologies with no dental symptoms
For this group we have n=19, there was an error of underestimation, on average, of 6.84 months (both right and left sides). The average error of estimation (in absolute value) was for both sides 22.21 months. On the right side, the observed maximum underestimation error was 48 months and the maximum error of overestimation was 39 months. As for the left side, the observed maximum underestimation error was 60 months and the maximum error of overestimation was 27 months. When we compare right versus left the average difference was 0.00 months (absolute value of 2.53), where the maximum difference was 12 months.
23 4.9.1.2. Others
For this group we have n=49, there was an error of underestimation, on average, of 6.22 months (right side) and 7.45 months (left side). The average error of estimation (in absolute value) was, for the right side 21.69 months and for the left 21.24 months. On both sides, the observed maximum underestimation error was 123 months and the maximum error of overestimation was 67 months. When we compare right versus left the average difference was 1.22 months (absolute value of 3.18), where the maximum difference was 24 months.
4.9.2. With dental repercussions
In this group with dental repercussions we have n=95. These groups were sub-divided as follows.
4.9.2.1. Down´s Syndrome
For this group we have n=23, there was an error of underestimation, on average, of 22.48 months (right side) and 20.91 months (left side). The average error of estimation (in absolute value) was, for the right side 32.04 months and for the left 29.61 months. On both sides, the observed maximum underestimation error was 77 months and the maximum error of overestimation was 29 months. When we compare right versus left the average difference was 1.57 months (absolute value of 7.83), where the maximum difference was 36 months.
4.9.2.2. Chromosomic alterations
For this group we have n=11, there was an error of underestimation, on average, of 19.27 months (right side) and 16.00 months (left side). The average error of estimation (in absolute value) was, for the right side 24.00 months and for the left 24.73 months. On the right side, the observed maximum underestimation error was 60 months and the maximum error of overestimation was 26 months. As for the left side, the observed maximum underestimation error was 72 months and the maximum error of overestimation was 26 months. When we compare right versus left the average difference was 3.27 months (absolute value of 9.82), where the maximum difference was 24 months.
24 4.9.2.3. Syndromes
For this group we have n=23, there was an error of underestimation, on average, of 10.17 months (right side) and 12.26 months (left side). The average error of estimation (in absolute value) was, for the right side 14.87 months and for the left 17.91 months. On the right side, the observed maximum underestimation error was 51 months and the maximum error of overestimation was 24 months. As for the left side, the observed maximum underestimation error was 63 months and the maximum error of overestimation was 24 months. When we compare right versus left the average difference was 2.09 months (absolute value of 3.13), where the maximum difference was 24 months.
4.9.2.4. Central Nervous System
For this group we have n=38, there was an error of underestimation, on average, of 13.13 months (right side) and 12.50 months (left side). The average error of estimation (in absolute value) was, for the right side 20.24 months and for the left 21.29 months. On the right side, the observed maximum underestimation error was 91 months and the maximum error of overestimation was 32 months. As for the left side, the observed maximum underestimation error was 79 months and the maximum error of overestimation was 37 months. When we compare right versus left the average difference was 0.63 months (absolute value of 3.16), where the maximum difference was 24 months
For all of the six groups, in the non-parametric hypothesis tests, we reached the following conclusions:
• p-value = 0.255 (right versus real); • p-value = 0.579 (left versus real); • p-value = 0.796 (right versus left).
When comparing the medians of the three variables under analysis, the results reveal no significant differences between the six groups, therefore the null hypothesis was not rejected.
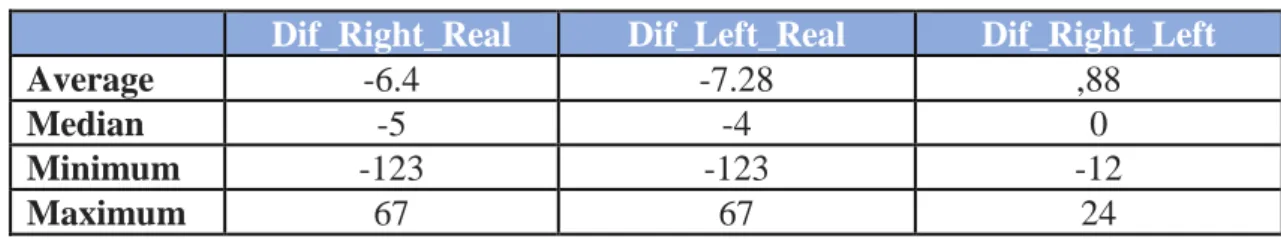
4.9.3. With dental repercussions versus without dental repercussions
Tables 2 and 3 provide some results about the estimation errors of the group without dental repercussions (control group) and the group with dental repercussions.