A Work Project, presented as part of the requirements for the Award of a Masters Degree in Management from the NOVA – School of Business and Economics.
“An Internal Analysis of Amorim Turismo’s Operations Regarding Food and Beverage with a Focus on Operational Efficiency and Quality of Service”
Mafalda Maria Lobo Machado de Mesquita Guimarães - 1329
A Field Lab carried out in Entrepreneurial Innovation Ventures, under the supervision of:
Professor Filipe Castro Soeiro
“An Internal Analysis of Amorim Turismo’s Operations Regarding Food and Beverage with a Focus on Operational Efficiency and Quality of Service”
Abstract
This Work Project has the objective of performing an internal analysis of the operations undertaken at Amorim Turismo’s restaurants in their three hotels in Portugal. A more in depth analysis can be made through the study and improvement of its operational efficiency and quality of service utilizing methodologies such as ABC Classification, inventory management, facility layout optimization, demand forecast and RFM model. Various recommendations are suggested as part of an improvement plan for a better performance of the company.
Keywords
Operations Management; Operational Efficiency; Quality of Service; Food and Beverage
Table of Contents
1. Current Situation Analysis ... 2
1.1 Tourism Industry ... 2
1.1.1 The Portuguese Tourism Industry ... 3
1.2 Company Background... 4
1.2.1 Strategy, Mission and Vision... 5
2. Thesis Framework ... 6
3. Strategic Fit ... 7
4. Operational Efficiency ... 10
4.1 Cost efficiency of Food and Beverage Items ... 10
4.2 Process Mapping and Inventory Management ... 12
4.3 Customer Profile and Demand Forecast ... 17
5. Quality of Service ... 21
5.1 Differentiation of Service and Customers ... 21
5.2 Quality Management ... 23
6. Conclusions, Recommendations and Limitations ... 25
1. Current Situation Analysis
1.1 Tourism Industry
According to the World Tourism Organization, the 1 billion international tourist arrival mark was exceeded in 2012 with 1,035 million overnight visitors worldwide in comparison to 995 million in 2011, representing a 4% growth despite the global economic conjuncture. The industry is divided into five geographical regions (Americas, Europe, Africa, Middle East and Asia and the Pacific), having Asia and the Pacific attained the strongest growth in 2012 with a 7% increase in tourist arrivals, representing 16 million additional arrivals, followed by Africa and the Americas with 6% and 5% respectively. In terms of international tourism receipts, expenditures by international inbound visitors, this value also achieved an increase of 4% in comparison to 2011, with China as the number one spender in international tourism. Europe continues to take the lead in relation to the number of international arrivals (see annex 1 for the Worldwide International Tourism Arrivals), being the most visited region in the world and accounting for 51,6% of global international arrivals.
Europe experienced in 2012 a growth of 18 million international tourist arrivals representing a 3% increase in relation to the previous year. This growth has proven to be sustainable over the course of history; in spite of the economic challenges the region faces, its arrivals rose by 6% from 2010 to 2011. Greatly contributing to this growth was Central and Eastern Europe which witnessed a growth of 7%, being the Russian Federation, Poland,1 Georgia and Azerbaijan mainly responsible for such increase. Western Europe saw a 3% increase in this category being the main contributors Germany and Austria. Southern Mediterranean Europe that had posted a growth of 8% from 2010 to 2011, returned to its modest growth rate having achieved a 2% rate in 2012. Croatia and Portugal led this increase, each with a 4% growth rate in terms of international tourist arrivals (World Tourism Organization, 2013).
1
The increase in Poland was mostly due to the UEFA European Football Championship hosted in 2012 by Poland and the Ukraine.
1.1.1 The Portuguese Tourism Industry
According to Eurostat, Portugal is the 12th country in the European Union with the most nights spent in hotels by residents in 2011, however this number showed a decrease from the previous year of 3,3%.2 With respect to total nights spent by non-residents, Portugal is featured as 9th in this same ranking. Note that contrarily to the trend of the Portuguese residents, this value increased by 9,7% in respect to 2010. In the total number of nights spent in hotels, Portugal occupies a position of 11th place in 2011 in the European Union (Eurostat, 2013) (See annex 2 for the complete rankings). Given its dimension and considering that the leading countries in this latter rank are France, Spain, Italy, Germany and the United Kingdom, this position is quite an accomplishment for this smaller nation.
Tourism has a great impact on the Portuguese economy, currently representing 6,4% of its Gross Domestic Product (Deloitte, 2012). It fosters the economy in several ways such as creating new employment (7,6% of the national employment is generated by tourism), contributing to economic growth and developing and socioeconomically integrating rural, peripheral or underdeveloped areas (Eurostat, 2012).
The Portuguese industry is extremely fragmented3 with a head count in 2012 of over 1.700 tourist enterprises.4 The increase of 200 units from the previous year emphasizes the augmented competition inherent in this sector. The group leader in this industry since 2007 is Pestana Hotels & Resorts/ Pousadas de Portugal, currently with 6.335 accommodation units.5 Followed by Vila Galé Hotéis with 3.800, Accor Hotels with 3.113, Tivoli Hotels & Resorts
2
Having in 2010 a value of 19.648.921 nights spent and in 2011 of 18.997.755. A night spent is each night a guest stays in a tourist accommodation.
3
Therefore companies experience a medium high threat of substitute products, a medium high bargaining power of suppliers and a high competitive rivalry (See annex 3 for Porter’s Five Forces Analysis).
4
Tourist enterprise: An establishment intended to provide accommodation services, provided monetary compensation, having, for functional purposes, an adequate array of structures, equipments and complementary services (Diário da República, 2009).
5
Accommodation unit: Limited space for the exclusive and private use of the tourist enterprise user, it can be a room, suite, apartment or villa depending on the type of tourist enterprise (Diário da República, 2009).
with 2.471 and VIP Hotels with 2.101 units.6 The industry continues to be characterized by segmentation, versus consolidation, as 61% of its tourist enterprises and 40% of its accommodation units are owned by individual entrepreneurs (Deloitte & Associados, 2013).
1.2 Company Background
Amorim Turismo was founded in 1997 as a subsidiary of the group Amorim Investimentos e Participações, S.G.P.S, S.A.7 Its parent company, Grupo Amorim dates back to 1870 with a small family business of cork production which later diversified its business vertically, horizontally and internationally. In 2005, Amorim Turismo received autonomy to operate in its sector.
Through a partnership with Accor Group, Amorim Turismo managed 33 hotels in Portugal, Cuba and Mozambique. This alliance was strategically significant as it allowed Amorim Turismo and Accor to implement in Portugal international urban and business hospitality concepts. 8 Having reached its objectives along those twenty years,9 both companies agreed to put end to the joint venture and follow their own paths.
Amorim Turismo’s portfolio in Portugal consists of three hotels in the resort and leisure residence segment, under the brand Blue&Green, named Vilalara Thalassa Resort, The Lake Spa Resort and Tróia Design Hotel (See annex 5 for the detailed information of each hotel).
Amorim Turismo also operates in other international markets as well as in other segments. Its presence in Africa resides in three hotels in Angola and one in Mozambique. The group
6
The industry is composed of 129 thousand accommodation units; therefore the market share of the leaders are as follows: Pestana Hotels & Resorts/Pousadas de Portugal: 5%, Vila Galé Hotéis: 3%, Accor Hotels: 2%, Tivoli Hotels & Resorts: 2%, VIP Hotels: 2% (Deloitte & Associados, 2013).
7 The companies adopt a portfolio manager parental model (see Annex 4), where the parent company intervenes and takes important strategic and investment decisions, where as the subsidiary company has managerial and operational autonomy (making decisions regarding operational efficiency and quality of service) (Goold et al, 1994).
8
As Accor Group is an international reference player, Amorim Turismo benefitted from this partnership as they attained international know-how and culture and experienced a learning curve; increasing their capabilities acquisition in terms of quality and service, allowing them to position themselves internationally and creating sustainable competitive advantages (Barney and Hesterly, 2006 - VRIO Framework).
9
manages five casinos, Casino do Estoril, Figueira da Foz, Póvoa do Varzim, Lisboa and more recently, Tróia, being the national leader in this sector.10
Recently the company has formed a partnership with Grupo Altis Hotels with the goal of expanding its offerings and creating commercial synergies in the marketing, promotional and sales processes. The main advantage of this partnership is the complementarity of its products and services, seeing as Grupo Altis is city-focused (with six hotels with unique characteristics and privileged location within the country’s capital) and Amorim Turismo is resort-oriented.11 The combined portfolio consists of nine hotels and attains global sales volume of 40€ million, securing the 9th position in the hotel ranking in Portugal. Furthermore, each company detains know-how in specific international markets which can facilitate and optimize future potential expansions (Grupo Amorim Turismo, 2013).
1.2.1 Strategy, Mission and Vision
Amorim Turismo’s stated strategy is that they aspire to grow to be within the leaders in the national tourism segment, although this is more a vision than a strategy itself. Their strategy incorporates tactics such as sustainable development and specialization in the luxury segment, consolidating the brand Blue&Green; and a strong emphasis in the training and motivation of its staff managers and excellence of its service offered (Grupo Amorim Turismo, 2013).
Their mission is to adequately reward their shareholders and employees, growing sustainably
and providing a service of excellence. Their vision is to be a reference group in the national tourism sector (Reis, 2012). A more complete vision should let us know where the company is heading in a more quantifiable manner. Therefore the vision I suggest to Amorim Turismo is
10
The investment in casinos allows for diversification as the company is investing in a new service in a new market (Ansoff Matrix) allowing for a lower competitive rivalry due to a lower threat of substitute products (Porter’s Five Forces); as well as cross-selling services and capabilities. In terms of international expansions, the company acquires experience and know-how for future growth.
11
There is no sales cannibalization due to their geographic location and there is consistency in the quality of their innovative and exclusive portfolio services offerings. The partnership aims for and demands a higher quality of service and operations management performance from both companies. Additionally, the portfolio manager model does not allow Amorim Turismo to benefit from synergies with other subsidiary companies, however, partnerships allow for this synergistic effect to occur.
that in 5 years they will be within the top 10 leaders in the industry in Portugal, being recognized by their clients for the delivery of a premium service.12
2. Thesis Framework
In order to strategically achieve an adequate return on investment, Amorim Turismo resides on three pillars. These are to increase the profitability of existing businesses, increase their efficiency and develop profitable new business (Reis, 2012). Dr. Alfredo Reis, the company’s Administrator, believes that in the current business environment we are facing, and specifically in Portugal, the consumer trend is to spend less on luxury goods (ie. hotels) and that the average price per room is also decreasing (Reis, 2013);13 therefore we can only increase the company’s profitability by decreasing its costs rather than increasing its revenues.This in turn is closely related to increasing the efficiency of the hotels, as in using fewer resources to attain greater outputs, we are becoming more efficient and incurring less costs.In alignment with the company’s mission, this cannot come at the cost of a deteriorated customer experience. Furthermore, an increase in hotel efficiency is forced by the enlargement of competition, price pressure and deteriorated margin in the hospitality industry (Deloitte & Associados, 2012).
However, the main indicators for the first semester of 2013 of hotels in Portugal registered positive growth in respect to the same period of the previous year. The Associação de Hotelaria de Portugal reported that although the average revenue per tourist decreased by 2,06%, the occupancy rate per room and the RevPAR (revenue per available room), in order words, average price per room, both increased. These values were of 3,04% and 4,02% respectively. The average daily rate, also known as, the average price per occupied room, also registered an increase of 0,94% in comparison to the first semester of 2012 (Associação da Hotelaria de Portugal, 2013).
12
Having by this date been successful in the consolidation of the Blue & Green brand. 13
This trend can perhaps be observed in the luxury hospitality segment which is becoming closer to the high end segment, highlighting the challenge of constantly offering high quality and value for money services.
Therefore, as Deloitte also defends, differentiation of the company’s products and services is the best bet to overcome and avoid direct price competition (Deloitte & Associados, 2012). Even if the industry RevPAR were to decrease, meaning that competitors were decreasing their prices per room, which is not the case, if Amorim Turismo’s offerings were highly differentiated, they could in fact increase their price.14 Evidently given that their differentiation positively impacts the perceived value by customers.
Consequently, the goal of this work project is to, on one hand, scrutinizingly analyze the internal processes15 of Amorim Turismo’s restaurants in Portugal with the objective of making them more efficient, specifically looking at the efficiency of their F&B offerings, their process mapping, inventory management and demand forecast. On the other hand, investigate in which ways the company can differentiate its offerings to increase its value proposition by identifying the customer profile, differentiating them and analyzing the company’s quality management. A Literature Review has been done and will be alluded to throughout the course of the work project.
3. Strategic Fit
We will begin our analysis by evaluating whether or not Amorim Turismo has strategic fit in order to have an overall perception of the company and its organization. This topic’s importance is highlighted in Grosse-Ruyken and Wagner’s investigation, where results showed that supply chain “fit” companies have a higher market capitalization, financially outperforming “misfit” companies. As operations management is a component of supply chain management, its alignment is equally relevant (Grosse-Ruyken and Wagner, 2010).
A company achieves strategic fit, when the strategies of its departments are aligned with the business strategy of the company. More specifically, as Chopra and Meindl defend, further
14 The company’s source of competitive advantage is based on differentiation; as Porter defends, differentiation decreases competitive rivalry and allows for a sustainable (Valuable, Rare, Inimitable and Organized) competitive advantage, in this case of quality of service and innovation (Porter, 1980).
15
developing Marshall Fisher’s 1997 Framework, strategic fit is having consistency between the customer priorities that the business strategy aims to satisfy and the capabilities that the supply chain strategy aims to build (Chopra and Meindl, 2006). A competitive priority is the way in which a company competes in the marketplace; of the following five (cost, time, innovation, quality and service), Amorim Turismo identified two that they apply special importance to, without ignoring the rest. The company wants its products and services to be known for their premium nature, but on the other hand, satisfying the needs of the target customers. In order words, quality and service are their priority.
The first step in achieving strategic fit is understanding the needs of the customer segment and what supply chain uncertainty this generates. In this case, customers are looking for high quality food accompanied by an outstanding service, both of which increase implied demand uncertainty. For example, for increased quality the company offers a greater range of options; consequently a wider range of choices creates a greater variance in demand. The following step is to assess the supply chain capabilities. Amorim Tursimo’s supply chain is responsive as it, among other aspects, is able to handle a high variety of products, meet a high service level and respond to wide ranges of quantity demanded. The final step is to match the level of implied uncertainty with the level of supply chain responsiveness. As the company faces a high implied uncertainty the most adequate supply chain is one that is highly responsive and thus we can conclude that the company is strategically fit.
To achieve complete strategic fit, the company must ensure that all other functional strategies, especially those which support the supply chain strategy (such as sourcing and operations), are not formulated in isolation and support each other and the ultimate goal of the company. The sourcing practices of Amorim Turismo allow for the achievement of a superior product quality as they involve the daily supply of fresh raw material. However, the company is not willing to pay whatever it takes to acquire the highest quality raw material and will in fact choose cheaper
alternatives. There are also operation practices that foster a higher raw material quality which include inspection points throughout the process. The strategy of each of the company’s departments (whether it is purchasing, finance or marketing) is to maximize their contribution through maximizing their revenues, minimizing their costs or increasing their cost efficiency.16 The practices observed throughout the supply chain align with the customer priorities and the functional strategies defined are aligned with the company’s pillars. However, the company should, in addition to their practices, be able to formulate a specific individual strategy for each department. An additional challenge to Amorim Turismo, which enforces the need for strategy formulation, is the potential barrier of an integrative view of the company, as the three hotels operate independently from one another. Information sharing between departments and between hotels and the coordination by executives is therefore essential.
As the customer priorities identified by the company are quality and service, giving more importance to quality, an operations strategy should be formulated to support such focus. The following is a recommendation for the company’s operational strategy:17 Purchase the necessary food and beverage items at competitive prices,18 in order to assure the quality of its final product; interview customers and ask for suggestions for improvement and have staff undergo training to better deliver the service; and adapt and innovate product offerings to current trends and seasonality.
Taking into account that customer needs, and therefore their perception of quality, are changing over time, the operational strategy as well as the business strategy and all other functional strategies should be continuously adapted to this change.
16
These strategies were formulated by the parent company; consequence of a portfolio manager model. 17
According to Jacobs, Chase and Aquilano, there are three pillars to a successful operations strategy; this includes operations effectiveness, customer management and product innovation (Chase et al, 2006).
18
4. Operational Efficiency
For each of the following sections an analysis of the topic at hand is carried out, followed by a discussion of the findings and subsequently improvement measures are proposed.
4.1 Cost efficiency of Food and Beverage Items
As approximately 30% of Amorim Turismo’s revenues come from their restaurants (Reis, 2013) and as a quantitative study19 conducted shows that customer loyalty in hotels is significantly influenced by a guest’s perception of the quality of the food in restaurants (Ramanathan, 2011), merely Amorim Turismo’s food and beverage items (from now on denoted as F&B) will be analyzed in this thesis.
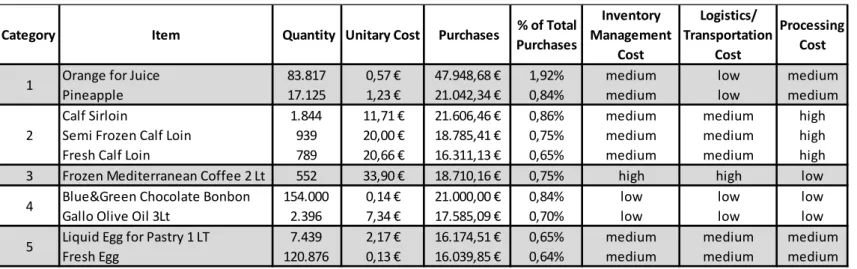
Currently the company’s operations involve over 1500 F&B items. Using an ABC classification and considering the annual cost of each of the 400 costliest items (See annex 6 for the complete table), we can narrow down our analysis to the items with a higher degree of importance. This classification follows the Pareto Law, meaning that approximately 20% of the company’s F&B items will account for around 80% of inventory value. According to Sanders, items that fall into the A classification are more valuable, in this case representing a higher cost for the company, and must therefore receive a tighter control (Sanders, 2012). The company should base their order policies and stocking decisions on such classification dealing with critical items more vigilantly. Additionally, the most sophisticated inventory management systems should be allocated to A items and have them be overseen by managers. The company should focus their efforts in the management of their A items, more specifically the top 10 F&B items that cost the most for the company. In order to improve the efficiency related with the management of these 10 items, the following are categorized below in terms of their 1a) inventory management cost, 1b) logistics/transportation cost and 1c) processing cost.
19
Regression based classification methodology of Hartline et al, using data from online customer ratings of 664 hotels in the UK (Ramanathan, 2011).
Category Item Quantity Unitary Cost Purchases % of Total Purchases Inventory Management Cost Logistics/ Transportation Cost Processing Cost
Orange for Juice 83.817 0,57 € 47.948,68 € 1,92% medium low medium
Pineapple 17.125 1,23 € 21.042,34 € 0,84% medium low medium
Calf Sirloin 1.844 11,71 € 21.606,46 € 0,86% medium medium high
Semi Frozen Calf Loin 939 20,00 € 18.785,41 € 0,75% medium medium high
Fresh Calf Loin 789 20,66 € 16.311,13 € 0,65% medium medium high
3 Frozen Mediterranean Coffee 2 Lt 552 33,90 € 18.710,16 € 0,75% high high low
Blue&Green Chocolate Bonbon 154.000 0,14 € 21.000,00 € 0,84% low low low
Gallo Olive Oil 3Lt 2.396 7,34 € 17.585,09 € 0,70% low low low
Liquid Egg for Pastry 1 LT 7.439 2,17 € 16.174,51 € 0,65% medium medium medium
Fresh Egg 120.876 0,13 € 16.039,85 € 0,64% medium medium medium
1
2
4 5
Table 1 – Categorization of Amorim Turismo’s Critical F&B Items (2012)
Items with similar costs are grouped together forming 5 categories. In order to increase the management efficiency of these critical items the following suggestions are proposed. For items with high 1a) inventory management costs (frozen Mediterranean coffee), order policies should be revised with the objective of receiving less quantity more frequently, lowering inventory costs as the company will hold less inventory at each point in time. The reverse logic is applied for items with high 1b) transportation costs; these should be delivered less often and in greater quantities in order to minimize the number of deliveries. The frozen Mediterranean coffee falls under both categories, therefore an economic order quantity, one which minimizes holding (or inventory) costs and ordering (or transportation) costs, should be calculated in order to find the optimal order quantity and the reorder point.20
According to Little’s Law21
the goal is to have as little work-in-process (or intermediate) inventory as possible in order to increase throughput time; however, for items with high 1c) processing costs we can assume that the level of intermediate inventory increases due to the increase in the complexity of tasks. With the increase in complexity, the throughput rate
20
The reorder point is the point at which a new order should be made, in order words, sufficient inventory to cover demand during lead time. Lead time is the amount of time between making an order and receiving the goods. (Sanders, 2012).
21Little’s Law studies the relationship between throughput time, throughput rate and the amount of work-in-process inventory in the following formula: . “The throughput rate is the output rate that the process is expected to produce over a period of time”; Throughput time is the period between an item entering and exiting the process (Chase et al, 2006).
decreases and the throughput time increases as it takes longer to perform tasks. A recommendation would be for the company to reduce throughput time. This can be achieved by decreasing the work content of activities that have the longest duration either by working smarter as a result of investment in employee training, by working longer and taking advantage of the experience curve or by investing in technologically advanced machinery (for example, meat processing machines). The throughput time can also be decreased through the reduction of waiting times within the process and through outsourcing of non-critical activities (for example, the meat could come from suppliers already cut). Nevertheless, in the case of items with high processing costs, Amorim Turismo should transfer some of this cost to customers, by increasing the product’s sale price, as retribution to the added value activities.
Furthermore, another perspective to take into consideration is sales revenue as the previous analysis was solely focused on cost. The dishes with the highest demand at each of the three hotels should also be a priority for the company allowing for an analysis of the customers’ perspective; a potential source of diversification.
4.2 Process Mapping and Inventory Management
In this section we will analyze the process map and inventory management of the main dish at each of the three hotels as a mean of giving importance to customer preferences; firstly, in terms of 2a) critical activities, 2b) capacity and 2c) integrative mindset, and secondly referring to 3a) the responsiveness and efficiency equilibrium, 3b) the inventory system type, and 3c) facility layout; its conclusions and recommendations will be applied to the rest of the F&B items. The dishes that were chosen were those most requested by guests, therefore the plate with the greatest demand and production. At Vilalara Thalassa Resort lobster with ravioli was selected, at The Lake Spa Resort the Italian barbeque was chosen and at Tróia Design Hotel razor clam rice. The following three process maps, elaborated from a visit to the
hotels, represent the process mapping of each of the three dishes respectively (See annex 7 for the explanation of each symbol and the general process map of each hotel).
Figure 1 - Process Map of lobster with ravioli at Vilalara Thalassa Resort
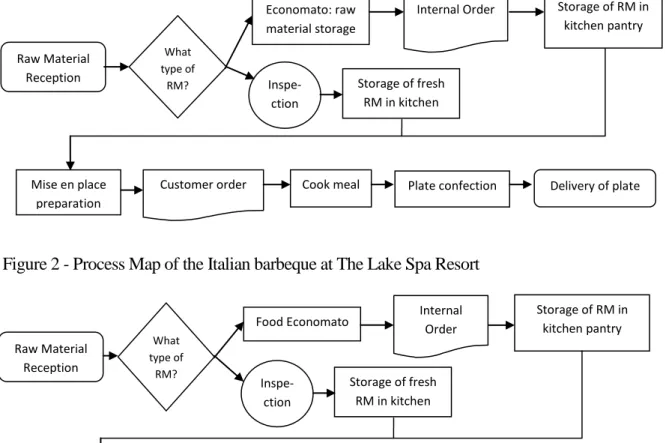
Figure 2 - Process Map of the Italian barbeque at The Lake Spa Resort
Figure 3 - Process Map of the razor clam rice at Tróia Design Hotel
The most 2a) critical stage in all three processes is cooking the meal as it is in this moment that the kitchen receives a customer order and must deliver it to the customer assuring the F&B item’s quality in the shortest amount of time. Other critical stages to point out are the inspection
Raw Material Reception Economato: raw material storage Storage of RM in kitchen pantry What type of RM? Storage of fresh RM in kitchen Inspe-ction Mise en place preparation
Customer order Cook meal Plate confection Delivery of plate Internal Order Raw Material Reception Storage of RM in kitchen pantry What type of RM? Storage of fresh RM in kitchen Inspe-ction Mise en place
preparation Cook meals Tray confection Buffet set-up Internal Order Food Economato Raw Material Reception What type of RM? Storage of RM in pantry of respective points of sale Inspe-ction Mise en place preparation
Customer order Cook meal Plate confection Delivery of plate Internal
points and the mise en place22 preparation both of which will allow the final product to be delivered with the highest level of quality.
The 2b) capacity of each individual stage was not calculated, however, none are being used at its full capacity, therefore assuming none are a constraint and are thus not limiting the throughput rate. If the system had no constraints then two assumptions could be made, firstly the customer service would be immediate, there would be no lead time between order and reception, and secondly if demand were to be increased the process would be able to support this positive variation. As the theory of constraints states, “every system has one or more limiting factors that is preventing it from further achieving its goal” (Sanders, 2012). However, the constraint can be the external marketplace (ie. demand), where production capacity exceeds sales, which is the case. Moreover, the reason why the service is not immediate has to do with the customer priority the company is trying to focus on; the quality of its products. In order for the service to be immediate, meals would have to be make-to-stock and this would heavily harm its quality. Regarding the second assumption, a more in-depth analysis would have to be made considering additional factors such as the number of seats at the restaurant, the number of waiters, the number of kitchen staff, the number of stoves, among others, evaluating their process time.23
As observed above, each hotel functions independently from one another without being aware of the processes undertaken at the remaining two. The process map, in addition to various other aspects, such as the autonomy of each purchasing department, the establishment of the menu and the concepts of the restaurants, should be more uniform between the three hotels in order to allow the company to take advantage of synergies and economies of scale but also to consolidate the B&G brand. On one hand, each hotel serves a different customer base and
22
Definition of mise en place: organizing and preparing ingredients (such as cutting meat, preparing sauces and chopping vegetables) that will later be required for the cooking and confection of the menu items.
23
The process time of a station is “the time to produce a given number of units at that workstation.” (Heizer and Render, 2011).
should thus adapt to fulfill specific needs, whilst, on the other hand, being able to sustain a unified corporate image. Additionally, by adopting a more 2c) integrative mindset, the company can internally share and benchmark its best practices.
When analyzing Amorim Turismo in terms of its inventory management, the following inventory can be named: raw materials, intermediate products and finished products. In terms of the tradeoff between 3a) responsiveness and efficiency, this can be considered for each of the first two types of inventory. The raw materials, which are ordered from suppliers, could be ordered at a lower cost if the order was done in a larger quantity due to potential quantity discounts, lowering Amorim Turismo’s ordering costs. However, as the company’s competitive priority is quality, ordering large quantities of, for example, fresh meat and later freezing it would not allow them to sustain the quality standard they are striving for. A similar logic can be applied to the mise en place (intermediate product); although their validity is superior, Amorim Turismo wants them to be consumed within the maximum of three days from its production date. Thus, on one hand, Amorim Turismo carries inventory in order to protect themselves against demand uncertainty and production lead time, while, on the other hand, minimizing this quantity in order to prevent quality deterioration. As this quantity is small, Amorim Turismo does not allow itself to benefit from other advantages that carrying inventory would enable, such as protection against uncertainty of price increase, seeing as fruits and vegetables are seasonal and their price varies along the year, and economic purchase order size. Regarding its inventory costs, as Amorim Turismo’s priority is quality they store a limited amount of inventory, resulting in a minimization of this cost.
The 3b) inventory system adopted by Amorim Turismo is the fixed time period system, where a daily forecast is done for the following day and the order sent to suppliers. The quantity to be delivered is the difference between their target inventory level and the amount in stock. Due to
Distance (km) 1,20
Average Number of Trips per day 8,00
Van Fuel Consumption (liters/100 kms) 7,00
Diesel Fuel Consumption (liters) 0,08
Diesel Price (€/liter) 1,43¹
Gas Cost Reduction per trip (€) 0,12
Gas Cost Reduction per year (€) 349,69
Van speed (km/hour) 15,00
Idle Time Reduction per trip (hours) 0,15 Idle Time Reduction per month (hours) 36,37
Employee Pay (€/hour) 5,67
Employee Cost Reduction per year(€) 2.473,83 Van Maintenance + Insurance per year (€) 794,27² Total Yearly Cost Reduction (€) 3.617,79
Van Selling Price (€) 3.150,00²
the perishability of its goods, the company adopts a First In First Out method where products are consumed in the same order as they arrived at the facilities.
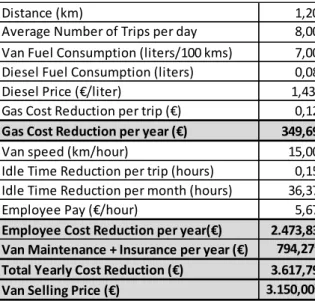
“Layout decisions entail determining the placement of departments, work groups with the departments, workstations, machines, and stock-holding points within a production facility. The objective is to arrange these elements in a way that ensures a smooth work flow” (Jacob et al, 2009). Consequently, distance is a critical factor that contributes to the decision of the 3c) facility layout and Vilalara could improve in this manner. The Economato, where the reception and storage of raw materials takes place, is significantly distant from the hotel’s kitchens and pantries forcing the transportation of goods to be done via a company van. In order to reduce waste, such as fuel, idle time and employee movement the Economato at Vilalara should be moved closer if not to the actual location of the kitchen. This improvement is incremental as its cost reduction is minimal in comparison to the total costs of the hotel. A quantification of the yearly cost reduction (3.618€) and the current valuation (3.150€) of the company van are shown in the table below.
Table 2 - Facility Location Cost Reduction
4.3 Customer Profile and Demand Forecast
The importance of identifying the customer profile is critical for any business sector; as identified by Customer Relationship Management studies, it is costly to acquire new customers, hence companies should focus instead on retaining the ones they have, most importantly the 20% that make up 80% of their business (Peppers and Rogers, 2011). Consequently, in order for Amorim Turismo to retain customers, it must be able to identify them and their specific needs in order to adapt and differentiate its product to satisfy them (See Annex 8 for the 2012 Customer Profile).
Additionally, knowing our customer profile can help us forecast demand and customer behavior. This becomes significant in businesses as we use demand forecasts to eliminate waste in transformational processes. In this specific case, this issue becomes even more critical as most F&B items are perishable goods; therefore their consumption is punctual as the sale of an item after it has been in stock for a certain period of time is not permitted (Jacob et al, 2009) and thus results in a greater amount of waste and consequently cost.
Even more so, Amorim Turismo’s restaurants function under both a push and a pull production. A push production is such based on the demand forecast (Sanders, 2012) and is thus production prior to a customer order, stored in anticipation of demand. F&B items that fall under this category include the Blue&Green Chocolate, Medittereanean coffee, buffets, the soup of the day, rice, pasta, cooked vegetables and the daily mise en place. Contrastingly, a pull production is based on actual or consumed demand (Jacob et al, 2009), in other words, production made once an order has been fulfilled. The cooking and confection of the mise en
place fall under this category. The process strategy that the company adopts for each of the two
items also differs, when relating to push items the company utilizes a make-to-stock strategy where the product is entirely manufactured prior to receiving an order. In contrast, a pull
production is assemble-to-order, where the chefs build modules prior to receiving an order and assemble the plate once an order has been received.
The importance of a demand forecast is highlighted in the production of those products that are in the push category, as a gap in the actual demand versus forecasted demand leads to an accumulation of waste and inefficiency.
Currently, Amorim Turismo does not have a valid key performance indicator to specify what percentage of its clients utilizes its restaurants, which means they are not measuring the utilization rate of each one the process stages. This indicator could come at great hand as it could be used to forecast the demand of their eating facilities and to support quality management of each hotel. However, the company faces difficulties in such, as a client that orders a coffee at the bar is registered as a consumer equal to a client having a full meal at their restaurant. Hence the objective is to be able to distinguish these types of clients.
The chefs of the respective restaurants have access to a software that specifies the amount of guests staying at the hotel the following day. It is of the responsibility of the chef to make an estimate of how many meals he will have to prepare the following day and order raw materials respectively. Additionally, the mornings are reserved for the preparation of the mise en place for lunch and the afternoons for that of dinner, being its production once again based on the estimate of the chef. For example, at Vilalara Thalassa Resort, the chef’s estimate is that 50% of the hotel guests will eat at the restaurants, incrementing a 10% margin of error in order not to incur understocks. This estimate is based on his experience of being the hotel’s chef for the past three years.
If demand were to be significantly well forecasted the company would not witness a lot of waste of overproduction. There are two physical waste categories in these restaurants, the first is products that have expired or become rotten and cannot be consumed, for example ham and
cheese, and the second is finished or intermediate products that have been prepared or cooked and were not sold, for example soup, rice, pasta and all the items in the mise en place. The first category of waste is immediately disposed of and recorded as a write-off in the company’s operational system, composing of 1% of the Amorim Turismo’s revenue volume. The second category, as the hotels, in addition to their restaurants, have an employee canteen, is transferred to the canteen for employee meals and registered as a personnel cost. However, this is not desirable as the F&B items consumed in the restaurants are of a higher quality, and therefore price, than those in the canteen. Additionally, a transfer of costs is simply hiding inefficiency and not getting rid of it.
In order to reduce the waste at the restaurants, the company should adopt a mathematical model to forecast its demand with the aim of implementing a better inventory management and production scheduling. As the company has quantitative historical data available, a quantitative method should be used, being this method objective and consistent. Additionally, since the demand of its restaurants is seasonal and depends on several factors, a quantitative method is also beneficial as it allows for the consideration of many variable and complex relationships between them. Regarding quantitative methods, there are time series models where the future level of demand is a function of time, and causal models where the future level of demand is a function of other variables. Both models are applicable to this case, being a time series model easier and quicker to compute and often just as accurate. In a three period simple moving average time series model adjusted to seasonality, the forecast of each month is computed based on the arithmetic average of the same month in the previous three years. Ideally, the demand would be forecasted for the restaurants, but due to a scarcity of available data, the following table shows the hotel’s demand forecast for June, July and August of this year with their corresponding forecast error.
Table 3 – Hotel’s Demand Forecast for June, July and August 2013
Actual Demand Forecasted Demand Actual Demand Forecast Error
Month 2010 2011 2012 2013 2013 2013
June 107 132 132 124 154 30
July 83 125 168 125 173 48
August 132 198 195 175 193 18
If a causal model were to be used, a multiple regression would have to be made where the relationship between the dependent variable and the independent variables is studied. In interview with hotel restaurant guests, a list of independent variables was developed. Factors that influence the demand of hotel restaurants include the month of the year, weekdays versus weekends, the daily weather (more guests will eat in if it is raining), the promotional actions of employees, the guest’s nationality (for example, English people tend to eat in more often), how many nights the guest will stay at the hotel (if multiple nights then guest will probably not eat in everyday), guest’s age (elder people tend to eat in more often) and the existence of events outside the hotel (guests will eat out to attend the event) (Hotel and Restaurant Guests, 2013). Although age is a significant variable, the hotel does not find it a relevant variable to analyze using the QlikView tool.24
These recommendations are for the F&B items whose production falls under the push category with the goal of translating the forecast in demand into demand planning (selecting actions in anticipation of demand). Additionally, the demand forecast should be periodically checked for continual improvement. The forecast error is the gap between actual demand and forecasted demand. Ideally, this value should be as close to zero as possible. If this error is greater than desired, the forecast would have to be adjusted and the error recalculated.
24
5. Quality of Service
5.1 Differentiation of Service and Customers
Amorim Turismo competes based on the maximization of returns; this, in turn, takes into consideration price, demand, sales volume, profit margin and productivity. Its physical offer (an overnight stay) is identical to that of its competitors, hence the company also competes in trying to make the customer experience, as a whole, unique via differentiation of its service. As Jorge Marrão, a partner at Deloitte, would agree, differentiation and innovation in the approach to the market can also minimize the exhaustive price pressure that exists in the hospitality industry (Deloitte & Associados, 2012). In order for a company to differentiate its services, it must first identify its customers, segmenting them and choosing the right target, and subsequently adapt to their needs to extract more value from them.
A company can only increase customers’ value if they understand the value of an individual customer in comparison to the rest and allocate its resources effectively to better serve its most valuable customers (Peppers and Rogers, 2011). The ideal would be to calculate the life time value (LTV) of each customer and rank them from highest to lowest in order to identify those that are of most value. The LTV of a customer is “the net present value of the expected future stream of financial contributions from the customer” (Peppers and Rogers, 2011) and can be difficult and costly to quantify. Consequently, the proxy variable RFM (recency, frequency and
monetary value)25 is used to represent the customer’s value. A major obstacle that most companies, such as Coca-Cola, have is that they do not posses information about their customer base. In the case of Amorim Turismo, this is possible due to check-ins and the company should take full advantage of such privileged information. Therefore with the use of the company’s information technology system the following RFM analysis was done.
25
Recency: date of customer’s most recent transaction; Frequency: how often this customer has bought in the past;
Table 4 – RFM model
Recency Frequency Monetary Value Segment
Last Month > 4 > 800€ ≤ 800€ 1 2 ≤ 3 > 600€ 3 ≤ 600€ 4 Last 6 Months > 12 > 2.400€ 5 ≤ 2.400€ 6 ≤ 11 > 2.200€ 7 ≤ 2.200€ 8 Last Year > 13 > 2.600€ 9 ≤ 2.600€ 10 ≤ 12 > 2.400€ 11 ≤ 2.400€ 12
With the appropriate information extraction, which was not possible in development of this thesis, the company can segment its customers in relation to the value they represent for the company. The most valuable segment for the company is Segment 1, where customers have recently, and with a high frequency, stayed at the hotel and spent a high monetary value. The remaining order of importance will depend on the company’s priorities, if they want loyal and frequent customers or those who spend more money with the company. Nevertheless, it can be concluded that segments further down the rank (such as 10 to 12) are less valuable segments and as a result, company resources should not be allocated to such. An additional benefit from this type of segmentation is that through this Amorim Turismo is well aware of the demographics that compose their most valuable customer segments. Therefore, investments in customer acquisition, such as promotional efforts and actions, can be reduced as the company will only try to “get” and “keep” customers with those specific demographical characteristics.
We can conclude from the analysis of the above tool that different customers have different values to the company, however, in addition, customers have different needs from the company. The objective of Amorim Turismo should be to create a learning relationship with their most valuable customers, with the aim of learning from the customer what he or she wants and being able to tailor its response to those preferences. The outcome of such
relationship is that it becomes more worthwhile for the customer to remain loyal to that company than to switch to its competitor. As Barnes defends, this loyalty should be emotionally driven opposed to being functionally driven, as emotionally loyal customers are less vulnerable and consequently less likely to switch to a competitor.26 Through this relationship, we are additionally postponing short term gains (current profit), for example by offering discounts, to increase long term gains (client remains a customer for a longer period of time and makes referrals). This will, in the long term, increase the customer value and consequently company profits.
Other CRM initiatives that the company can undertake to differentiate its service offerings include analyzing customers’ past purchase patterns and preferences to predict and anticipate their future needs; invest in resources to reward customers (for example, through customization of loyalty programs - understand what they value the most and offer good deals and promotions on products and services they value through partnerships with other companies); and taking advantage of community knowledge (for example, if many people in one segment have a certain preference, ie. for a certain dish, the company should offer this product to other customers in the same segment).
5.2 Quality Management
As quality is Amorim Turismo’s competitive priority, quality management should be a topic of extreme priority for the company. Total quality management is “managing the entire organization so that it excels on all dimensions of products and services that are important to the customer” (Jacob et al, 2009). At the hotels in the Algarve, when fresh raw materials (fresh meat, fish, vegetables and fruit) are received in the kitchen, before they are stored in their respective storage areas (refrigerators and freezers), they undergo an inspection. This
26
Emotional loyalty: A customer that feels an attachment to the firm that transcends functional attributes; Functional loyalty: Loyalty based on functional attributes (Barnes, 2006).
inspection has two main goals; the cleansing of the raw materials and the certification of the quality required from the supplier. Another certification of quality is for example the organization of storage spaces. Even after the cleansing process, the kitchen staff has the caution to place “less clean” raw materials (e.g. tubers) in bottom shelves to eliminate the probability of contamination. Other previously mentioned measures include the daily delivery of fresh raw materials from suppliers and the consumption of intermediate products, such as the mise en place, within three days of production, although its validity is superior to that.
Joseph Juran defines quality as the “fitness for use”, in other words, whether the customer needs are being satisfied (Jacob et al, 2009). Consequently, Amorim Turismo must have effective measures to evaluate customer satisfaction. Approximately two weeks after the guest has stayed at the hotel, they receive an online questionnaire to evaluate their satisfaction. Over 35% of clients respond to this questionnaire and between 85% and 90% are satisfied with the service.27 Therefore, we can conclude that the hotel, given Juran’s definition, has a good quality. However, the questionnaire does not include questions relating to the customer’s experience at the hotel’s restaurants and therefore in this context, the restaurant’s quality cannot be assessed.
A dimension of quality management is the elimination of waste; this waste can come in many forms.28 In other sections, including that of facility location, suggestions for waste reduction have been made, however, in this section, the focus will be in bar code technology. At the company’s Economatos, inventory management is kept track of manually using a clipboard at the entrance of the room, this problem is more evident at The Lake Spa Resort. Therefore as chefs seize raw materials from shelves, they register the amounts on the clipboard of the respective Economato. It is of the responsibility of the Purchasing Director to upload these
27
Internal questionnaire used by the company. 28
Waste of overproduction, waste of waiting time, processing waste (useless operations and paperwork), inventory waste, waste of motion (human movements), waste from product defects, waste of human capabilities (products nobody wants and lost opportunities) and waste of transportation (Heizer and Render, 2011).
“consumptions” on the company’s purchasing and inventory management system called Micros Materials Control. However, this registration is not done on a daily basis and thus the inventory management is not constantly accurate. A suggestion would be to invest in bar code technology which consists of the bar code of raw materials being scanned as they are received by the company and automatically being recorded in Amorim Turismo’s information system. Additionally, as this tool manages inventory quantities, orders of raw materials from suppliers could be automated taking into consideration the fixed time period method. No manual information insertion would have to be made, reducing processing waste and waste of motion. This recommendation is specifically useful for items in the B and C of the ABC classification as these do not warrant the cost of managerial involvement. Currently, Amorim Turismo’s Materials Control provider, Micros Fidelio, does not offer such technology; however, a Mobile Solution additive has been developed which would similarly eliminate manual work and automatically update information to the Materials Control system (Micros Fidelio, 2013).
6. Conclusions, Recommendations and Limitations
The following issue tree culminates the thesis, as it is a wrap-up combining the root causes of the research question and identifying its potential solutions and recommendations, and respective applied methodologies.
In addition to adopting these methodologies, Amorim Turismo should incorporate Key Performance Indicators to evaluate them. These should include the return on investment of each of the recommendations; to do so their implementation period and impact, as well as their incremental costs and revenues need to be measured.
The criticality of the methods can be summarized in last column of the above tree, where impact is the most decisive aspect, followed by the implementation period and subsequently the key stakeholders involved. Therefore, the most critical methodologies are the ones relating to strategic fit, followed by differentiation of service and customers and quality management. The subsequent important methodologies are those of food and beverage items, process mapping and inventory management and lastly customer profile and demand forecast.
Finally, there are several limitations to this work project that could have been surpassed had the opportunity existed allowing for further analysis and complementary paths. These include the limited access to information provided by the company and the limited amount of time and scope of the work project.
Operational Efficiency Quality of Service How to increase Amorim Turismo’s operational efficiency and quality of service regarding its food and beverage Strategic Fit Food and Beverage Items Process Mapping and Inventory Management Customer Profile and Demand Forecast Differentiation of Service and Customers Quality Management
Formulation of functional strategies
Information sharing and executive coordination Continuous revision and adaptation of strategies ABC Classification with tighter control Reducing inventory management cost,
logistics/transportation cost and processing cost
Uniformity of three hotels Redesign of facility layout
Demand forecast model
Periodical evaluation of forecast error
Customer segmentation via RFM proxy variable Targeted investment in customer acquisition Creation of learning relationship
Improvement of customer questionnaire Investment in bar code technology
Recommendation and Methodology
Research Question Root Causes Implementation Period/ Impact
/Key Stakeholders Involved Long implementation period; high impact; shareholders
Medium implementation period; high impact; employees
Short implementation period; medium impact; employees
Short implementation period; medium impact; employees
Medium implementation period; high impact; employees and customers
Medium implementation period; high impact; employees and customers
7. Bibliography
Associação da Hotelaria de Portugal. (2013). Sintese Indicadores de Junho 2013. Available: http://www.ahp-monitor.pt/?mod=news&data=read.obj&aid=224. Last accessed 10th Oct 2013.
Barnes, James G. (2006). Build Your Customer Strategy. New Jersey: John Wiley & Sons, Inc.
Barney, J. and Hesterly, W. (2006). Strategic Management and Competitive Advantage: Concepts. New Jersey: Pearson Education, Inc.
Chase, R., Jacobs, F. and Aquilano, N. (2006). Operations Management for Competitive Advantage. New York: McGraw-Hill/Irwin.
Chopra, S. and Meindl, P. (2006). Supply Chain Management: Strategy, Planning, and Operation. New Jersey: Prentice-Hall.
Deloitte. (2012). Tourism, Hospitality & Leisure: Facts & Figures. Available:
http://www.deloitte.com/view/pt_PT/pt/industrias/tourism-hospitality-leisure/facts-figures/index.htm. Last accessed 15th Oct 2013.
Deloitte & Associados. (2012). Atlas da Hotelaria 2012. Available:
http://www.deloitte.com/view/pt_PT/pt/servicos/consulting/d9c8a7eb5b848310VgnVCM1000001956f00aRCR D.htm. Last accessed 18th Oct 2013.
Deloitte & Associados. (2013). Atlas da Hotelaria 2013. Available:
http://www.deloitte.com/view/pt_PT/pt/industrias/tourism-hospitality-leisure/fa9d1f6a091ef310VgnVCM3000003456f70aRCRD.htm. Last accessed 15th Oct 2013. Diário da República. (2009). Ministério da Economia e da Inovação. Available:
http://www.turismodoalgarve.pt/ficheirosSite/106/106_0_decreto_lei2282009de14set.pdf. Last accessed 18th Nov 2013.
Eurostat. (2012). Tourism. Available: http://epp.eurostat.ec.europa.eu/portal/page/portal/tourism/introduction. Last accessed 13th Oct 2013.
Eurostat. (2013). Nights Spent at Tourist Accommodation Establishments by NUTS 2 Regions. Available: http://appsso.eurostat.ec.europa.eu/nui/submitViewTableAction.do;jsessionid=9ea7d07d30e8c52aad14edc443a7 b661cdbf693d89db.e34OaN8PchaTby0Lc3aNchuMc3iTe0. Last accessed 27th Sept 2013.
Goold, M., Campbell, A. and Alexander, M. (1994). Corporate-Level Strategy: Creating Value in the
Multibusiness Company. New Jersey: John Wiley & Sons, Inc.
Grosse-Ruyken, P. and Wagner, S. (2010). Does Supply Chain "Fit" Matter to Investors?. CSCMP’s Supply
Chain Quarterly.
Grupo Amorim Turismo. (2013). Quem somos. Available:
http://www.amorimturismo.pt/amorim_quemsomos.php. Last accessed 23rd Sept 2013. Heizer, J. and Render, B (2011). Operations Management. New Jersey: Pearson Education, Inc. Hotel and Restaurant Guests. (2013). Interviewed by Mafalda Guimarães. Nov 2013.
Jacob, F., Chase, R. and Aquilano, N (2009). Operations and Supply Management. New York: McGraw-Hill/Irwin.
Micros Fidelio. (2013). Materials Control - Mobile Solutions.
Peppers, D. and Rogers, M (2011). Managing Customer Relationships. New Jersey: John Wiley & Sons, Inc. Porter, Michael. (1980). Competitive Strategy: Techniques for Analyzing Industries and Competitors. New York: Free Press.
Ramanathan, U. and Ramanathan, R. (2011). Guests' Perceptions on Factors Influencing Customer Loyalty. International Journal of Contemporary Hospitality Management. Vol 23.
Reis, Alfredo. (2012). Amorim Turismo. Grupo Amorim Turismo. Reis, Alfredo. (2013). Interviewed by Mafalda Guimarães. Oct 2013.
Sanders, Nada R (2012). Supply Chain Management: A Global Perspective. New Jersey: John Wiley & Sons, Inc.