BJRS
07-01A (2019) 01-10ISSN: 2319-0612 Accepted 2018-05-07
Study of dosimetry in CT using head phantom
A.M.L. Gómez
a; A.P. Mourão
a, ba
Department of Nuclear Engineering, UFMG, 31270-901 Belo Horizonte, MG, Brazil
b
Biomedical Engineering Center, CEFET-MG, 30480-000 Belo Horizonte, MG, Brazil [email protected]
ABSTRACT
Non-invasive diagnosis methods based on x-ray attenuation, such as Computed Tomography (CT) has had since its discovery and the development of this technology, a rapid growth in radiology services. The quantity of dose depos-ited in patients, is still large, this type of examination is that reaches the highest levels of absorbed dose in the popu-lation. Legislation that regulates the levels of patient’s dose is only limited to a maximum amount deposited, depend-ing the body region to be irradiated. Therefore, it is necessary to determine the amount of absorbed dose on patients depending on the protocols of routine used in radiology services for propose an optimization of these based on the principles of radiation protection. Experiments were conducted to determine the profile of dose deposited in head routine exams for adult, using a cylindrical head phantom made of polymethylmethacrylate (PMMA). This standard phantom has four openings in peripheral and one central. Radiochromic film strips were introduced into each one of these openings to register the longitudinal dose profile in each region to determine the amount of deposited dose in the volume of the head phantom. A CT scanner with 64 channels of GE from the radiology department was used for scanning the head phantom. The scanning were done with voltages of 80, 100 and 120 kV, and dose index found were between 6.24 and 23.73 mGy. Analysis of image quality was performed, finding that all scan comply with the parameters acceptable in diagnosis for Brazilian legislation. It is propose an optimized protocol for exams by CT head for the voltage of 80 kV and images with 0.5% of noise index.
1. INTRODUCTION
The processes of medical imaging are used in the diagnosis of the development of different lines of research in areas such as engineering, science and medicine, in order to obtain detailed infor-mation of the different tissues, organs and physiological processes present in the human body through various techniques (Dhawan, 2011). The developments of non-invasive techniques for the detection of different types of diseases, among them are X-ray attenuation techniques.
The protocols on which they are based, as a result of a series of investigations in which it is sought to maintain the improvement of the image quality in order to reduce the risks to the health of patients and workers exposed to ionizing radiation. Therefore, analyses of mass, volume, de-posited dose and contrast of the acquired image are factors of great importance in the process of diagnostic optimization using protocols for obtain images with quality (Dalmazo, 2010).
The adoption of computed systems allowed a significant advance in the quality of the diagnosis processes by images, and thus, increasing the diagnostic applications. However, these principles in technology have brought with them new challenges in relation to the validation of the image acquisition processes (Andisco, et al, 2014). Computed Tomography (CT) uses the principle of X-ray attenuation for the acquisition of diagnostic images. Since its discovery in the 1970s, it has become one of the most important methods of diagnostic imaging, since it allows the observation of structures of low contrast, like soft tissues (Biester, et al., 2012; Andrade, 2008; Calzado et
al., 2010).
The development of technologies associated with CT scanners which allows a greater speed of data acquisition, greater efficiency and precision in the representation of structures, bring with them an increase in the risks for the individuals exposed to this examination. CT test is the radio diagnostic exam was responsible for being the largest contributor in doses in the population compared to the other existing techniques (Augusto, 2009).
2.
MATERIALS AND METHODS
2.1.CT scanner
The CT scan of radiodiagnostic services was used in an institution with an agreement for the development of research, in the city of Belo Horizonte (MG-BR). The scanner is of multi-slice type that allows realizing explorations in helical mode.
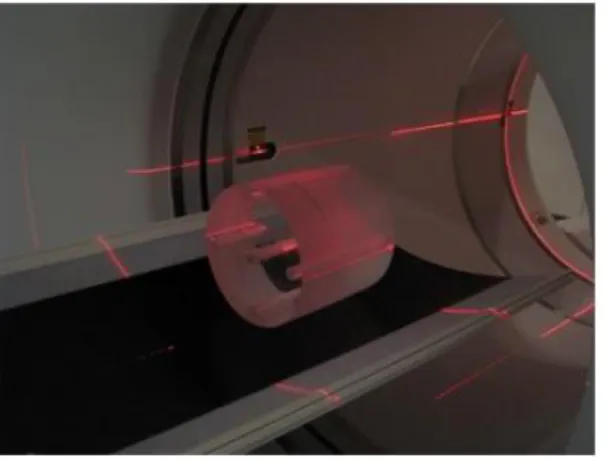
The experiments were performed on a head phantom in cylindrical shape of 16 cm in diameter and 15 cm in length, made of polymethylmethacrylate (PMMA). The cylinder has five openings, four at the periphery which are offset from one another by 90°, and one central. The openings are 1.25 cm in diameter and 15 cm in length. The center of the peripheral openings is 1 cm from the surface. The head phantom was placed in the isocenter of the gantry aligning the openings simi-larly as the positions 3, 6, 9 and 12 of an analog clock, through the help of the equipment posi-tioning lasers. The Figure 1 shows the head phantom placed in the isocenter of the gantry of the CT scanner.
Figure 1. Phantom head in the isocenter gantry.
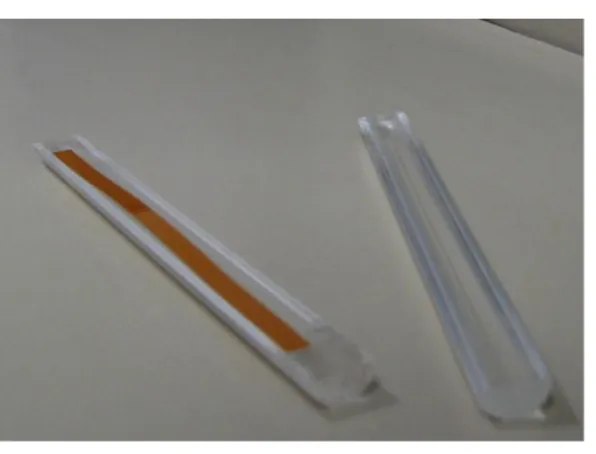
Dose measurements were performed using the GAFCRHOMIC XR-QA2 radiochromic film. The film leave was cut in strips measuring 0.5 x 12.5 cm and placed into special rods, also made of
one of the radiochromic film strip.
Figure 2. Rod charged with radiochromic film strip.
A RADCAL ACCU-GOLD, 10X6-3CT pencil ionization chamber with a range detection from 200 nGy to 1 kGy was used to obtain the dose deposited on the head phantom. This chamber has 4% uncertainty for X-rays generated with voltages up to 150 kV (Radcal, 2015).
2.2.Methodology
The protocols used in helical mode scans are described in the Table 1.
Table 1. Acquisition Protocols.
Voltage (kV) Charge (mA.s) Beam thickness (mm) Pitch 80 100 40 0.984 100 120
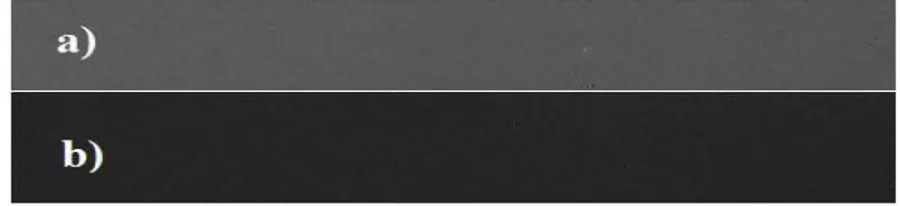
The rods loaded with the radiochromic film strips were positioned inside the head phantom to make a scan of 10 cm in length in its central region programming the equipment in helical mode. The strips present a darkening proportional to the amount of energy deposited when exposed to radiation (Tawfik, 2012). Figure 3 shows a non-irradiated strip (a) and a radiated strip (b) digit-ized and processed in grayscale.
Figure 3. Radiochromic film strip non-irradiated (a) and irradiated (b).
After the exposition, the strips were digitized and processed to obtain the darkening intensity val-ues and then, these valval-ues were converted to dose valval-ues in mGy. The dose valval-ues were correct-ed considering the coefficients of linear attenuation for X-rays with energies of 50, 60 and 80 keV (NIST, 2015). For the analysis and validation of the image quality, the image of the central slice was selected in order to study the interference of the secondary radiation that it generates. For this, four regions of interest (ROIs) were defined in the image to be compared within the parameters of diagnostic image quality.
3.
RESULTS AND DISCUSSIONS
The volumetric CT dose index (CTDIvol) were calculated using the average values of the central
region in each of the positions where the film strips were placed. The expression by which the values of CTDIvol were calculated was:
Where CTDI100, central is the dose index value found at the central position and CTDI100, per is the
average dose index value at the peripheral positions of the head phantom. The dose index values calculated with equation (1) for each one voltage values are described in Table 2.
Table 2. Volumetric dose index values.
Voltage (kV) CTDIvol (mGy) 80 6.24 100 13.25 120 23.73
For the same charge (100 mA.s) the dose index were proportional to the increase in the voltage
val-ues of the X-ray tube, experiencing an increase in dose in relation to the lowest calculated dose value of 112.33% and 280.28%, respectively.
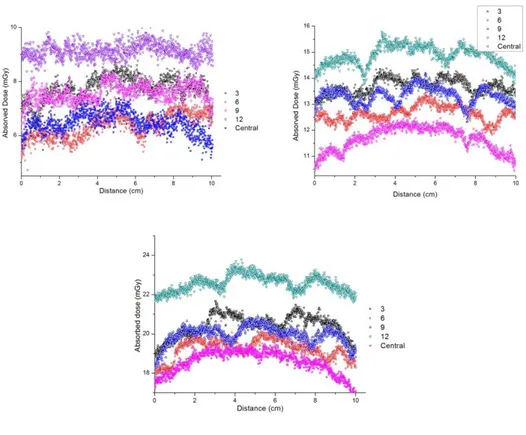
The dose profiles found for each one of the positions were referenced to perform the calibration of the radiochromic film strips and to perform the conversion of intensity values in grayscale for absorbed dose. The absorbed dose profiles for the voltage values of 80, 100 and 120 kV are pre-sented in Figure 4.
Figure 4. Absorbed dose profile for 80, 100 and 120 kV.
The lowest dose value recorded with a voltage value of 80 kV was 6.36 ± 0.45 mGy at position 6. At position 12 the highest dose value was recorded, which was 9.13 ± 0.28 mGy , with a dif-ference of 43.55% between them. For the 100 kV voltage, the lowest recorded value was in the central position of 11.65 ± 0.46 mGy, with a difference of 27.47% with the highest recorded val-ue of 14.85 ± 0.38 mGy in the position 12. With the equipment programmed at 120 kV voltage, the highest dose value was recorded at position 12 with 22.57 ± 0.41 mGy, being 21.74% higher than the lowest dose recorded in the central position with 18.54 ± 0.59 mGy.
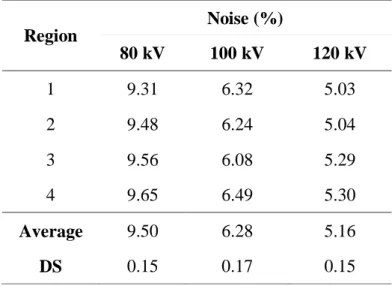
The noise was calculated as the percentage value of the standard deviation in relation to the av-erage value of Hounsfield (HU) scale intensity. Equation (2) defines the percentage noise value for each selected region of the image.
Therefore, the calculation was performed in each of the four ROIs selected in the central slice image. The results are shown in Table 3.
Table 3. Percentage noise index.
Region Noise (%) 80 kV 100 kV 120 kV 1 9.31 6.32 5.03 2 9.48 6.24 5.04 3 9.56 6.08 5.29 4 9.65 6.49 5.30 Average 9.50 6.28 5.16 DS 0.15 0.17 0.15
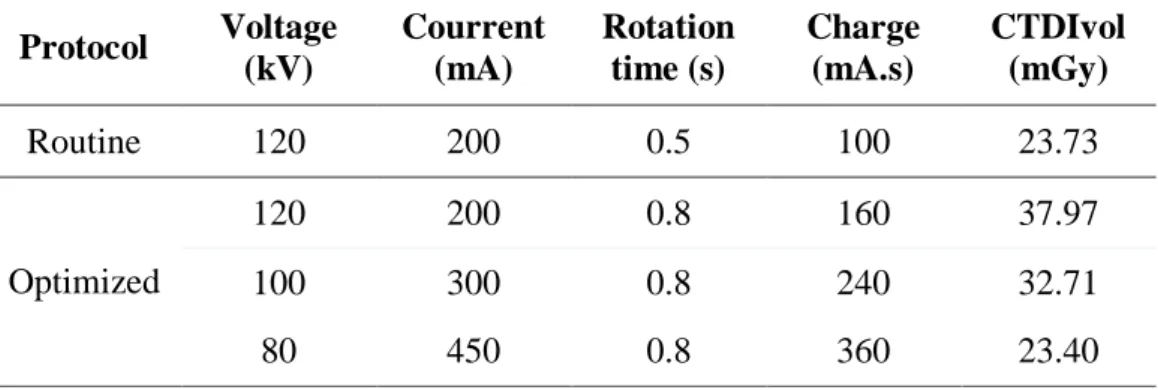
It is possible to observe that the images present greater noise for the voltage of 80 kV than for 120 kV, verifying that, for lower voltage levels, the percentage of quantum noise recorded in CT images is higher and must be compensated by increasing of the X-ray tube current (mA). In or-der to corroborate the possibility of reducing the dose in head examinations in adult patients, the protocols for this type of examination were verified using optimized values of current (mA), obtaining noise smaller then 1%. For this, the automatic exposure control tool was used to de-termine the ideal current for a fixed noise value. Therefore, it was defined in noise index tool the of this CT scanner the value of 5.9, because that represents a noise smaller then 1% for an image reconstruction of 40 mm. Defined these electrical current values the noises were next to 0.5%. Tab. 4 shows the optimized acquisition parameters of voltage, current, tube time and charge in helical mode for a pitch 0.984, and dose index obtained for routine protocols of the radiodiagnostic service and for the optimized protocol that is proposed.
Tab. 4 Routine and optimized protocols for head CT scans. Protocol Voltage (kV) Courrent (mA) Rotation time (s) Charge (mA.s) CTDIvol (mGy) Routine 120 200 0.5 100 23.73 Optimized 120 200 0.8 160 37.97 100 300 0.8 240 32.71 80 450 0.8 360 23.40
As the routine protocol studied for this equipment presented a noise of about 5.16 %, it was de-cided to optimize that protocol both to reduce the deposited dose and to improve the image quali-ty. When comparing the results, it can be verified that the protocol optimized for 80 kV there is a dose reduction of 1.39% in relation to the routine protocol, but this protocol has a smaller noise.
4. CONCLUSIONS
The irradiations of the central region of the head phantom, using radiochromic film strips, al-lowed to observe that when using the parameters of the radiodiagnostic service (120 kV voltage), there is a greater dose deposition in comparison to the other parameters used in this study.
Despite the increase in the percentage of noise in the images due to the reduction in the voltage values of the tube, the images were within the limits of the percentage of noise acceptable for diagnosis.
The results obtained allow us to conclude that the routine protocols defined for head examina-tions in adult patients still deposit high doses of radiation, regardless of whether the equipment has the automatic control system, since head examinations do not use automatic exposure con-trol, due to the fact that the diameter of the skull does not vary considerably. However, the dose
Brazilian legislation.
5.
ACKNOWLEDGMENT
The authors thank the Technology in Molecular Medicine Center (INCT-MM) of the UFMG that contributed to the development of this study.
REFERENCES
ANDISCO, D.; BLANCO, S.; BUZZI, A. Dosimetría en tomografía computada. Revista
Argen-tina de radiología, Elsevier, v. 78, n. 3, p. 156–160, 2014.
ANDRADE, M. E. A. Avaliação da qualidade de imagem e do índice volumétrico de kerma ar em tomografia computadorizada (cvol) em recife. Universidade Federal de Pernambuco, 2008. AUGUSTO, F. M. Estudo da qualidade da imagem e índices de dose em tomografia computadorizada. Tese (Doutorado) — Universidade Federal do Rio de Janeiro, 2009.
BEISTER, M.; KOLDITZ, D.; KALENDER, W. A. Iterative reconstruction methods in x-ray ct.
Physica medica, Elsevier, v. 28, n. 2, p. 94–108, 2012.
CALZADO, A.; GELEIJNS, J. Tomografía computarizada. evolución, principios técnicos y aplicaciones. Revista de Física Médica, v. 11, n. 3, 2010.
DALMAZO, J. et al. Otimização da dose em exames de rotina em tomografía computadorizada: estudo de viabilidade em um hospital universitário. Radiologia Brasileira, Colégio Brasileiro de Radiologia e Diagnóstico por Imagem, v. 43, n. 4, p. 241–248, 2010.
DHAWAN, A. P. Medical Image Analysis. [S.l.]: IEEE, 2011. 88-93 p. RADCAL, C. ACCU-GOLD User Guide. [S.l.], 2015.
TAWFIK, G. et al. Characteristics of gafchromic xrqa2 films for kv image dose measurement.
Medical Physics, v. 39, n. 2, 2012.