BJRS
RADIATION SCIENCES
08-01 (2020) 01-12ISSN: 2319-0612 Accepted: 2019-10-04
5X5 Rod Bundle Flow Field Measurements Downstream a
PWR Spacer Grid
H. F. P. Castro
a; V. Vasconcelos
b; A. A. C. Santos
b; M. A. F. Veloso
aaUniversidade Federal de Minas Gerais/Departmentamento de Engenharia Nuclear, CEP: 31270-901, Belo Horizonte,
Minas Gerais, Brazil
bCentro de Desenvolvimento da Tecnologia Nuclear/Laboratório de Termo-hidráulica, CEP: 31270-901, Belo
Horizon-te, Minas Gerais, Brazil [email protected]
ABSTRACT
The spacer grids are structures present in nuclear fuel assembly of Pressurized Water Reactors (PWR). They play an important structural role and also assist in heat removal through the assembly by promoting increased turbulence of the flow. Understanding the flow dynamics downstream the spacer grid is paramount for fuel ele-ment design and analysis. This paper presents water flow velocity profiles measureele-ments downstream a spacer grid in a 5x5 rod bundle test rig with the objective of highlighting important fluid dynamic behavior near the grid and supplying data for CFD simulation validation. These velocity profiles were obtained at two different heights downstream the spacer grid using a LDV (Laser Doppler Velocimetry) through the top of test rig. The turbulence intensities and patterns of the swirl and cross flow were evaluated. The tests were conducted for Reynolds numbers ranging from 1.8x10⁴ to 5.4x10⁴. This experimental research was carried out in
thermo-hydraulics laboratory of Nuclear Technology Development Center – CDTN. Results show great repeatability and low uncertainties (< 1.24 %). Details of the flow field show how the mixture and turbulence induced by the spac-er grid quickly decays downstream the spacspac-er grid. It is shown that the developed methodology can supply high resolution low uncertainty results that can be used for validation of CFD simulations.
1. INTRODUCTION
The main elements of a nuclear fuel assembly of a Pressurized Water Reactor are the bottom and top nozzles, fuel rods and spacer grids. The water flows axially from the bottom nozzle to the top nozzle, flowing amidst zirconium fuel rods. These rods are kept fixed as a square bundle due to spacer grids. Spacer grids are structures with two main objectives: on one hand they improve the heat exchange by promoting turbulence in the fluid flow due to a local pressure drop. On the other hand, they improve the structural integrity of the fuel assembly helping to keep rods fixed. There-fore it is important to understand the flow dynamics downstream the spacer grids in order to im-prove its efficiency and safety in PWRs.
During last year several experimental and numerical investigations have been performed. Many of these experimental investigations used 2D or 3D LDV and PIV techniques for axial and lateral ve-locities profiles measurements.
Chang et al., [1] and Xiong et al., [2] utilized a LDV-2D and 3D, respectively, for axial and lateral velocities profiles evaluation of the water flow through a test rig with a mixing vane spacer grids. An experimental benchmark was presented by Conner et al. [3] whose measurements were made using a PIV-2D Particle Image Velocimetry. The experiments were performed in a 5x5 rod bundle made of FEP (Fluorinated Ethylene-propylene).
Ylönen [4] brought a novelty when using an ABS (Acrylonitrile Butadiene Styrene) spacer grid. The spacer grid manufactured by Ylönen was based on the spacer grid geometry used by Navarro and Santos [5]. In turn, Navarro and Santos performed numerical simulations of Karoutas et. al. [6] spacer grid. Both Ylönen and Karoutas used numerical simulations to validate their experiments. The aim of this work is to show some important lateral velocities profiles results at downstream of the spacer grid placed in a representative nuclear fuel assembly in a test rig at CDTN Thermal-Hydraulics Laboratory.
2. MATERIALS AND METHODS
In the Thermal-Hydraulics Laboratory of CDTN (Nuclear Technology Development Center) a se-ries of experiments were carried out. The experiments were run on the Air-Water Circuit – AWC whose water flow regime was carefully monitored under environmental pressure and temperature conditions. Water flow tests were performed for five Reynolds numbers. The RNFA located in the AWC has a 5x5 rod bundle and four spacer grids, similar to a real nuclear fuel assembly. The lateral velocities measurements were carried downstream the spacer grid using a LDV (Laser Doppler Ve-locimetry). Also, differential pressure transducers were used to measure the pressure differences of the flow in the test section.
2.1 The air-water circuit
The tests section contains a 5x5 square rod bundle flow with 4 spacer grids. Laterally, the tests sec-tion has two stainless steel sides and two acrylic sides. Its top is also made of acrylic. These lateral windows and the top of acrylic allow measuring the velocities profiles and also the swirl and cross-ing flow between sub-channels.
Several measurements have been made for two heights at downstream of a mixing vane spacer grid located in the test section. These measurements have been performed for five different Reynolds numbers between 1,8x10⁴ and 5,4x10⁴.
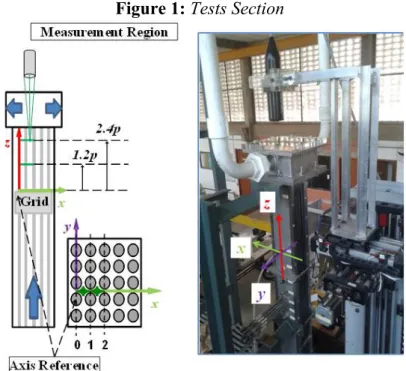
The measurements region is shown in Fig. 2. This region was discretized in a set of 506 points of measurement and at each point the x and y components were measured. From these data was possi-ble to obtain cross-flow and swirl patterns. A linear sub-set formed by 51 points – in red in Fig. 2 - is used to obtain the flow velocity along the sub-channel.
2.2 The measurements systems
The lateral velocities profiles were measured by 2D LDV. The LDV technique is based on Doppler Effect. The LDV produces two incident beams of light into the flow. The seeding particles mixed in the water scat-ter the beam light. The scatscat-tered beam light is captured by the photo detector. The difference between the
scattered light frequency from a moving seeding particle and the emitted beam light frequency is converted in velocities by a signal conditioner and a processor [7].
Some details of the tests section and the measure positions are presented in the Fig.1.
Figure 1: Tests Section
Source: Author
Figure 2: Measurement Region Detail
Source: Author This velocity values are calculated according to equation 1.
D
f
sen
V
)
2
/
(
2
θ
λ
=
(1) Where, λ is the wavelength of the laser light, f is the Doppler-frequency (difference between Dincident light and scattered light by a moving particle seeding) and θ/2is the half angle between incidents light.
The uncertainties associated to the velocity profiles were evaluated with a 95% confidence interval. Equation 2 shows how these uncertainties were calculated.
2 2 2
∂
∂
+
∂
∂
+
∂
∂
=
λ θθ
λ
u
V
u
f
V
u
V
u
fD D v (2)The parameters u , λ u , fD u are the uncertainties of wave length, Doppler frequency and angle be-θ
tween two beams, respectively.
The LDV movement trough the measurement points is controlled by an accurate 3D traversing de-vice which gives a high resolution (0.05 x10⁻³m), permitting detailed measurements in the flow.
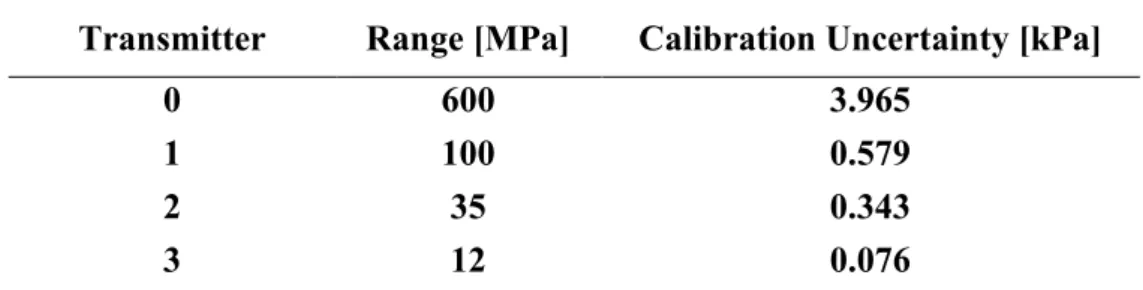
The mass flow rate at the AWC was determined through an orifice plate (ISO 5167 [8]) which gen-erates a well known pressure drop in this region. Table 1 shows the pressure drop transmitters used in this study. These transmitters have been calibrated by a methodology developed at the Thermal-hydraulics laboratory.
Table 1: Pressure drop transmitters.
Transmitter Range [MPa] Calibration Uncertainty [kPa]
0 600 3.965
1 100 0.579
2 35 0.343
The transmitter 0 was used to monitor the pressure at the test section. A couple of taps were used to pressure drop measurements at the test section region. These measurements were based on the methodology developed by Chun and Oh [9] and In et. al. [10].
Two type J thermocouples with its transmitters were used to measure temperature at the test section. Each measurement device was calibrated following an established calibration methodology.
The thermocouple operation range is from 0 to 100 °C (373 K) and their calibration uncertainty is ± 0.49 and ± 0.47°C. A K type portable thermocouple was used for environment temperature monitor-ing. Thermocouple uncertainty is ± 2.2 ºC.
The signals generated by the data acquisition instrumentation for pressure and temperature meas-urements were sent to a conditioning board (PCLD-789D with the 50 of gain accuracy ± 0,0244 % of the range) and an A/D signal converting (PCL-818HD with 1 from ± 0,01 % of the range gain) of the Advantech.
A computer program was developed in order to make real-time data monitoring.
3. RESULTS AND DISCUSSION
The experimental conditions were carefully maintained and are presented in Table 2.
Table 2: Experimental conditions.
Re [10³] U[10³] T [K] U [K] P [Pa] U [Pa]
18.29 0.55 298.35 274.15 657 5
27.55 0.88 298.55 274.25 1002 7
36.35 1.07 298.15 274.15 1468 7
45.62 1.34 298.35 274.15 2064 13
54.12 1.63 298.45 274.25 2743 29
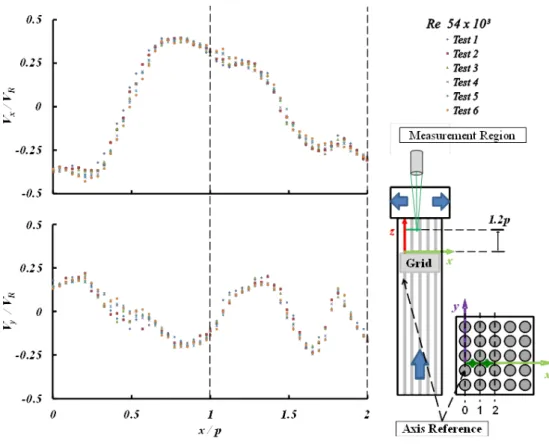
Fig. 3 shows two graphs for Vx and Vy velocities profiles in six tests at 1.2p downstream the spacer
Figure 3: Tests repeatability for Re = 54x10³and 1.2 height at downstream spacer grid.
Source: Author
Both graphs in Fig. 3 show a good agreement of measured data. An averaged profile and its uncer-tainty are shown in Fig. 4.
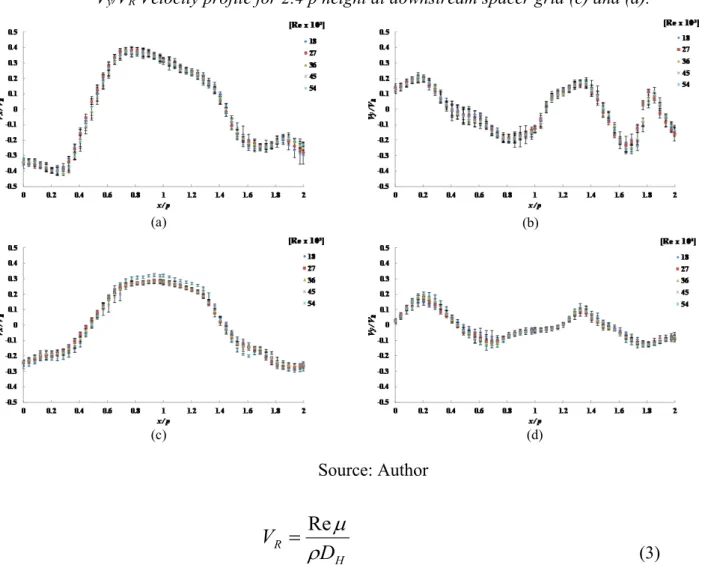
Fig. 4 presents the whole set of graphics obtained for the averaged lateral velocity downstream the spacer grid for all evaluated flows. Data are normalized by the distance between two consecutive rods (p). The velocity components were also normalized by a reference velocity VR, the flow
Figure 4: Vx/VR Velocity profile for 1.2 p height at downstream spacer grid (a) and (b).
Vy/VR Velocity profile for 2.4 p height at downstream spacer grid (c) and (d).
(a) (d) (c) (b) Source: Author H R
D
V
ρ
µ
Re
=
(3) Re is the Reynolds number, µ is the dynamic viscosity of water, ρ is density of water and D is Hhydraulic diameter.
The measurement positions along direction x/p in each sub-channel go from 0 to 2, where p is the
pitch. The normalized positions 0p, 1p and 2p match the center region between the rods.
Still related to Fig. 4, it is possible to see that both lateral velocity profiles Vx/VR and Vy/VR had their
magnitude reduced as the distance from the spacer grid is increased. Observe also that the velocity profiles have the same behavior for flows with different Reynolds numbers.
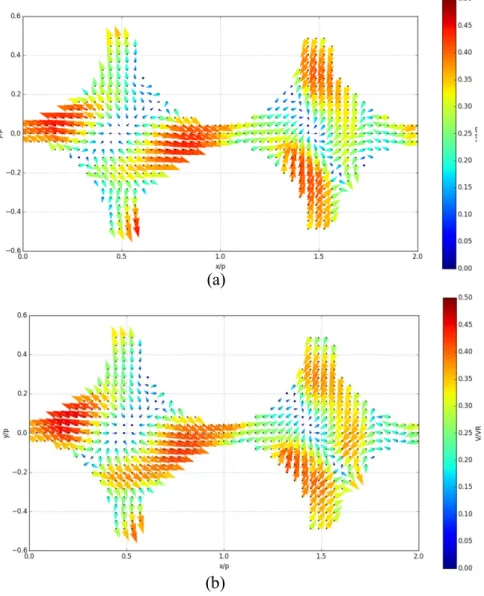
Fig. 5 (a) shows a velocity vector field at height of 1.2p downstream the spacer grid for a flow with Reynolds number of 18x10³. In Figure 5 (b), a flow with Reynolds number of 54x10³ is presented at the same conditions.
Figure 5: Velocity profile field for 1.2 p height at downstream spacer grid for Re = 18x10³
in (a) and for Re = 54x10³ in (b).
(a)
(b)
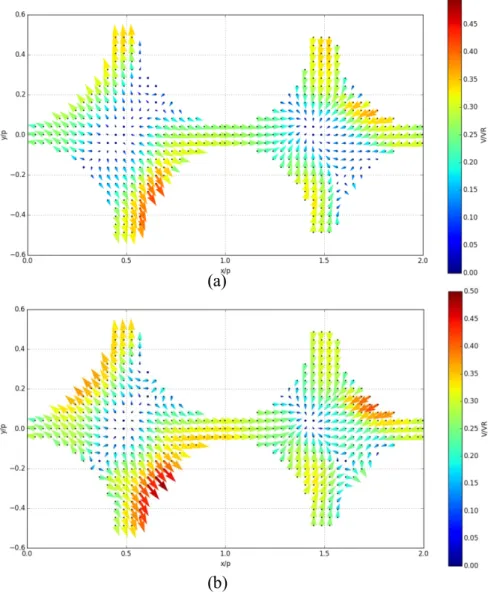
Figure 6: Velocity profile field for 2.4 p height at downstream spacer grid for Re = 18x10³
in (a) and for Re = 54x10³ in (b).
(a)
(b)
Source: Author
Graphs presented in Figs. 6 (a) and (b) are similar to those of Fig. 5 (a) and (b). Details of the flow fields show how the mixture and turbulence induced by the spacer grid quickly decays downstream the spacer grid.
The normalized expanded uncertainty for the values of Reynolds between 18x10³ and 54x10³ are 0.41% and 1.24% respectively.
4. CONCLUSION
In this work was presented results of two lateral velocity profiles downstream spacer grids placed in a representative nuclear fuel assembly in a test rig at CDTN Thermo-Hydraulics Laboratory. From measurements of lateral velocity profiles was possible to obtain two-dimensional velocity vector fields. The measurements were made using the Laser Doppler Velocimetry (LDV) technique. From the obtained velocity fields it was possible to notice the expected swirl and cross flow pat-terns. The results obtained from this experimental investigation are useful for CFD validation and as input data for sub-channel analysis codes.
Future work go towards build and test a completely new spacer grid made of ABS by a 3D printer following the methodology used by In et al., [11] e Ylönen [4]. The ABS spacer grid that will be built will be added to the experimental test rig of the AWC circuit of the CDTN Thermal-Hydraulics laboratory. A model of the new spacer grid geometry will be used to carry simulations using CFD.
5. ACKNOWLEDGMENT
This research project has been supported by the following institutions: Universidade Federal de Minas Gerais (UFMG); Centro de Desenvolvimento da Tecnologia Nuclear (CDTN), ; Fundação de Amparo à Pesquisa do Estado de Minas Gerais (FAPEMIG); Conselho Nacional de Desenvolvi-mento Científico e Tecnológico (CNPq); Indústrias Nucleares do Brasil (INB); e Coordenação de Aperfeiçoamento de Pessoal de Nível Superior (CAPES).
REFERENCES
1. CHANG, S. K.; KIM, S.; SONG, C. H. Turbulent mixing in a rod bundle with vaned spacer
2. XIONG, J.; YU, Y.; YU, N.; FU, X.; WANG, H.; CHENG, X.; YANG, W. Laser Doppler
Measurement and CFD Validation in 3x3 Bundle Flow. Nuclear Engineering and Design. v.
270, p. 396-403, 2014.
3. CONNER M. E.; DOMINGUEZ O; ELVIS E.; HASSAN Y. A. Hydraulic benchmark data for
PWR mixing vane grid. In: INTERNATIONAL TOPICAL MEETING ON NUCLEAR REACTOR THERMAL HYDRAULICS, 2011, Toronto. Annals… Toronto: Canadian
Nu-clear Society, 2011. p. 25-30.
4. YLÖNEN, A. T. High-resolution flow structure measurements in a rod bundle. Thesis, at
the Department of Mechanical and Process Engineering at the ETH, Zürich, Switzerland, 2013.
5. NAVARRO M. A.; SANTOS, A. A. C. Numerical Evaluation of Flow through a 5x5 PWR Rod
Bundle: Effect of the Vane Arrangement in a Spacer Grid. In: INTERNATIONAL NUCLE-AR ATLANTIC CONFERENCE, 2009, Rio de Janeiro, Annals… Rio de Janeiro: Comissão
Nacional de Energia Nuclear, 2009.
6. KAROUTAS Z.; GU C.; SHOLIN, B. 3-D Flow analyses for design of Nuclear Fuel Spacer. In: INTERNATIONAL TOPICAL MEETING ON NUCLEAR REACTOR THERMAL HY-DRAULICS, 1995, Saratoga Springs. Annals… Saratoga Springs: United States Nuclear
Regu-latory Commission, 1995. p. 3153-3174
7. BSA Flow Software. BSA Flow Software Version 4.10 Instalation & User’s Guide. Dantec
Dynamics A/S, Denmark, 2006.
8. ISO – International Organization of Standardization. Measurements of fluid flow by means of pressure differential devices. ISO 5167-1, Geneva: ISO 1991. 33p.
9. CHUN, T. H.; OH, D S. A pressure drop model for spacer grids with and without flow mix-ing vanes. Journal of Nuclear Science and Technology, v. 35, p. 508-510, 1998.
10. IN, W. K.; OH, D. S.; CHUN, T. H. Empirical and Computational Pressure Drop Correla-tions for Pressurized Water Reactors Fuel Spacer Grids. Nuclear Technology, v. 139, p.
72-79, 2002.
11. IN W. K.; SHIN C. K.; OH D. S.; CHUN T. H. Experimental Observation and CFD Prediction
of Flow Mixing in a Rod Bundle with Mixing-vane Spacer Grid. In: PACIFIC SYMPOSIUM ON FLOW VISUALIZATION AND IMAGE PROCESSING, 2015, Naples, Annals…