Brazilian state capitals: 1980-2015
Correspondence:
Danúbia da Cunha Antunes Saraiva – Serviço de Nutrição e Dietética, Praça Cruz Vermelha, No. 23, 5º andar, Centro, Rio de Janeiro, RJ, Brazil. CEP: 20230-130
E-mail: [email protected]
Danúbia da Cunha Antunes Saraiva1 – orcid.org/0000-0003-1849-2894
Sabrina da Silva Santos2
Gina Torres Rego Monteiro2
1Instituto Nacional de Câncer José Alencar Gomes da Silva, Hospital do Câncer I, Serviço de Nutrição e Dietética, Rio de Janeiro, RJ, Brasil
2Fundação Oswaldo Cruz, Escola Nacional de Saúde Pública Sérgio Arouca, Departamento de Epidemiologia e Métodos Quantitativos em Saúde, Rio de Janeiro, RJ, Brasil
Abstract
Objective: to analyze the temporal trend of leukemia mortality in children and adolescents under 20 years old, in Brazilian state capitals and Federal District, between 1980 and 2015. Methods: this was a descriptive time series study; age-standardized leukemia mortality rates were calculated; the Prais-Winsten regression model was used. Results: leukemia mortality rates fell from 2.73 to 1.58 per 100,000 inhabitants aged under 20 years in the period studied (annual percentage variation of -7.06%: 95%CI -8.61;5.49), with differences between capitals; there was a reduction in magnitude in all age groups – 0-4 years (9.17%: 95%CI -11.58;-6.69), 5-9 years (-9,27%: 95%CI -11.90;-6.56), 10-14 years (-4.86%: 95%CI -6.69;-3.00) and 15-19 years (-3.77%: 95%CI -5.22;-2.31). Conclusion: there was a falling trend in pediatric leukemia mortality rates, although it was unequal between the capitals, indicating the need for measures to minimize regional differences.
Keywords: Child; Adolescent; Leukemia; Mortality; Ecological Studies; Time Series Studies.
Introduction
Cancer is one of the major causes of death in children around the world.1,2 It is the second leading
cause of death in children and adolescents in Brazil, surpassed only by the deaths from external causes. As such it is a public health problem.3 Pediatric Cancer
mortality rates are, however, changing dramatically as patient survival rate increases. This can be confirmed by the well documented substantial declining trend in these rates since the beginning of the 1960s in high-income countries. In middle-and low-income countries, including Latin America countries, declining trends began later and have been less pronounced.4
Pediatric leukemias are cancers of hematopoietic system, in most cases involving malignant transformation of lymphoid progenitor cells and, less commonly, myeloid progenitor cells.5 In the 0 to 19 age range,
they correspond to 25.6% of cancer cases, representing the most common type of childhood cancer (from 0 to 14 years: 33.2%) and main cause of cancer-related mortality in pediatrics.1-4
Pediatric mortality from leukemia, particularly acute lymphoblastic leukemia (ALL), has shown a decline in European countries, the United States of America (USA) and Japan, due to continuous and progressive therapeutic advances.1,6 In Latin America,
pediatric leukemia mortality trends point to a decrease in most countries, comparable to the trends observed in higher income areas.4 However, few studies depict
this scenario in Brazil.
It is important to know the distribution of leukemia mortality in pediatric populations in Brazil and this is possible, thanks to the existence of available data on the Mortality Information System (SIM), managed by the Health Surveillance Secretariat of the Brazilian Ministry of Health (SVS/MS).
The objective of this study was to analyse the leukemia mortality trend in children under 20 years of age, in Brazilian state capitals, between 1980 and 2015, with the purpose of obtaining a panorama of the
epidemiological situation of this disease and providing inputs to inform to public policies.
Methods
A descriptive study was carried out using time-series data of deaths from leukemia in children and adolescents (0 to 19 years) of both sexes, resident in 26 Brazilian capitals and Federal District, between 1980 and 2015.
Leukemia deaths were obtained directly from SIM. We analyzed the mortality data regarding the state capital cities and Federal District, because they are more robust when compared to the data sets of the states as a whole; this is because some of these states have low coverage, high underreporting of deaths and a large number of deaths due to ill-defined causes, in addition to a high percentage of unknown external causes.
We considered those deaths coded as 204 (lymphoid leukemia), 205 (myeloid leukemia), 206 (monocytic leukemia), 207 (Other specified leukemia) or 208 (leukemia of unspecified cell type), according to the Ninth Revision of the International Statistical Classification of Diseases and Related Health Problems (ICD-9), in force in the period from 1980 to 1995; in 1996 the 10th ICD Revision came into force, of which we
considered the respective (new) codes C91 (lymphoid leukemia), C92 (myeloid leukemia), C93 (monocytic leukemia), C94 (Other leukemias of specific cell type) and C95 (leukemia of unspecified cell type) for the period 1996 to 2015. , Analyses were also performed on total data for all the capitals grouped together according to types of leukemia: lymphoid, myeloid and other types (ICD-9 206, 207 and 208 ; ICD-10 C93, C94 and C95). Analysis was performed for each capital individually, grouping all leukemias together per capital, with the aim of minimizing mortality rate oscillations resulting from working with a reduced number of outcomes.
For the purposes of our analyses, we used the size of the population of children and adolescents resident in the state capitals for each year, as calculated by the Brazilian Institute of Geography and Statistics (IBGE) and available on the website of the Brazilian National Health System IT Department (Datasus). For the years 1980 to 2012, the data were based on the 1980, 1991, 2000 and 2010 demographic censuses, as well as on the 1996 population count and the 1981-2012
intercensal population estimates. With regard to the years 2013-2015, population size was based on preliminary estimates made by a study sponsored by the Brazilian Interagency Network for Health Information (RIPSA). Population projections and the reviews thereof were produced based on different sources and methodologies. It is possible that these may be different to other projections and estimates and that this may affect the calculations of mortality rates. Nevertheless, in accordance with IBGE recommendations, we used the most recent population projection reviews, in order to maximize comparability between the years analyzed. Leukemia mortality rates (per 100,000 inhabitants) were calculated by specific age in years (0-4, 5-9, 10-14, 15-19)7,8 and by capital, according to sex. The
rates for the <20 years age group were standardized by the direct method, using the world population proposed by Segi and modified by Doll et al.,9 in
relation to the age range covered by our study, with the intention of controlling the effect of age distribution change over time.
Specifically in relation to residents in the city of Palmas, population and mortality data were considered from 1992, as the city was founded in 1989 and established as the capital of the state Tocantins in 1990, so that records only began after this period.
Prais-Winsten linear regression was used for trend analysis, taking as independent X variable the year in which deaths occurred, and as dependent Y variable the annual mortality rate of each capital. The Prais-Winsten method is indicated to correct serial autocorrelation in time series. The Durbin-Watson test was used to check for the existence of series autocorrelation.10
The Prais-Winsten regression model enabled the estimation of beta 1 (b1) values of the standardized mortality rates, also by sex and age. Subsequently, the b1 values corresponding to each of the rates were applied to the following formula, with the objective of identifying annual variation rates, or annual percentage change (APC):
APC= [-1+10b1]*100%
When using APC analysis, we can say that a trend is increasing when the rate of variation is positive, decreasing when it is negative, and stationary when there is no significant difference between its value and zero. The confidence interval (CI) calculation was performed by applying the following formula:
95%CI=[-1+10b1minimum]*100% ; [-1+10b1maximum]*100%
Minimum and maximum b1 values were obtained in the CI generated after the regression analyses by the statistical analysis program Stata version 10.0. A 0.05 significance level was used.
In accordance with National Health Council (CNS) Resolution No. 510, dated 7 April 2016, the study was not submitted to the appraisal of an Ethics Research Committee because it was based on secondary public domain data and did not use nominal data that could enable individuals to be identified.
Results
Between 1980 and 2015, there were 10,135 deaths from leukemia in children and adolescents (aged 0-19 years) living in 26 Brazilian capital cities and the Federal District, with 5,854 male deaths 4,276 female deaths; five deaths showed no information regarding sex and were excluded from the analyses of this variable. Age-standardized leukemia mortality rates in children and adolescents younger than 20 years old, of both genders, dropped from 2.73 to 1.58/100,000 inhabitants in the period studied. The analysis per type of leukemia showed a reduction of 1.21 to 0.98/100,000 inhab. for lymphoid leukemia, 0.83 to 0.45/100,000 inhab. for myeloid leukemia, and 0.68 to 0.16/100,000 inhab. for other leukemias (Figure 1).
Mortality rates were higher in males in almost all the years studied (Figure 1), in the different age ranges and in all years for the 15-19 age group (Figure 2).
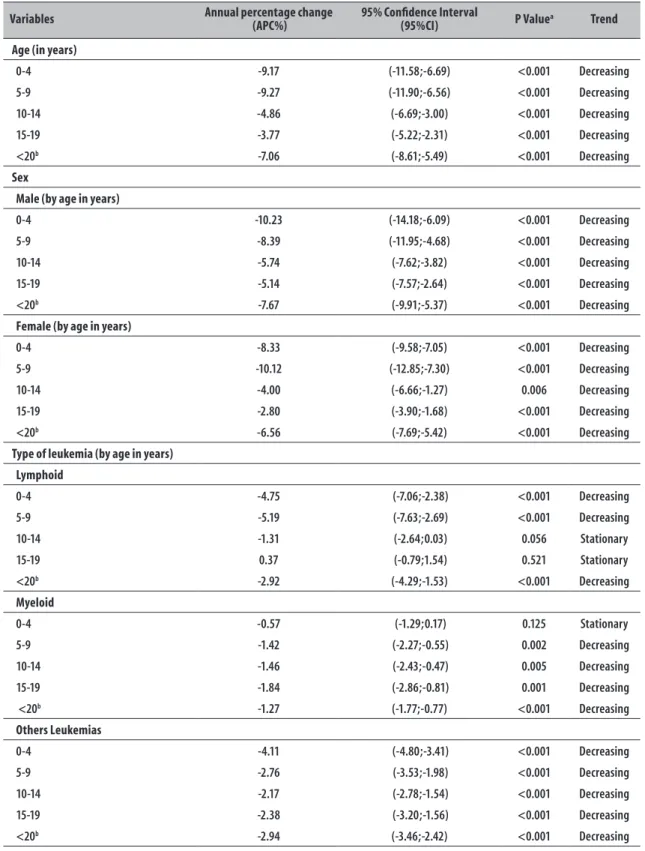
Throughout the study period, a reduction was found in the magnitude of mortality rates by Brazilian capitals in all age ranges, with a variation of -7.06% (95%CI -8,61;-5,49) in those aged under 20 years. The time trend analysis by sex and age group showed a reduction in mortality for both sexes; however, girls aged 15-19 showed the lowest APC in the period analyzed (-2,80%: 95%CI -3.90;-1.68). The analysis per type of leukemia showed a decreasing trend in mortality from lymphoid leukemia of -2.92% (95%CI -4.29;-1.53), a decrease of -1.27% (5%CI -1.77;-0.77) for myeloid leukemia, and a decrease of -2.94% (95%CI -3.46;-2.42) for other leukemias. However, in the case of myeloid and lymphoid leukemias, this declining trend was not observed in all age groups (Table 1).
Leukemia 3.4 3.2 3.0 2.8 2.6 2.4 2.2 2.0 1.8 1.6 1.4 1.2 1.0 0.8 0.6 0.4 0.2 0.0 Standar diz ed mor talit y r at es
1980 1981 1982 1983 1984 1985 1986 1987 1988 1989 1990 1991 1992 1993 1994 1995 1996 1997 1998 1999 2000 2001 2002 2003 2004 2005 2006 2007 2008 2009 2010 2011 2012 2013 2014 2015
Total Male Female
Standar diz ed mor talit y r at es 2.0 1.8 1.6 1.4 1.2 1.0 0.8 0.6 0.4 0.2 0.0
1980 1981 1982 1983 1984 1985 1986 1987 1988 1989 1990 1991 1992 1993 1994 1995 1996 1997 1998 1999 2000 2001 2002 2003 2004 2005 2006 2007 2008 2009 2010 2011 2012 2013 2014 2015
Total Male Female Lymphoid leukemia
Myeloid leukemia Others leukemia
Total Male Female Total Male Female
1980 1981 1982 1983 1984 1985 1986 1987 1988 1989 1990 1991 1992 1993 1994 1995 1996 1997 1998 1999 2000 2001 2002 2003 2004 2005 2006 2007 2008 2009 2010 2011 2012 2013 2014 2015 1980 1981 1982 1983 1984 1985 1986 1987 1988 1989 1990 1991 1992 1993 1994 1995 1996 1997 1998 1999 2000 2001 2002 2003 2004 2005 2006 2007 2008 2009 2010 2011 2012 2013 2014 2015
Standar diz ed mor talit y r at es 2.0 1.8 1.6 1.4 1.2 1.0 0.8 0.6 0.4 0.2 0.0 Standar diz ed mor talit y r at es 2.0 1.8 1.6 1.4 1.2 1.0 0.8 0.6 0.4 0.2 0.0
Figure 1 – Leukemia mortality rates (per 100,000 inhabitants) standardized by age, according to sex and type of leukemia, capitals of Brazilian states and Federal District, 1980-2015
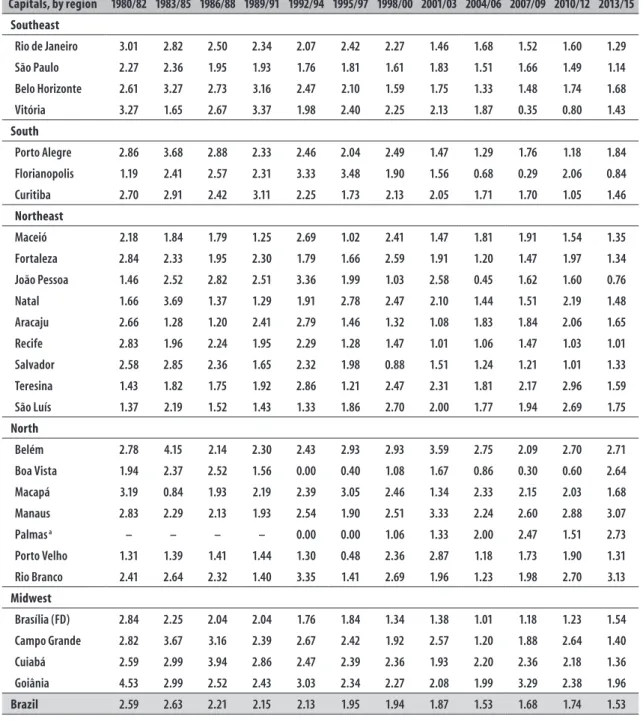
capitals of the Southeast region showed a decline in rates, when compared to the first triennium period. For example, the city of Vitoria had the second lowest mortality rate per triennium compared to the other capitals (0.35/100,000 inhab.) in 2007-2009. In the Southern region, Porto Alegre and Curitiba showed a decrease in mortality rates, although this trend was more continuous from 1998-2000. In Florianópolis, a reduction in leukemia mortality magnitude was found between 1995-1997 and 2007-2009, from 3.48 to 0.29/100,000 inhab., being the lowest among the capitals studied. The highest mortality rate in the Northeastern region was found in the city of Natal (3.69/100,000 inhab.), from 1983-1985; furthermore, the mortality rates of the Northeastern capitals showed large fluctuations, between increases and decreases during the historical series observed. The Northern region recorded the second highest mortality rate among the capital cities: 4.15/100,000 inhabitants <20 years, in Belém (1983-1985). In the Midwest
region we found the capital with the highest mortality rate, Goiânia (4.53/100,000 inhab. in 1980-1982), but with fluctuations in magnitude: its lower recorded rate corresponded to the period 2004-2006, with 1.99/100,000 inhab. <20 years.
1980 1981 1982 1983 1984 1985 1986 1987 1988 1989 1990 1991 1992 1993 1994 1995 1996 1997 1998 1999 2000 2001 2002 2003 2004 2005 2006 2007 2008 2009 2010 2011 2012 2013 2014 2015 1980 1981 1982 1983 1984 1985 1986 1987 1988 1989 1990 1991 1992 1993 1994 1995 1996 1997 1998 1999 2000 2001 2002 2003 2004 2005 2006 2007 2008 2009 2010 2011 2012 2013 2014 2015
1980 1981 1982 1983 1984 1985 1986 1987 1988 1989 1990 1991 1992 1993 1994 1995 1996 1997 1998 1999 2000 2001 2002 2003 2004 2005 2006 2007 2008 2009 2010 2011 2012 2013 2014 2015 1980 1981 1982 1983 1984 1985 1986 1987 1988 1989 1990 1991 1992 1993 1994 1995 1996 1997 1998 1999 2000 2001 2002 2003 2004 2005 2006 2007 2008 2009 2010 2011 2012 2013 2014 2015
Male Female Male Female
Male Female Male Female
4.1 3.9 3.7 3.5 3.3 3.1 2.9 2.7 2.5 2.3 2.1 1.9 1.7 1.5 1.3 1.1 0.9 0.7 0.5 4.1 3.9 3.7 3.5 3.3 3.1 2.9 2.7 2.5 2.3 2.1 1.9 1.7 1.5 1.3 1.1 0.9 0.7 0.5 4.1 3.9 3.7 3.5 3.3 3.1 2.9 2.7 2.5 2.3 2.1 1.9 1.7 1.5 1.3 1.1 0.9 0.7 0.5 4.1 3.9 3.7 3.5 3.3 3.1 2.9 2.7 2.5 2.3 2.1 1.9 1.7 1.5 1.3 1.1 0.9 0.7 0.5 Mor talit y r at e Mor talit y r at e Mor talit y r at e Mor talit y r at e
0 to 4 years 5 to 9 years
10 to 14 years 15 to 19 years
Figure 2 – Leukemia mortality rates (per 100,000 inhabitants) according to sex and age range, capitals of Brazilian states and Federal District, 1980-2015
only in the female sex (APC=5.38%: 95%CI 0.42;10.58). In the Midwest region there was a predominantly decreasing trend; however, Brasília (Federal District) and Campo Grande showed a stationary trend for females and Goiania for males (Table 3).
Discussion
Between 1980 and 2015, the leukemia mortality rate in children and adolescents showed a decreasing trend taking all the capital cities studied together, in both sexes, in agreement with other studies also carried out in Brazil.7,11 However, a study that evaluated the
leukemia mortality rate in people aged <20 years found a statistically significant falling trend only in the cities of São Paulo and Porto Alegre, possibly due to the short period of time assessed (1996-2008).8
When examining mortality rates by age range, higher rates were found in males. The literature also indicates that, in most countries, the highest leukemia mortality rates occur in males,7,12,13 probably due to possible
testicular relapses and faster methotrexate absorption in boys.14 In the USA, mortality rates between 1975 and
2013 were 0.7 and 0.6/100,000 inhab. for boys and girls, respectively,15 this being well below the values found in
our study (1.53 and 2.63/100,000 inhab.), although the values we found were mostly lower than those of other Latin American countries,4 such as Cuba (4.34 and
2.96/100,000 inhab.), Ecuador (4.38 and 3.93/100,000 inhab.) and Mexico (5.28 and 4.44/100,000 inhab.), in males and females respectively.
In recent decades, mortality has fallen among children and adolescents with cancer, especially in high-income countries, such as the USA and some European countries. However, data on low-income countries are scarce.1,6 A study published in 2013
Table 1 – Leukemia mortality variation and trend analysis in children and adolescents, according to age range, sex and type of leukemia, capitals of Brazilian states and Federal District, 1980-2015
Variables Annual percentage change (APC%) 95% Confidence Interval(95%CI) P Valuea Trend
Age (in years)
0-4 -9.17 (-11.58;-6.69) <0.001 Decreasing
5-9 -9.27 (-11.90;-6.56) <0.001 Decreasing
10-14 -4.86 (-6.69;-3.00) <0.001 Decreasing
15-19 -3.77 (-5.22;-2.31) <0.001 Decreasing
<20b -7.06 (-8.61;-5.49) <0.001 Decreasing
Sex
Male (by age in years)
0-4 -10.23 (-14.18;-6.09) <0.001 Decreasing
5-9 -8.39 (-11.95;-4.68) <0.001 Decreasing
10-14 -5.74 (-7.62;-3.82) <0.001 Decreasing
15-19 -5.14 (-7.57;-2.64) <0.001 Decreasing
<20b -7.67 (-9.91;-5.37) <0.001 Decreasing
Female (by age in years)
0-4 -8.33 (-9.58;-7.05) <0.001 Decreasing
5-9 -10.12 (-12.85;-7.30) <0.001 Decreasing
10-14 -4.00 (-6.66;-1.27) 0.006 Decreasing
15-19 -2.80 (-3.90;-1.68) <0.001 Decreasing
<20b -6.56 (-7.69;-5.42) <0.001 Decreasing
Type of leukemia (by age in years) Lymphoid
0-4 -4.75 (-7.06;-2.38) <0.001 Decreasing
5-9 -5.19 (-7.63;-2.69) <0.001 Decreasing
10-14 -1.31 (-2.64;0.03) 0.056 Stationary
15-19 0.37 (-0.79;1.54) 0.521 Stationary
<20b -2.92 (-4.29;-1.53) <0.001 Decreasing
Myeloid
0-4 -0.57 (-1.29;0.17) 0.125 Stationary
5-9 -1.42 (-2.27;-0.55) 0.002 Decreasing
10-14 -1.46 (-2.43;-0.47) 0.005 Decreasing
15-19 -1.84 (-2.86;-0.81) 0.001 Decreasing
<20b -1.27 (-1.77;-0.77) <0.001 Decreasing
Others Leukemias
0-4 -4.11 (-4.80;-3.41) <0.001 Decreasing
5-9 -2.76 (-3.53;-1.98) <0.001 Decreasing
10-14 -2.17 (-2.78;-1.54) <0.001 Decreasing
15-19 -2.38 (-3.20;-1.56) <0.001 Decreasing
<20b -2.94 (-3.46;-2.42) <0.001 Decreasing
Table 2 – Leukemia mortality rates (per 100,000 inhabitants) in children and adolescents under 20 years of age, standardized by age, in both sexes, brazilian capitals, 1980-2015
Capitals, by region 1980/82 1983/85 1986/88 1989/91 1992/94 1995/97 1998/00 2001/03 2004/06 2007/09 2010/12 2013/15
Southeast
Rio de Janeiro 3.01 2.82 2.50 2.34 2.07 2.42 2.27 1.46 1.68 1.52 1.60 1.29
São Paulo 2.27 2.36 1.95 1.93 1.76 1.81 1.61 1.83 1.51 1.66 1.49 1.14
Belo Horizonte 2.61 3.27 2.73 3.16 2.47 2.10 1.59 1.75 1.33 1.48 1.74 1.68
Vitória 3.27 1.65 2.67 3.37 1.98 2.40 2.25 2.13 1.87 0.35 0.80 1.43
South
Porto Alegre 2.86 3.68 2.88 2.33 2.46 2.04 2.49 1.47 1.29 1.76 1.18 1.84
Florianopolis 1.19 2.41 2.57 2.31 3.33 3.48 1.90 1.56 0.68 0.29 2.06 0.84
Curitiba 2.70 2.91 2.42 3.11 2.25 1.73 2.13 2.05 1.71 1.70 1.05 1.46
Northeast
Maceió 2.18 1.84 1.79 1.25 2.69 1.02 2.41 1.47 1.81 1.91 1.54 1.35
Fortaleza 2.84 2.33 1.95 2.30 1.79 1.66 2.59 1.91 1.20 1.47 1.97 1.34
João Pessoa 1.46 2.52 2.82 2.51 3.36 1.99 1.03 2.58 0.45 1.62 1.60 0.76
Natal 1.66 3.69 1.37 1.29 1.91 2.78 2.47 2.10 1.44 1.51 2.19 1.48
Aracaju 2.66 1.28 1.20 2.41 2.79 1.46 1.32 1.08 1.83 1.84 2.06 1.65
Recife 2.83 1.96 2.24 1.95 2.29 1.28 1.47 1.01 1.06 1.47 1.03 1.01
Salvador 2.58 2.85 2.36 1.65 2.32 1.98 0.88 1.51 1.24 1.21 1.01 1.33
Teresina 1.43 1.82 1.75 1.92 2.86 1.21 2.47 2.31 1.81 2.17 2.96 1.59
São Luís 1.37 2.19 1.52 1.43 1.33 1.86 2.70 2.00 1.77 1.94 2.69 1.75
North
Belém 2.78 4.15 2.14 2.30 2.43 2.93 2.93 3.59 2.75 2.09 2.70 2.71
Boa Vista 1.94 2.37 2.52 1.56 0.00 0.40 1.08 1.67 0.86 0.30 0.60 2.64
Macapá 3.19 0.84 1.93 2.19 2.39 3.05 2.46 1.34 2.33 2.15 2.03 1.68
Manaus 2.83 2.29 2.13 1.93 2.54 1.90 2.51 3.33 2.24 2.60 2.88 3.07
Palmas a – – – – 0.00 0.00 1.06 1.33 2.00 2.47 1.51 2.73
Porto Velho 1.31 1.39 1.41 1.44 1.30 0.48 2.36 2.87 1.18 1.73 1.90 1.31
Rio Branco 2.41 2.64 2.32 1.40 3.35 1.41 2.69 1.96 1.23 1.98 2.70 3.13
Midwest
Brasília (FD) 2.84 2.25 2.04 2.04 1.76 1.84 1.34 1.38 1.01 1.18 1.23 1.54
Campo Grande 2.82 3.67 3.16 2.39 2.67 2.42 1.92 2.57 1.20 1.88 2.64 1.40
Cuiabá 2.59 2.99 3.94 2.86 2.47 2.39 2.36 1.93 2.20 2.36 2.18 1.36
Goiânia 4.53 2.99 2.52 2.43 3.03 2.34 2.27 2.08 1.99 3.29 2.38 1.96
Brazil 2.59 2.63 2.21 2.15 2.13 1.95 1.94 1.87 1.53 1.68 1.74 1.53
a) Data from Palmas comprise the period from 1992 to 2015.
When evaluating the trends of pediatric mortality from leukemia in America, Asia and Oceania, Chatenoud et al.1 noted a significant decline in Canada, USA, Argentina,
Brazil, Chile, Colombia, Venezuela, Japan, Korea and Australia, for both genders between 1970 and 2007.
Table 3 – Leukemia mortality rate variation and trend analysis (per 100,000 inhabitants) standardized by age, in children and adolescents (0 to 19 years), according to sex, brazilian capitals, 1980-2015
Capitals, by region Annual percentage change (APC%) 95% Confidence Interval(95%CI) P Valuea Trend
Southeast
Rio de Janeiro -10.78 -13.63;-7.85 <0.001 Decreasing
Male -11.46 -15.23;-7.53 <0.001 Decreasing
Female -10.04 -13.13;-6.85 <0.001 Decreasing
São Paulo -6.42 -8.17;-4.63 <0.001 Decreasing
Male -6.82 -9.34;-4.24 <0.001 Decreasing
Female -6.06 -8.00;-4.07 <0.001 Decreasing
Belo Horizonte -11.31 -14.87;-7.60 <0.001 Decreasing
Male -9.67 -15.74;-3.15 0.005 Decreasing
Female -12.60 -16.65;-8.34 <0.001 Decreasing
Vitória -12.79 -19.25;-5.81 0.001 Decreasing
Male -17.96 -32.26;-0.64 0.043 Decreasing
Female -6.94 -18.58;6.37 0.282 Stationary
South
Porto Alegre -12.26 -15.94;-8.42 <0.001 Decreasing
Male -14.74 -19.82;-9.34 <0.001 Decreasing
Female -9.79 -14.61;-4.69 0.001 Decreasing
Florianopolis -9.31 -19.64;2.34 0.110 Stationary
Male 3.16 -15.59;26.07 0.755 Stationary
Female -19.86 -26.19;-12.99 <0.001 Decreasing
Curitiba -10.80 -13.72;-7.78 <0.001 Decreasing
Male -15.92 -20.66;-10.89 <0.001 Decreasing
Female -5.48 -10.88;0.24 0.059 Stationary
Northeast
Maceió -2.96 -8.30;2.68 0.287 Stationary
Male -1.98 -10.15;6.93 0.643 Stationary
Female -4.54 -10.68;2.03 0.165 Stationary
Fortaleza -7.27 -11.57;-2.76 0.003 Decreasing
Male -4.28 -10.29;2.14 0.180 Stationary
Female -10.31 -14.61;-5.79 <0.001 Decreasing
João Pessoa -9.67 -17.63;-0.95 0.032 Decreasing
Male -13.66 -23.86;-2.09 0.023 Decreasing
Female -5.21 -16.86;8.07 0.413 Stationary
Natal -3.30 -11.36;5.49 0.438 Stationary
Male -4.00 -14.93;8.34 0.498 Stationary
Female -3.13 -11.71;6.28 0.491 Stationary
Aracaju -2.36 -10.70;6.76 0.590 Stationary
Male -2.58 -12.30;8.22 0.617 Stationary
Female -3.22 -13.24;7.96 0.547 Stationary
Recife -10.69 -13.87;-7.38 <0.001 Decreasing
Male -15.46 -20.70;-9.88 <0.001 Decreasing
Female -5.96 -9.97;-1.77 0.007 Decreasing
Salvador -11.25 -15.24;-7.07 <0.001 Decreasing
Male -10.48 -16.72;-3.77 0.004 Decreasing
Female -11.96 -15.30;-8.49 <0.001 Decreasing
Table 3 – Leukemia mortality rate variation and trend analysis (per 100,000 inhabitants) standardized by age, in children and adolescents (0 to 19 years), according to sex, brazilian capitals, 1980-2015
Capitals, by region Annual percentage change (APC%) 95% Confidence Interval(95%CI) P Valuea Trend
Teresina 4.27 -1.56;10.44 0.149 Stationary
Male 4.34 -7.06;17.13 0.461 Stationary
Female 4.12 -5.52;14.75 0.404 Stationary
São Luís 5.44 -0.11;11.30 0.055 Stationary
Male 1.60 -6.04;9.87 0.682 Stationary
Female 8.28 2.57;14.30 0.005 Increasing
North
Belém -1.77 -9.20;6.25 0.646 Stationary
Male -0.30 -8.78;8.96 0.945 Stationary
Female -4.43 -11.57;3.29 0.244 Stationary
Boa Vista -4.01 -16.61;10.49 0.558 Stationary
Male -6.21 -21.61;12.21 0.472 Stationary
Female -4.51 -18.22;11.51 0.550 Stationary
Macapá -1.47 -10.83;8.87 0.765 Stationary
Male -5.73 -15.91;5.68 0.301 Stationary
Female 2.09 -8.96;14.48 0.716 Stationary
Manaus 4.25 -0.25;8.94 0.063 Stationary
Male 3.54 -4.13;11.83 0.365 Stationary
Female 5.38 0.42;10.58 0.034 Increasing
Palmasb 33.54 16.36;53.26 <0.001 Increasing
Male 47.84 15.90;88.60 0.003 Increasing
Female 21.30 7.51;36.85 0.003 Increasing
Porto Velho 3.19 -4.62;11.64 0.423 Stationary
Male 1.67 -7.49;11.73 0.724 Stationary
Female 3.67 -10.16;19.63 0.612 Stationary
Rio Branco 0.80 -9.05;11.72 0.876 Stationary
Male 11.57 -5.00;31.03 0.176 Stationary
Female -9.59 -21.48;4.10 0.155 Stationary
Midwest
Brasília (FD) -8.27 -12.05;-4.32 <0.001 Decreasing
Male -10.45 -14.59;-6.11 <0.001 Decreasing
Female -5.63 -11.30;0.41 0.066 Stationary
Campo Grande -10.32 -16.59;-3.57 0.004 Decreasing
Male -14.95 -24.35;-4.38 0.008 Decreasing
Female -5.91 -15.83;5.18 0.274 Stationary
Cuiabá -10.36 -14.81;-5.68 <0.001 Decreasing
Male -8.89 -16.66;-0.40 0.041 Decreasing
Female -12.08 -19.98;-3.40 0.009 Decreasing
Goiânia -8.44 -14.22;-2.27 0.009 Decreasing
Male -9.14 -19.15; 2.12 0.105 Stationary
Female -8.31 -12.08;-4.38 <0.001 Decreasing
a) Prais-Winsten Regression.
The results of the present study are corroborated with other data from Latin America. Curado et al.4 presented trends in pediatric leukemia mortality and found that Argentina, Brazil, Chile, Costa Rica, and Uruguay showed a decreasing trend in both sexes, and Mexico showed an increasing trend. When analyzing leukemia mortality in these younger populations of different Latin American countries, notwithstanding the inequalities between the different health systems, the common need stands out for specialized oncology centers to optimize health care, especially in regions where the mortality rates are seen to be growing.
In our study, only three capital cities showed an increasing trend: São Luís and Manaus among females; and Palmas in both sexes. A increasing trend in São Luís was also observed by Ribeiro et al.7 and in
Palmas by Silva et al.8 who also detected growing rates
in Belém and João Pessoa. This diverges from our study regarding the findings for these latter two capital cities. Studies suggest that lack of access to pediatric oncology treatment can generate the differences observed in mortality rates in Brazil.7,16,17 According
to Grabois et al.,16 Brazil’s South and Southeast
regions have a higher quantity of High Complexity Oncology Care Services (Cacon) funded by SUS, and this may be a possible explanation for decreasing trends found in all the capital cities of these regions, as well as for oscillations in other capital cities, or even for the growth observed in São Luís, Natal and Palmas. Ribeiro et al.7 corroborate these data when
they report in their study a correlation between the so-called "social exclusion" index (an index that includes poverty, employment, literacy, education, presence of young people and violence) and child leukemia mortality rates; i.e., mortality reduction was more pronounced in socioeconomically better-off Brazilian states.
Treatment abandonment is also an important factor capable of generating increased mortality rates. Several studies seek to discuss this theme and elucidate its probable causes.18-21 Leukemia requires long and
costly treatment, as well as requiring resources for travel to oncology centers and paying for meals and many patients - and their families - do not have social and economic support needed to maintain this routine:19,20 16 to 50% of them abandon treatment.18
The proportion of such abandonment differs, depending on whether country is a low- or
medium-high-income country: 29% versus 2% (p<0.0001), respectively.19 It should be pointed out that, after
the implementation of a social assistance program in Mexico, entitled 'Seguro Popular', there was a decrease in the percentage of treatment abandonment by pediatric patients with leukemia, approaching the levels of economically developed countries (from 21.4% to 13.3%; p=0.001).20
Worldwide, the global survival of pediatric patients with leukemia reveals significant differences among individuals with low income (49.8%) and with satisfactory income (62.9%).21 In Indonesia, a
disease-free survival rate of 45% was found among those with satisfactory financial conditions, this being significantly higher than the 11% rate found among children and adolescents with low family income (p=0.01). This implies that income is a more important determinant than formal education. To improve survival, however, there is a need for special attention to early diagnosis, infection control and education of parents/caregivers.22
The same decreasing trend in mortality from leukemia observed in our study when analyzing all the Brazilian state capital cities, both sexes and different age groups, was also found in a study conducted in the USA; its authors attributed this trend to developments in leukemia treatment over the last 10-15 years, including the optimization of specific chemotherapy
protocols for the pediatric population.23 Other
studies highlight, as a justification for this drop in mortality, chemotherapeutic protocols with reduced chemotoxicity and better diagnostic techniques, enabling targeted treatment and, consequently, strong improvement in the prognosis of leukemia.4,6
In Brazil, there have been changes in leukemia treatment over the years. Until the 1980s, acute myeloid leukemia (AML) in children was considered incurable. However, with the organization of cooperative groups working for treatment and the introduction of new drugs, there has been a reduction in mortality.24 According to a study conducted with
86 children with AML in the state of Minas Gerais in the period 1986-2000, the rate of complete disease remission was 40% until 1990 and 64% after the introduction of the German chemotherapy protocol (1991-2002), with a change in the survival rate from 6.7% to 39.4%.25
has been developing clinical trials for the treatment of acute lymphoblastic leukemia in children since 1980. With the passing of years and updating of GBTLI protocols, overall survival and event-free survival for five years reached values of 92.5% (±1.5%) and 83.6% (±2.1%), respectively. Although the regimens may vary between the different specialized centers in Pediatric Hematology, what can be observed is the effectiveness of treatment over the years, with probability of cure exceeding 80% for LLA.26
In this study, the analysis per type of leukemia showed a decreasing trend in mortality for lymphoid, myeloid and other types, and stability for some age groups in the case of lymphoid and myeloid leukemia. Our study corroborates another study27
on the trend of mortality from types of leukemia in Brazil focusing on the period 1980-2010: decreasing trend in all age ranges for other types of leukemia. In the case of lymphoid leukemia, however, its authors found an increasing linear trend in the 15-19 years age range, and stability for all other ages, while myeloid leukemia showed an increasing trend in younger age ranges (0-14 years) and stability in the other age ranges. Our findings also suggest a different trend behavior in the 10-19 age ranges for lymphoid leukemia, and in the 0-4 age range for myeloid leukemia. However, unlike the study referred to immediately above, the younger age ranges (0-4 years) showed stability, while the others (10-19 years), showed an increasing trend.
The methodological decision of this study to work only with the data from state capital cities and not with the data for Brazil as a whole, is due to the fact that these cities have records of better quality and coverage with reduced underreporting over a longer period of time. This methodological difference may, at least in part, explain the differences found between our study and that conducted by Silva et al.27
Among the limitations of this study, it should be pointed out that its object was leukemia deaths as a whole, whereby it is not possible to discriminate between deaths that are early or late, preventable or not. In addition, because it is a study based on secondary data, it must be remembered that such data are vulnerable to quality and coverage restrictions. According to a World Health Organization (WHO) publication, Brazil’s mortality data is of intermediate quality, comparable to those of countries such as
Belgium, France, Germany, Italy, Netherlands, Spain, Denmark, Switzerland and Sweden.28 The Brazilian
Ministry of Health has taken several initiatives to improve the quality SIM information and coverage, such as for example, the (i) reduction in the proportion of records of deaths from ill-defined causes, (ii) decrease in the proportion of records with unknown or blank fields and (iii) reduction in the time interval between the occurrence of events, their uptake by the system and transfer to Datasus. The state capital cities’ mortality data also provide greater coverage and better quality of death records than coverage and quality found for the country as a whole.29
The advantage of using SIM data, besides allowing analysis of time series, is that is enables identification of the magnitude of mortality rates as a Public Health problem. SIM also reflects the status of diagnosis and medical assistance provided to the population. The high degree of reliability and validity of Death Certificates input on SIM showing neoplasia as the underlying cause of death has been demonstrated by national studies.29,30
Few studies approach leukemia mortality trends in pediatric patients in Brazil. This research provides leukemia mortality rates and their trends for the pediatric population in the Brazilian state capital cities between 1980 and 2015. In addition to presenting important indicators of health care system quality, its findings will assist further epidemiological studies. Evaluation of the mortality trend is a useful tool for monitoring a population’s epidemiological profile, measuring the impact of treatment and the impact of the health system on that population, in addition to informing Public Health management measures.
Authors' contributions
References
1. Chatenoud L, Bertuccio P, Bosetti C, Levi F, Negri E, La Vecchia C. Childhood cancer mortality in America, Asia, and Oceania, 1970 through 2007. Cancer. 2010 Nov;116(21):5063-74.
2. Steliarova-Foucher E, Colombet M, Ries LAG, Moreno F, Dolya A, Bray F, et al. International incidence of childhood cancer, 2001-10: a population-based registry study. Lancet Oncol 2017 Jun;18(6):719-31.
3. Instituto Nacional de Câncer José Alencar Gomes da Silva. Incidência, mortalidade e morbidade hospitalar por câncer em crianças, adolescentes e adultos jovens no Brasil: informações dos registros de câncer e do sistema de mortalidade [Internet]. Rio de Janeiro: Instituto Nacional de Câncer José Alencar Gomes da Silva; 2016 [citado 2017 fev 17]. 412 p. Disponível em: http://www.inca.gov.br/wcm/incidencia/2017/
4. Curado MP, Pontes T, Guerra-Yi ME, Cancela MC. Leukemia mortality trends among children, adolescents, and young adults in Latin America. Rev Panam Salud Publica. 2011 Feb;29(2):96-102.
5. Ries LAG, Smith MA, Gurney JG, Linet M, Tamra T, Young JL, et al. Cancer incidence and survival among children and adolescents: united states SEER program 1975-1995 [Internet]. Bethesda (MD): Cancer Statistics Branch;1999 [cited 2016 May 09]. 182 p. Available in: https://seer.cancer.gov/archive/ publications/childhood/childhood-monograph.pdf
6. Bertuccio P, Bosetti C, Malvezzi M, Levi F, Chatenoud L, Negri E, et al. Trends in mortality from leukemia in Europe: an update to 2009 and a projection to 2012. Int J Cancer. 2013 Jan;132(2):427-36.
7. Ribeiro KB, Lopes LF, Camargo B. Trends in childhood leukemia mortality in Brazil and correlation with social inequalities. Cancer. 2007 Oct;110(8):1823–31.
8. Silva DS, Mattos IE, Teixeira LR. Tendência de mortalidade por leucemias e linfomas em menores de 20 anos, Brasil. Rev Bras Cancerol. 2013 abri-maio-jun;59(2):165-73.
9. Doll R, Payne P, Waterhouse J. Comparison between registries and age-standardized rates. In: Doll R, Payne P, Waterhouse J, editors. Cancer incidence in five continents: a technical report. Berlin: Springer-Verlag; 1966.
10. Antunes JLF, Cardoso MRA. Uso da análise de séries temporais em estudos epidemiológicos. Epidemiol Serv Saúde. 2015 jul-set;24(3):565-76.
11. Ferman S, Santos MO, Ferreira JM, Reis RS, Oliveira JFP, Pombo-de-Oliveira MS, et al. Childhood cancer mortality trends in Brazil, 1979 – 2008. Clinics. 2013 Feb;68(2):219-24.
12. Ward E, DeSantis C, Robbins A, Kohler B, Jemal A. Childhood and adolescent cancer statistics, 2014. CA Cancer J Clin. 2014 Mar-Apr 64(2):83-103.
13. Couto AC, Ferreira JD, Koifman RJ, Monteiro GTR, Pombo-de-Oliveira MS, Koifman S. Trends in childhood leukemia mortality over a 25-year period. J Pediatr. 2010 Sep-Oct;86(5):405-10.
14. Brandalise SR, Pinheiro VR, Aguiar SS, Matsuda EI, Otubo R, Yunes JA, et al. Benefits of the intermittent use of 6-mercaptopurine and methotrexate in maintenance treatment for low-risk acute lymphoblastic leukemia in children: randomized trial from the Brazilian Childhood Cooperative Group – protocol ALL-99. J Clin Oncol. 2010 Apr;28(11):1911-8.
15. Howlader N, Noone AM, Krapcho M, Miller D, Bishop K, Altekruse SF, et al. SEER cancer statistics review, 1975-2013 [Internet]. Bethesda (MD): National Cancer Institute; 2016 [cited 2017 Feb 27]. Available in: https://seer.cancer.gov/csr/1975_2013/
16. Grabois MF, Oliveira EXG, Carvalho MS. Childhood cancer and pediatric oncologic care in Brazil: access and equity. Cad Saúde Pública. 2011 set;27(9):1711-20.
17. La Vecchia C, Levi F, Lucchini F, Lagiou P, Trichopoulos D, Negri E. Trends in childhood cancer mortality as indicators of the quality of medical care in the developed world. Cancer. 1998 Nov;83(10):2223-7.
18. Arora RS, Eden T, Pizer B. The problem of treatment abandonment in children from developing
countries with cancer. Pediatr Blood Cancer. 2007 Dec;49(7):941-6.
19. Gupta S, Yeh S, Martiniuk A, Lam CG, Chen H-Y, Liu Y-L, et al. The magnitude and predictors of abandonment of therapy in paediatric acute leukaemia in middle-income countries: a systematic review and meta-analysis. Eur J Cancer. 2013 Jul;49(11):2555-64.
21. Jabeen K, Ashraf MS, Iftikhar S, Belgaumi AF. The impact of socioeconomic factors on the outcome of childhood acute lymphoblastic leukemia (ALL) treatment in a low/middle income country (LMIC). J Pediatr Hematol Oncol. 2016 Nov;38(8):587-96.
22. Mostert S, Sitaresmi MN, Gundy CM, Sutaryo, Veerman AJ. Influence of socioeconomic status on childhood acute lymphoblastic leukemia treatment in Indonesia. Pediatrics. 2006 Dec;118(6):e1600-06.
23. Smith MA, Altekruse SF, Adamson PC, Reaman GH, Seibel NL. Declining childhood and adolescent cancer mortality. Cancer. 2014 Aug;120(16):2497-506.
24. Pereira WV. Leucemia mielocítica aguda da infância e adolescência–fracassos e vitórias. Rev Bras Hematol Hemoter. 2006 out-dez;28(4):239-45.
25. Viana MB, Cunha KC, Ramos G, Murao M. Acute myeloid leukemia in childhood: 15-year experience in a single institution. J Pediatr. 2003 Dec;79(6):489-96.
26. Pombo de Oliveira MS, Koifman S, Vasconcelos GM, Emerenciano M, Oliveira Novaes C; Brazilian Collaborative Study Group of Infant Acute Leukemia. Development and perspective of current Brazilian studies on the epidemiology of childhood leukemia. Blood Cells Mol Dis. 2009 Mar-Apr;42(2):121-5.
27. Silva FF, Zandonade E, Zouain-Figueiredo GP. Analysis of childhood leukemia mortality trends in Brazil, from 1980 to 2010. J Pediatr (Rio J). 2014 nov-dec;90(6):587-92.
28. Fonseca LAM, Eluf-Neto J, Wunsch Filho V. Trends of cancer mortality in Brazilian state capitals, 1980-2004. Rev Assoc Médica Bras. 2010;56(3):309-12.
29. Miranda Filho AL, Meyer A, Monteiro GTR. Validação da causa básica de óbito por neoplasias selecionadas na microrregião Serrana, Rio de Janeiro, Brasil. Cad Saúde Coletiva. 2014;22(3):246-51.
30. Fajardo S, Aerts DRGC, Bassanesi SL. Acurácia da equipe do Sistema de Informações sobre Mortalidade na seleção da causa básica do óbito em capital no Sul do Brasil. Cad Saúde Pública. 2009 out;25(10):2218-28.
Received on 23/08/2017