ABSTRACT: This study was conducted to investigate the effects ofnutrient and salinity concentrations on the quality of deep-flow technique hydroponic system cultivated cherry tomatoes (Lycopersicon esculentum Mill ‘Unicorn’). The conditions were: (1) control (NS-1 × nutrient Solution, Electrical Conductivity – EC: 2.5 mS∙cm–1);
(2) 2 × NS (2 × NS-Double NS, EC: 5 mS∙cm–1); (3) NS + 4.23 mM NaCl
(NaCl-Sodium Chloride, EC: 5 mS∙cm–1); and (4) NS + 13.70 mM Sea
Water – SW (EC: 7.5 mS∙cm–1). NS + 13.70 mM SW treatment showed
the lowest fresh weight loss.Visual quality as well as shelf life was the longest in NS (1 × nutrient solution) treated tomato fruits. The longest
POST HARVEST TECHNOLOGY
-
Article
Nutrient and salinity concentrations effects on
quality and storability of cherry tomato fruits
grown by hydroponic system
Mohammad Zahirul Islam1,2, Mahmuda Akter Mele1, Ki-Young Choi3, Ho-Min Kang1,2*
1.Kangwon National University - Division of Horticulture and Systems Engineering - Program of Horticulture - Chuncheon, Gangwon-do, Republic of Korea.
2.Kangwon National University - Agriculture and Life Science Research Institute - Chuncheon, Gangwon-do, Republic of Korea 3. Kangwon National University - Department of Controlled Agriculture - Chuncheon, Gangwon-do, Republic of Korea
*Corresponding author: [email protected]
Received: May 28, 2017 – Accepted: Sept. 18, 2017
shelf life at 5 °C, 11 °C, and 24 °C were 21, 16, and 8 days, respectively, in NS (1 × nutrient solution) treated tomato fruits. The highest firmness was recorded in NS (1 × nutrient solution) treated tomato fruits, which was retained after storage. Moreover, NS + 13.70 mM SW treatment increased the cherry tomato fruit’s quality, especially soluble solids and sugar contents. These results indicate that salinity concentration has effect the soluble solids and sugar of cherry tomato fruits. In addition, nutrient concentration influenced the shelf life and firmness of cherry tomato fruits.
INTRODUCTION
Currently, salinity treatment of tomato cultivation is taking place in Korea and Japan for enhancing soluble solids. Salinity influenced size and number of marketable fruits, but increased fruit quality by increasing total soluble solids (TSS) and sugar content (Del Amor et al. 2001). TSS is a vital quality criterion for tomato paste processing, serves and price setting for producer (Cuartero and Fernández-Muñoz 1998). Increasing salinity improved various aspects of tomato fruit quality, such as proportion of extra fruits (visual quality), soluble solids, and titratable acidity, but decreased fruit size (Magán et al. 2008). TSS was higher in the plants subjected to the salinity treatments (Borghesi et al. 2011). Regardless of the salinization time treatments, tomato fruits of salt-treated plants showed significant upturns in concentration of sugars, total soluble solids and total acid content, since fruit pH decreased (Del Amor et al. 2001). Hydroponically produced tomatoes with sodium chloride enriched nutrient solution had higher consumer preference, expanded sweetness and flavor, but also produced a harder tomato fruit (Petersen et al. 1998). Yield reduction occurred in the flowering and fruiting stages of salinity-treated tomato fruits, due to reduction of fruit number in lieu of fruits size, but salinity increased fruit quality that depends on developmental stage and application time (Zhang et al. 2017).
The high-quality tomato, which has higher soluble solids, should be needed in the high-end market. Saline cultural condition helps unification some fruit quality of many crops. We used three distribution temperatures (5 °C, 11 °C, and 24 °C). Typically during cold supply chains used to export produce to Hong Kong and Japan by ship, 5 °C and 11 °C is considered the standard temperature, for local distribution of produce, 24 °C is ideal. This study was conducted to demonstrate the performance of nutrient and salinity concentrations on quality of deep-flow cultivated cherry tomato ‘Unicorn’ in different storage temperatures (5 °C, 11 °C, and 24 °C).
MATERIAL AND METHODS
Cherry tomatoes (Lycopersicon esculentum Mill. cv. ‘Unicorn’) were grown with a deep-flow technique (DFT) hydroponic system in a greenhouse during the winter
in Gangwon province. Nutrient solution was supplied based on the Japanese Horticultural Experiment Station,
which was adjusted to 2.5 dS·m–1 EC and 5.8 – 6.2 pH
(Sato et al. 2006). The treatments were: (1) control (NS-1 × Nutrient Solution, Electrical Conductivity
– EC: 2.5 mS∙cm–1); (2) 2 × NS (2×NS-Double NS,
EC: 5 mS∙cm–1); (3) NS + 4.23 mM NaCl (NaCl-Sodium
Chloride, EC: 5 mS∙cm–1); and (4) NS + 13.70 mM Sea
Water – SW (EC: 7.5 mS∙cm–1). For all treatments, the
nutrients were supplied in DFT system that included PVC (polyvinyl chloride) trays, which were 4 m long, 0.15 m wide and 0.20 m deep and regulated by an electric pump
set at a rate of 60 L∙min−1. Fruits were treated from third
to seventh trusses in tomato plants. Light red maturity stage of tomatoes was harvested to measure harvest time (20 °C) quality and the rest of them were stored in commercial size carton box (34 cm × 24 cm × 13 cm) at 5 °C, 11 °C, and 24 °C temperatures with 85% relative humidity (Islam et al. 2013) to measure the quality of cherry tomato.
Mineralswere quantified according to Simsek and
Aykut (2007) and Islam et al. (2016) by using inductively coupled plasma-atomic emission spectroscopy (Integra XL Dual, GBC, and Melbourne, Victoria) following acidic digestion.
The respiration and ethylene production were measured by a PBI Dansensor (Check Mate 9900, Denmark) and a GC-2010 Shimadzu (Shimadzu Corporation, Japan), respectively. A GC-2010 Shimadzu was equipped with a wax column BP 20 (30 m × 0.25 mm × 0.25 µm, SGE Analytical Science, Australia), and a flame ionization detector. Detector and injector were set at 127 °C, the
ovens were set at 50 °C, and 0.67 mL.s–1 was the carrier
gas (N2) flow rate (Islam et al. 2016). Gas samples were
removed after three hours at the harvest time (20 °C) and six hours on the final storage day (24 °C, 11 °C and 5 °C) from a closed 125 mL jar containing two cherry tomatoes.
1 = waste) and five panel members assessed the visual quality of the tomatoes during storage (Islam et al. 2016). Penetrometer (DFT-01, TR snc, Italy) was used to measure fruit firmness (N). A Chroma Meter CR 400 Model (Konica Minolta Sensing, Inc., Japan) was used to measure the tomatoes’ skin color. Tomatoes a* and b* value indicate the degree of redness and yellowness, respectively, in Minolta Chroma Meter (Mele et al. 2017). Redness of tomatoes were noted as a* / b* values. Lycopene content was measured by UV-Spectrophotometer (Shimadzu
Corporation, Tokyo, Japan; Fish et al.2002). Soluble
solids were assessed by Refractometer (Atago U.S.A.
Inc., U.S.A.); results are mentioned in °Brix. Titratable
acidity was analyzed by DL 22 Food Analyzer (Metter Toledo Ltd., Korea); results are mentioned as percentage of citric acid. Sugars analysis was conducted by a Waters HPLC (Waters Associates, Milford, MA, USA) and the
column was C18 (4.6 cm × 250 mm, 5 μm, Agilent, USA)
at 265 nm. The mobile phase flow rates 0.50 mL∙min–1
with 50 mg∙L–1 Ca-EDTA (Calcium di-sodium ethylene
diamine tetra-acetate) in HPLC grade water solution (Radi et al. 2003).
SPSS V. 16 (SPSS Inc., Chicago, USA) was used to perform the statistical analysis of data. Differences between conditions were analyzed by a DMRT following a one-way ANOVA.
RESULT AND DISCUSSIONS
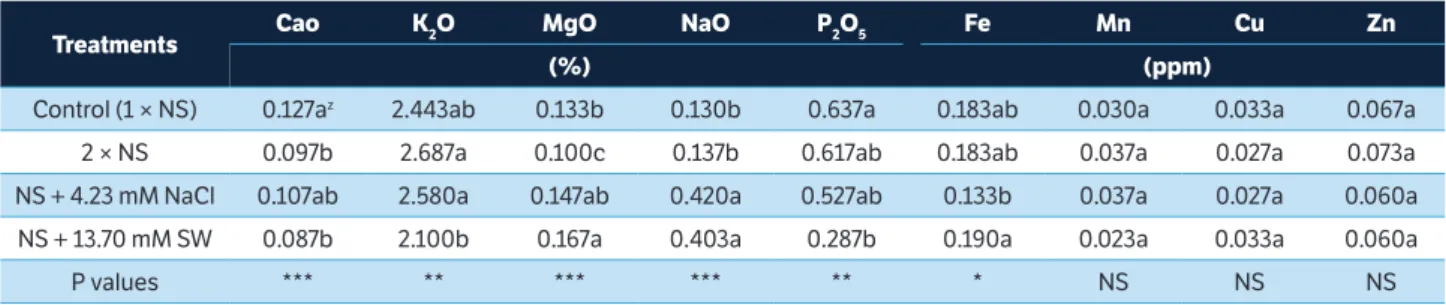
Salinity-treated tomato fruits showed higher sodium (Na) content compared with NS (1 × nutrient solution) and, as a result, those treated tomato fruits were smaller. This finding in supported by Mitchell et al. (1991), who demonstrated that decreased fruit growth due to salinity could be caused
by lower mineral uptake during the fruit’s development. Ca appears to have a major role in tomato fruit firmness (Islam et al. 2016). Our results showed that NS (1 × nutrient solution)
treated tomato fruits highly accumulated Ca2+ content
(Table 1). High EC had adverse effect on crop growth and
yields (Fallovo et al. 2009) and less Ca2+ accumulates in high
EC sweet pepper fruit (Tadesse et al. 1999b). As a result, total
Ca2+ content remained low in salinity and double-strength
nutrient-solution-treated tomato fruits. The diminished
uptake of Ca2+ content likely occurred due to Ca2+ and
K+ uptake competition by root (Kirkby 1979) and osmotic
adjustments that affect water uptake by root (Tadesse et al.
1999b). Na+ reduces Ca2+ transport and mobility in the plant,
which influences the quality in vegetative and reproductive
organs, and salinity directly affects nutrient uptake like Na+
reducing K+ uptake and Cl– reducing NO
3– uptake (Grattan
and Grieve 1998).
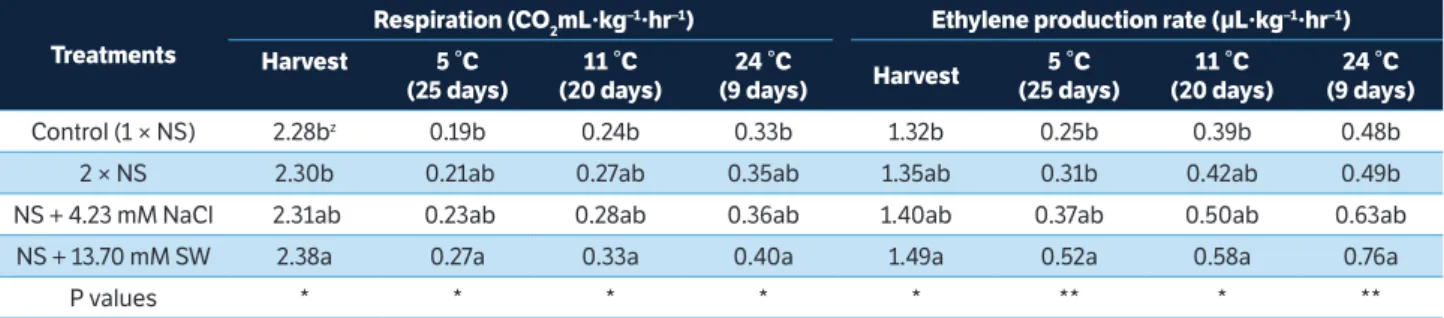
Tomatoes treated with NS + 13.70 mM SW had a higher respiration and ethylene production than the control at harvest time (20 °C; i.e., the light red stage). Tomato fruits grown in saline conditions had higher respiration and ethylene production than those in the control condition (Hobson 1988). Moreover, high EC condition increased the respiration in sweet pepper due to osmotic adjustment that cannot retain water and turgor (Tadesse et al. 1999a). The NS + 13.70 mM SW treated tomato fruits affirmed a higher respiration and ethylene production after storage, which can ripen the fruit and raise its quality. Given that the NS + 13.70 mM SW treated tomato fruits are smaller than those in other treatments, it can increase the respiration and ethylene production (Table 2).
The NS (1 × nutrient solution) treated tomatoes resulted in diminished fresh weight losses due to less moisture loss in the fruit. The fresh weight loss increased as increasing ionic strength due to higher respiration and transpiration.
Treatments Cao K2O MgO NaO P2O5 Fe Mn Cu Zn
(%) (ppm)
Control (1 × NS) 0.127az 2.443ab 0.133b 0.130b 0.637a 0.183ab 0.030a 0.033a 0.067a
2 × NS 0.097b 2.687a 0.100c 0.137b 0.617ab 0.183ab 0.037a 0.027a 0.073a
NS + 4.23 mM NaCl 0.107ab 2.580a 0.147ab 0.420a 0.527ab 0.133b 0.037a 0.027a 0.060a
NS + 13.70 mM SW 0.087b 2.100b 0.167a 0.403a 0.287b 0.190a 0.023a 0.033a 0.060a
P values *** ** *** *** ** * NS NS NS
Table 1. Mineral content of cherry tomato fruits treated by nutrient and salinity concentrations.
zMean separation within columns by Duncan’s multiple range tests (DMRT) (n = 5). NS, *, **, ***: not significant, and significant at p ≤ 0.05, 0.01 and 0.001,
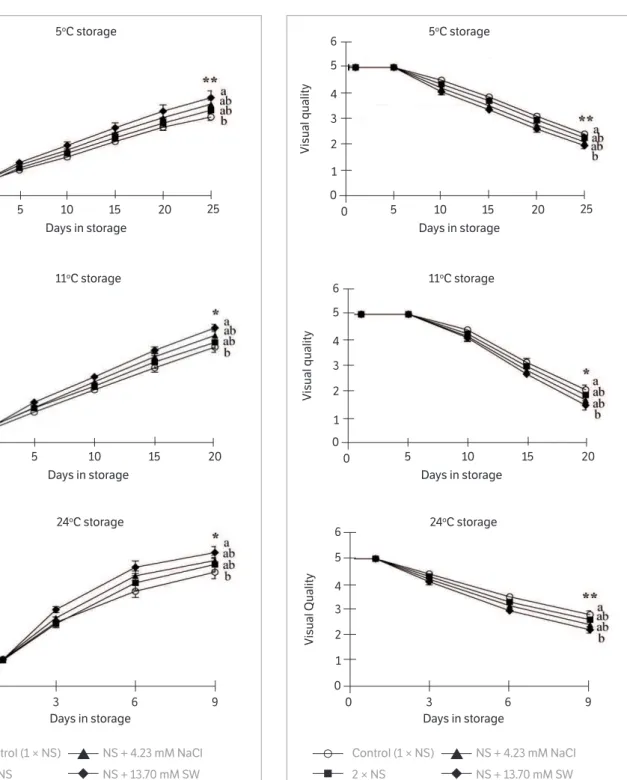
Given that smaller size fruits have large surface areas, they produce more respiration, transpiration (water vapor), and ethylene (Kays and Paull 2004), thus salinity and double-strength-treated smaller tomato fruits lose fresh weight during storage (Figure 1). The longest shelf life was observed in tomato fruits in NS (1 × nutrient solution) treatment because of maintaining freshness and marketable visual quality (≥ 3). The shelf life of NS (1 × nutrient solution), 2 × NS, NS + 4.23 mM NaCl, and NS + 13.70 mM SW-treated tomatoes were, accordingly, 21, 20, 19, 18 days at 5 °C, 16, 15, 14, 13 days at 11 °C, and 8, 7, 6, 5 days at 24 °C (Figure 2). Salinity considerably shortened shelf life by increasing ethylene production in tomato fruits (Mizrahi 1982). The NS (1 × nutrient solution) treated tomato showed the highest marketable fruit and marketable fruits weight whereas the NS + 13.70 mM SW treated tomato fruits had shown the lowest due to high salinity concentration (Table 3).
In previous research, salinity reduced the strawberry yield due to decreased water content in the fruit (Awang et al. 1993) and high ionic strength in nutrient solution decreased sweet pepper fruit size because of reduced water content that inhibits cell division and cell elongation (Tadesse et al. 1999a). In our experiment, both salinity and double-strength of the nutrient solution decreased the marketable fruit and marketable fruits weight of tomato.
Color is an important fruit quality parameter, as it impacts seller, buyer, and consumer choices. At the harvest time, color did not show significant difference across the treatment conditions as we selected consistent maturity stage (light red) throughout this experiment; however, color did exhibit significant difference after storage. The highest color development was recorded by the NS + 13.70 mM SW treated tomato fruits because of the increased respiration and ethylene production, which may help to ripen the fruit quickly (Table 4). This finding is in line with Borghesi et al.
(2011), who suggested that increased salinity enhanced the color development in tomato fruits. In addition, high EC in nutrient solution increased in sweet pepper color because it helps ripening process and maturation (Tadesse et al. 1999b).
The highest firmness was recorded in the NS (1 × nutrient solution) treated tomato fruits at harvest time due to high Ca content (Table 4) and the highest firmness retained by tomato after storage because of less ethylene production that induce polygalacturonase synthesis activity (Grierson and Tucker 1983). Fruit softening mainly occurs due to middle lamella degradation of cortical parenchyma cells walls with upsurge pectin release (Perkins-Veazie 1995). The NS (1 × nutrient solution) treated tomato fruits perhaps demonstrate slow degradation and retain the firmness as it contains the maximum Ca content. Among the salinity treatments, the NS + 4.23 mM NaCl treated tomato fruits performed the highest and the NS + 13.70 mM SW treated tomato fruits obtained the lowest firmness. Higher salinity restricted to deposit of Ca-pectate and Ca-phosphate in the tissue, limiting cell wall development (Minamide and
Ho 1993) and increment salinity reduces Ca2+ uptake and
xylem transport in tomatoes (Adams and Ho 1993). In the current study, the NS + 13.70 mM SW treated tomato fruits
showed the lowest Ca2+ assimilation because higher Na content
suppressed Ca2+ uptake, as a result, fruits cannot maintain
firmness. High ionic strength of nutrient solution showed
less firmness due to suppressed to Ca2+ uptake (Tadesse
et al. 1999a).
The maximum lycopene content was confirmed in the NS + 13.70 mM SW treated tomato fruits likely due to higher respiration and ethylene production. Salinity-treated tomato fruits increase lycopene content because salinity treatment stimulates respiration and ethylene production, which accelerates ripening (Woo and Kang 2006).
Treatments
Respiration (CO2mL·kg–1∙hr–1) Ethylene production rate (µL·kg–1∙hr–1)
Harvest 5 °C (25 days)
11 °C (20 days)
24 °C
(9 days) Harvest
5 °C (25 days)
11 °C (20 days)
24 °C (9 days)
Control (1 × NS) 2.28bz 0.19b 0.24b 0.33b 1.32b 0.25b 0.39b 0.48b
2 × NS 2.30b 0.21ab 0.27ab 0.35ab 1.35ab 0.31b 0.42ab 0.49b
NS + 4.23 mM NaCl 2.31ab 0.23ab 0.28ab 0.36ab 1.40ab 0.37ab 0.50ab 0.63ab
NS + 13.70 mM SW 2.38a 0.27a 0.33a 0.40a 1.49a 0.52a 0.58a 0.76a
P values * * * * * ** * **
Table 2. Respiration and ethylene production of cherry tomatoes at harvest time (20 °C) and after storage at 5 °C, 11 °C, and 24 °C.
8 7 6 5 4 3 2 1 0
0 3 6 9
Days in storage
Control (1 × NS)
2 × NS
NS + 4.23 mM NaCl
NS + 13.70 mM SW
24oC storage
F resh w eight los s (%) 8 7 6 5 4 3 2 1 0
0 5 10 15 20
Days in storage 11oC storage
F resh w eight los s (%) 8 7 6 5 4 3 2 1 0
0 5 10 15 20 25
Days in storage 5oC storage
F resh w eight los s (%) 6 5 4 3 2 1 0
0 3 6 9
Days in storage
Control (1 × NS)
2 × NS
NS + 4.23 mM NaCl
NS + 13.70 mM SW
24oC storage
Vis ual Quality 6 5 4 3 2 1 0
0 5 10 15 20
Days in storage
11oC storage
Vis ual quality 6 5 4 3 2 1 0
0 5 10 15 20 25
Days in storage 5oC storage
Vis
ual quality
Figure 2. Changes of cherry tomatoes visual quality at 5 °C, 11 °C and 24 °C. Scale of visual quality: 5 = excellent; 4 = very good; 3 = marketable, good; 2 = bad; and 1 = waste. Each data point is the mean of ten single fruit replicates ± standard error. *, **: significant at p ≤ 0.05 and 0.01, respectively, of Duncan’s multiple range test (DMRT).
Figure 1. Changes of cherry tomatoes fresh weight loss at 5 °C, 11 °C and 24 °C. Each data point is the mean of ten single fruit replicates ± standard error. *, **: significant at p ≤ 0.05 and 0.01, respectively, of Duncan’s multiple range test (DMRT).
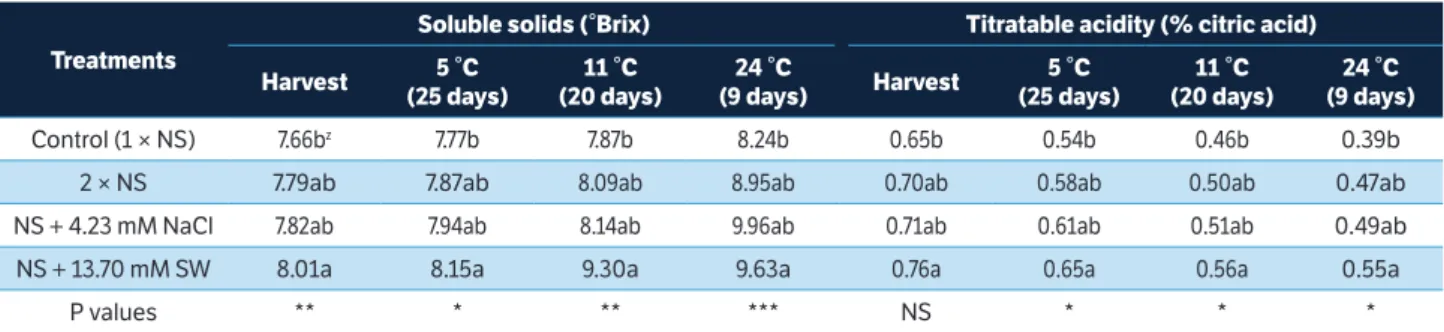
Soluble solids and titratable acidity are important factors for the taste and flavor of tomato fruits. In previous research, increasing salinity improved soluble solids of tomatoes (Magán et al. 2008). Likewise, in this study, higher salinity improved soluble solids (Table 5). Escalation in acidity of
the fruit could be due to the higher Na+ and / or Cl– contents
raised soluble solids and reduced water content in salinity condition (Adams and Ho 1989).
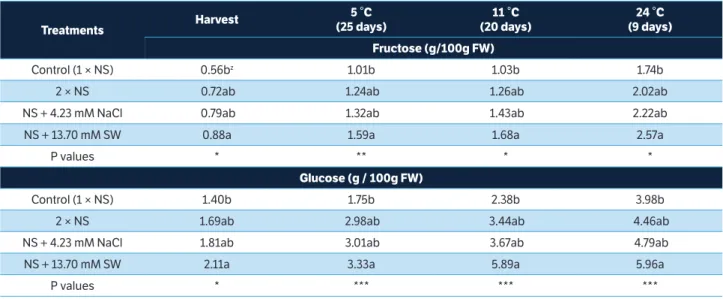
The fructose and glucose were significantly higher in the NS + 13.70 mM SW treated tomato fruits compared with
zMean separation within columns by Duncan’s multiple range tests (DMRT) (n = 10). NS, *, **, ***: not significant, and significant at p ≤ 0.05, 0.01 and 0.001,
respectively.
Table 3. Marketable fruits (%) and marketable fruits weight (g/fruit) of cherry tomato treated by nutrient and salinity concentrations.
Treatments Marketable fruits (%) Marketable fruits weight (g/fruit)
Control (1 × NS) 93.20az 13.17a
2 × NS 92.81a 11.22ab
NS + 4.23 mM NaCl 92.67a 11.94ab
NS + 13.70 mM SW 92.21a 9.60b
P values NS *
zMean separation within columns by Duncan’s multiple range tests (DMRT) (n = 5). NS, *: not significant, and significant at p ≤ 0.05, respectively.
Table 4. Color, firmness, and lycopene of cherry tomatoes at harvest time (20 °C) and after storage at 5 °C, 11 °C and 24 °C.
Treatments Harvest
5 °C (25 days)
11 °C (20 days)
24 °C (9 days) Color (a* / b*)
Control (1 × NS) 0.81az 0.89b 0.98b 0.99b
2 × NS 0.82a 0.93ab 1.03ab 1.04ab
NS + 4.23 mM NaCl 0.83a 0.95ab 1.02ab 1.04ab
NS + 13.70 mM SW 0.84a 0.98a 1.06a 1.08a
P values NS * ** **
Treatments Firmness (N)
Control (1 × NS) 18.90a 13.68a 14.59a 12.91a
2 × NS 17.83ab 12.55ab 13.18ab 11.71ab
NS + 4.23 mM NaCl 18.32ab 13.08ab 13.78ab 12.03ab
NS + 13.70 mM SW 16.42b 11.12b 11.91b 10.73b
P values * ** * *
Treatments Lycopene (mg/kg FW)
Control (1 × NS) 115.07b 163.44b 168.84b 171.36b
2 × NS 117.35b 168.27ab 174.58ab 178.33ab
NS + 4.23 mM NaCl 120.48ab 172.98ab 183.92ab 187.16ab
NS + 13.70 mM SW 137.89a 197.92a 186.48a 196.07a
P values ** * ** *
zMean separation within columns by Duncan’s multiple range tests (DMRT) (n = 10). NS, *, **: not significant, and significant at p ≤ 0.05 and 0.01, respectively.
Table 5. Soluble solids and titratable acidity of cherry tomatoes at harvest time (20 °C) and after storage at 5 °C, 11 °C and 24 °C.
Treatments
Soluble solids (°Brix) Titratable acidity (% citric acid)
Harvest 5 °C (25 days)
11 °C (20 days)
24 °C
(9 days) Harvest
5 °C (25 days)
11 °C (20 days)
24 °C (9 days)
Control (1 × NS) 7.66bz 7.77b 7.87b 8.24b 0.65b 0.54b 0.46b 0.39b
2 × NS 7.79ab 7.87ab 8.09ab 8.95ab 0.70ab 0.58ab 0.50ab 0.47ab
NS + 4.23 mM NaCl 7.82ab 7.94ab 8.14ab 9.96ab 0.71ab 0.61ab 0.51ab 0.49ab
NS + 13.70 mM SW 8.01a 8.15a 9.30a 9.63a 0.76a 0.65a 0.56a 0.55a
P values ** * ** *** NS * * *
CONCLUSION
The highest firmness and shelf life was demonstrated in
the NS (1 × nutrient solution) tomato fruits because Ca2+
content that can suppress respiration and ethylene production. Moreover, the NS + 13.70 mM SW treated tomato fruits performed the highest lycopene, soluble solids, fructose and glucose because these treated tomato fruits developed red
color quickly as suppressed to uptake Ca2+ content.
ACKNOWLEDGEMENTS
This research was aided by the Export Promotion Te ch nol o g y D e vel opme nt Pro g r am ( 3 1 4 0 2 7 - 3 ) ,
IPET (Korea Institute of Planning & Evaluation for Technology), Agriculture, Food and Rural Affairs Ministry, Korea.
ORCID IDs
M. Z. Islam
http://orcid.org/0000-0001-7688-463X
M. A. Mele
https://orcid.org/0000-0002-7886-1228
K. Choi
https://orcid.org/0000-0003-4916-0809
H. Kang
https://orcid.org/0000-0003-1703-4699
Treatments Harvest
5 °C (25 days)
11 °C (20 days)
24 °C (9 days) Fructose (g/100g FW)
Control (1 × NS) 0.56bz 1.01b 1.03b 1.74b
2 × NS 0.72ab 1.24ab 1.26ab 2.02ab
NS + 4.23 mM NaCl 0.79ab 1.32ab 1.43ab 2.22ab
NS + 13.70 mM SW 0.88a 1.59a 1.68a 2.57a
P values * ** * *
Glucose (g / 100g FW)
Control (1 × NS) 1.40b 1.75b 2.38b 3.98b
2 × NS 1.69ab 2.98ab 3.44ab 4.46ab
NS + 4.23 mM NaCl 1.81ab 3.01ab 3.67ab 4.79ab
NS + 13.70 mM SW 2.11a 3.33a 5.89a 5.96a
P values * *** *** ***
Table 6. Fructose and glucose of cherry tomatoes at harvest time (20 °C) and after storage at 5 °C, 11 °C and 24 °C.
zMean separation within columns by Duncan’s multiple range tests (DMRT) (n = 5). *, **, ***: significant at p ≤ 0.05, 0.01 and 0.001, respectively.
Adams, P. and Ho, L. C. (1989). Effects of constant fluctuating salinity on the yield, quality and calcium status of tomatoes. Journal of Horticultural Science, 64, 725-732. https://doi.org/ 10.1080/14620316.1989.11516015.
Adams, P. and Ho, L. C. (1993). Effects of environment on the uptake and distribution of calcium in tomato and on the incidence of blossom-end rot. In Fragozo M. A. C., Van Beusichem M. L.
REFERENCES
and Houwers A. (Eds.), Optimization of plant nutrition (p. 583-588).Developments in plant and soil sciences, 53. Springer Dordrecht. https://doi.org/10.1007/978-94-017-2496-8_90.
Borghesi, E., González-Miret, M. L., Escudero-Gilete, M. L., Malorgio, F., Heredia, F. J. and Meléndez-Martínez, A. J. (2011). Effects of salinity stress on carotenoids, anthocyanins, and color of diverse tomato genotypes. Journal of Agricultural and Food Chemistry, 59, 11676 -11682. https://doi.org/10.1021/jf2021623.
Cuartero, J. and Fernández-Muñoz, R. (1998). Tomato and salinity. Scientia Horticulturae, 78, 83-125. https://doi.org/10.1016/ S0304-4238(98)00191-5.
Del Amor, F. M., Martinez, V. and Cerdá, A. (2001). Salt tolerance of tomato plants as affected by stage of plant development. HortScience, 36, 1260-1263.
Fallovo, C., Rouphael, Y., Rea, E., Battistelli, A. and Colla, G. (2009). Nutrient solution concentration and growing season affect yield and quality of Lactuca sativa L. var. acephala
in floating raft culture. Journal of the Science of Food and Agriculture, 89, 1682-1689. https://doi.org/10.1002/jsfa.3641.
Fish, W. W., Perkins-Veazie, P. and Collins, J. K. (2002). A quantitative assay for lycopene that utilizes reduced volumes of organic solvents. Journal of Food Composition and Analysis,
15, 309-317. https://doi.org/10.1006/jfca.2002.1069.
Grattan, S. R. and Grieve, C. M. (1998). Salinity – mineral nutrient relations in horticultural crops. Scientia Horticulturae, 78, 127-157. https://doi.org/10.1016/S0304-4238(98)00192-7.
Grierson, D. and Tucker, G. A. (1983). Timing of ethylene and polygalacturonase synthesis in relation to the control of tomato fruit ripening. Planta, 157, 174-179. https://doi.org/10.1007/ BF00393652.
Hobson, G. E. (1988). Pre- and post-harvest strategies in the production of high quality tomato fruit. Applied Agricultural Research, 3, 282-287.
Islam, M. Z., Mele, M. A., Baek, J. P. and Kang, H. M. (2016). Cherry tomato qualities affected by foliar spraying with boron and calcium. Horticulture, Environment, and Biotechnology,
57, 46-52. https://doi.org/10.1007/s13580-016-0097-6.
Islam, M. Z., Baek, J. P., Kim, Y. S. and Kang, H. M. (2013). Characteristics of chilling symptoms of cherry tomato compared to beefsteak tomato harvested at different ripening stages. Journal of Pure and Applied Microbiology,7, 703-709.
Kays, J. S. and Paull, E. R. (2004). Postharvest biology. Athens: Exon Press.
Kirkby, E. A. (1979). Maximizing calcium uptake by plants. Communications in Soil Science and Plant Analysis, 10, 89-113.
https://doi.org/10.1080/00103627909366881.
Magán, J. J., Gallardo, M., Thompson, R. B. and Lorenzo, P. (2008). Effects of salinity on fruit yield and quality of tomato grown in soil-less culture in greenhouses in Mediterranean climate conditions. Agricultural Water Management, 95, 1041-1055. https://doi.org/10.1016/j.agwat.2008.03.011.
Mele, M. A., Islam, M. Z., Baek, J. P. and Kang, H. M.(2017). Quality, storability, and essential oil content of Ligularia fischeri
during modified atmosphere packaging storage. Journal of Food Science and Technology, 54, 743-750. https://doi. org/10.1007/s13197-017-2514-y.
Minamide, R. T. and Ho, L. C. (1993). Deposition of calcium compounds in tomato fruit in relation to calcium transport. Journal of Horticultural Science, 68, 755-762. https://doi.org/ 10.1080/00221589.1993.11516409.
Mitchell, J. P., Shennan, C. and Grattan, S. R. (1991). Developmental changes in tomato fruit composition in response to water deficit and salinity. Physiologia Plantarum, 83, 177-185.
https://doi.org/10.1111/j.1399-3054.1991.tb01299.x.
Mizrahi, Y. (1982). Effect of salinity on tomato fruit ripening. Plant Physiology, 69, 966-970. https://doi.org/10. 1104/ pp. 69. 4. 966.
Perkins-Veazie, P. (1995). Growth and ripening of strawberry fruit. In Janick J. (Ed.), Horticultural Reviews, 17 (p. 267-297). Oxford: John Wiley & Sons, Inc. https://doi.org/10.1002/9780470650585. ch8.
Petersen, K. K., Willumsen, J. and Kaack, K. (1998). Composition and taste of tomato as affected by increased salinity and different salinity sources. The Journal of Horticultural Science and Biotechnology, 73, 205-215. https://doi.org/10.1080/146 20316.1998.11510966.
Radi, M., Mahrouz, M., Jaouad, A. and Amiot, M. J. (2003). Influence of mineral fertilization (NPK) on the quality of apricot fruit (cv. Canino). The effect of the mode of nitrogen supply. Agronomie, 23, 737-745. https://doi.org/10.1051/agro:2003052.
Simsek, A. and Aykut, O. (2007). Evaluation of the microelement profile of Turkish hazelnut (Corylus auellana L.) varieties for human nutrition and health. International Journal of Food Sciences and Nutrition, 58, 677-688. https://doi. org/10.1080/09637480701403202.
Tadesse, T., Nichols, M. A. and Fisher, K. J. (1999a). Nutrient conductivity effects on sweet pepper plants grown using a nutrient film technique 1. Yield and fruit quality. New Zealand Journal of Crop and Horticultural Science, 27, 229-237. https:// doi.org/10.1080/01140671.1999.9514101.
Tadesse, T., Nichols, M. A. and Fisher, K. J. (1999b). Nutrient conductivity effects on sweet pepper plants grown using a
nutrient film technique 2. Blossom-end rot and fruit mineral status. New Zealand Journal of Crop and Horticultural Science, 27, 239-247. https://doi.org/10.1080/01140671.1999.9514102.
Woo, C. and Kang,W. (2006). Use of East deep sea water for the increase of functional components of ginseng (Panax ginseng C.A. Meyer) and tomato (Lycopersicon esculentum
L.). Korean Journal of Plant Resources, 19, 331-335.