TOMATO YIELD AND POTASSIUM CONCENTRATIONS IN SOIL
AND IN PLANT PETIOLES AS AFFECTED BY POTASSIUM FERTIRRIGATION
1PAULO CEZAR REZENDE FONTES2, REGYNALDO ARRUDA SAMPAIO3 and EVERARDO CHARTUNI MANTOVANI4
ABSTRACT - Tomato (Lycopersicon esculentum Mill.) cv. Santa Clara was grown on a silt clay soil
with 46 mg dm-3 Mehlich 1 extractable K, to evaluate the effects of trickle-applied K rates on fruit
yield and to establish K critical concentrations in soil and in plant petioles. Six potassium rates (0, 48, 119, 189, 259 and 400 kg ha-1 K) were applied in a randomized complete block design with four
replications. Soil and plant K critical levels were determined at two plant growth stages (at the beginning of the second and fourth cluster flowering). Total, marketable and weighted yields increased with K rates, reaching their maximum of 86.4, 73.4, and 54.9 ton ha-1 at 198, 194, and 125 kg ha-1 K , respectively.
At the first soil sampling date K critical concentrations in the soil associated with K rates for maximum marketable and weighted yields were 92 and 68 mg dm-3, respectively. Potassium critical concentrations
in the dry matter of the petioles sampled by the beginning of the second and fourth cluster flowering time, associated with maximum weighted yield, were 10.30 and 7.30 dag kg-1, respectively.
Index terms: Lycopersicon esculentum, optimum rate, leaf analysis, soil analysis.
PRODUÇÃO DE TOMATE E CONCENTRAÇÕES DE POTÁSSIO NO SOLO E NA PLANTA INFLUENCIADAS POR FERTIRRIGAÇÃO COM POTÁSSIO
RESUMO - Plantas de tomate (Lycopersicon esculentum Mill.) cv. Santa Clara foram cultivadas em
solo argiloso contendo 46 mg dm-3 de K disponível (Mehlich 1), para avaliar os efeitos de doses de
potássio, aplicadas na água de irrigação, por gotejamento, sobre a produção de frutos, e para determinar as concentrações críticas desse nutriente no solo e nos pecíolos. Foram utilizadas seis doses de K (0, 48, 119, 189, 259 e 400 kg ha-1), no desenho experimental de blocos ao acaso, com quatro
repetições. As concentrações de K no solo e na planta foram determinadas em dois estádios do desenvolvimento do tomateiro (no início do florescimento do segundo e quarto cachos). As produções total, comercial e ponderada aumentaram com o aumento das doses de K, atingindo os seus máximos de 86,4, 73,4 e 54,9 t ha-1 nas doses de K correspondentes a 198, 194 e 125 kg ha-1, respectivamente. Na
primeira data de amostragem, as concentrações de K no solo associadas às máximas produções comerciais e ponderada foram 92 e 68 mg dm-3, respectivamente. As concentrações de K nas matérias secas dos
pecíolos, nas amostragens realizadas nos florescimentos do segundo e quarto cacho, associadas com a máxima produção ponderada de frutos, foram de 10,30 e 7,30 dag kg-1, respectivamente.
Termos para indexação: Lycopersicon esculentum, dose ótima, análise foliar, análise de solo.
INTRODUCTION
Tomato fruits absorb high amounts of K from the
soil. With optimum nutrition, nutrient uptake
in-creases rapidly during the fruit growth period. At
this time, K is the dominant nutrient (Huett &
Dettmann, 1988). Adequate K supply is important to
several plant processes among them enzyme
1Accepted for publication on May 7, 1999.
2Agronomist, Ph.D., Prof., Dep. de Fitotecnia, Universida-de FeUniversida-deral Universida-de Viçosa (UFV), CEP 36571-000 Viçosa, MG. CNPq’s Scholar. E-mail: [email protected]
3Agronomist, D.Sc., Assistent Prof., Dep. de Fitotenia, Universidade Federal de Roraima, BR 174 - km 12 - S/N, Monte Cristo, CEP 69306-210 Boa Vista, RR.
activation, photosynthesis, osmoregulation, phloem
transport (Marschner, 1995), determining the final
yield. In low K soil it is not possible to obtain high
tomato yields without adding K fertilizer. In these
soils, diffusion is an important soil mechanism for
supplying nutrients to plant roots, and only
potassium within the diffusive soil zone contributes
to K supply to the root (Barber, 1984). Potassium
diffusion rate depends on several factors, among
them soil water in the root zone which is closely
associated with the irrigation system. Drip
irrigation is an effective way to supply water to
tomato plants (Locascio & Myers, 1974; Locascio
et al., 1989; Hochmuth, 1994). Usually fertirrigation
improves fertilizer use efficiency by the plants
(Phene et al., 1989), affecting tomato yields
(Locascio et al.,1989; Dangler & Locascio, 1990).
Potassium applied by fertirrigation can provide
an efficient means of monitoring the K status of the
tomato plant (Besford & Maw, 1974). Published
standards of K status of the tomato plant tend to vary
for several reasons, including variety,
environmen-tal conditions, type and age of tissue sampled.
The objective of this study was to evaluate the
effects of trickle-applied K rates on tomato fruit yield
and to determine K concentrations in soil and in
tomato petioles associated with maximum yield.
MATERIAL AND METHODS
A field study was conducted on a silt clay soil at Universidade Federal de Viçosa, Minas Gerais State, Bra-zil, with 46 mg dm-3 Mehlich 1 extractable K (median) and
9.02 cmolc dm-3 cation exchange capacity. The experiment
was a randomized complete block design with four repli-cations. Potassium chloride was applied at the rates of 0, 48, 119, 189, 259 and 400 kg ha-1 K. The K rates were
divided into four split applications with 40% placed in the furrows at transplanting time; 20% applied through the trickle irrigation when the plant set the second cluster; 20% at the fourth, and 20% at the sixth cluster stage.
One month before transplanting tomato seedlings to the field, the soil was limed to raise the pH to 6.5. Preplant N (80 kg ha-1 N) as urea, micronutrients and P
fertilizer, together with the 40% K rate were placed in the furrows at transplanting time. Plots were fertirrigated with urea at 120 kg ha-1 N at the time of each K application.
Santa Clara tomato cultivar was transplanted to the field on June 29. Spacing was 0.5 m between plants and 1.0 m between rows (20,000 plants ha-1). Plots were
4.0 x 3.5 m with the middle two of four rows being sampled and harvested. Plants were staked and trained as
commer-cial crops. Each plant was thinned weekly, allowing only two stems to grow.
Trickle irrigation tubing with emitters 0.5 m apart was placed on the soil surface 10 cm from the plant shoots. The volume of irrigation water applied daily was calculated using the mean daily class A pan evaporation. During the whole crop season, irrigation and rainfall totaled 85 and 478 mm, respectively. Pest and disease control practices were applied as necessary.
Plant and soil were sampled at the beginning of the 2nd, 4th, and 6th cluster flowering stage. In each plant,
petioles from a basal fully expanded (PBE) but not senescent leaf and from the leaf adjacent to each cluster were sampled. Petioles were dried in a forced-air drier at 75oC and ground through a 1-mm screen. After
HNO3/H2O2 digestion Ca and Mg were analysed by atomic
absorption spectrometry and K by flame emission spectrophotometry. Soil samples were taken to a depth of 20 cm in the rows between the plants one day after sampling of petioles. Soil was dried, ground and passed through a 2-mm sieve. Soil pH was determined using a 2:1 water:soil volume ratio; soil electrical conductivity was determined in a saturated extract, at 25oC. Soil was
extracted with Mehlich 1 and analysed for K; it was also extracted with 1 M KCl and analysed for Ca and Mg.
Fruits were harvested weekly at the breaker stage for 9 weeks beginning on September 20. Fruit, free of blemishes, blossom-end rot and cracks, and exceeding 33 mm in diameter, were graded into extra large, > 60 mm in diameter; large, 56-60 mm; medium, 52-56 mm and small, 52-33 mm. Total yield was the sum of all graded classes, marketable yield was the sum of the three largest classes. As fruit price depends on its size, weighted yields were taken as the sum of extra large, large, and medium fruit class multiplied by 1.0, 0.5, and 0.3, respectively. These factors were obtained from the market prices attained by each fruit class (Boletim..., 1994).
Total, marketable, and weighted fruit yields, and K concentrations in the tomato petioles and in the soil samples were statistically evaluated by analysis of vari-ance. Models were fitted to statistically significant data using K fertilizer rates as the independent variable. The best fitting model was used to estimate maximum yields. To estimate critical K concentrations in petiole dry matter and soil, K rates associated to either maximum total, marketable and weighted fruit yields were introduced into the best fit model previously calculated, which correlates petiole K concentrations or the soil K level with K fertilizer rate.
RESULTS AND DISCUSSION
yields (Y = 35.62 + 0.350317X - 0.001882X
2+
0.00000256 X
3, R
2= 0.962), reaching their maxima of
86.4, 73.4, and 54.9 ton ha
-1at 198, 194 and
125 kg ha
-1K, respectively. Those are higher than
43.4 and 47.4 ton ha
-1, Brazilian and Minas Gerais
State average tomato yields (Anuário..., 1996). As
pointed out by Fontes (1997), the weighted yield
ex-presses the tomato production performance better
than does total yield. High K rates, as KCl, decrease
yield by increasing K competition with other cations
and between Cl
-and
−3
NO
(Cadahia et al., 1993;
Daliparthy et al., 1994) and also by eventually
increasing soil solution salinity.
Fruit blossom-end rot incidence reached only 2.2%
of the total fruit yield and it was not affected by high
K probably due to low variety susceptibility, to
ad-equate soil Ca and root growth adequacy, and to the
irrigation system allowing good water and nutrient
utilization by the tomato plants, as discussed by
Phene et al. (1989).
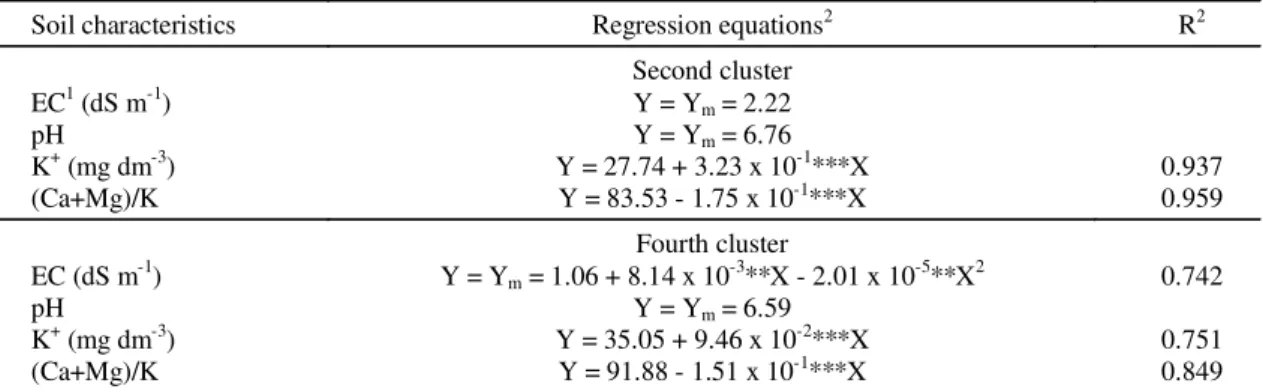
Potassium fertilizer rates increased K content and
decreased (Ca+Mg)/K ratio in the soil and had no
practical effects on the soil pH or soil solution
electrical conductivity (EC) at the two sampling dates
(Table 1). At the first soil sampling date, when the
tomato plants set the second cluster, potassium
critical concentrations in the soil associated with
maxi-mum total and weighted yields were 92 and
68 mg dm
-3, respectively; (Ca+Mg)/K ratios were 49
and 62; soil pH 6.64 and 6.61; and EC was 2.22 dS m
-1for both. Soil K concentrations were also related to
calculated maximum weighted tomato yield
propor-tions. The highest weighted yield was found at
68 mg dm
-3K. In Minas Gerais State, Brazil, soil K
content higher than 80 mg dm
-3is classified as high
K level. In Florida, for example, K fertilization is not
recommended when soil K content is higher than
60 mg dm
-3(Kidder et al., 1989). Higher soil K critical
concentration, 120 mg dm
-3, is cited by Sobulo et al.
(1977). In Australia, in soil with 117
mg kg
-1K, the
total fruit yield from plants growing on beds covered
with polyethylene mulch and trickle irrigated was not
affected by K fertilizer rate but the addition of
90 kg ha
-1K increased the yield of large fruit (Huett,
40 52 64 76 88 100
0 50 100 150 200 250 300 350 400
Potassium rate (kg ha-1)
T
o
ta
l y
iel
d (
to
n h
a
-1)
40 52 64 76 88 100
Ma
rke
ta
b
le
yi
e
ld
(t
o
n
h
a
-1) TY = 69.12 +1.75 x 10⁻¹***X - 4.41 x 10⁻⁴**X2 R2 = 0.921
MY = 55.29 + 1.87 x 10⁻¹***X - 4.81 x 10⁻⁴***X2 R2 = 0.821
FIG. 1. Relationships between potassium fertilizer rates and total (TY) and marketable tomato yields (MY) (** and *** = significant at 0.01 and 0.001 probability level).
Soil characteristics Regression equations2 R2
Second cluster EC1 (dS m-1) Y = Y
m = 2.22
pH Y = Ym = 6.76
K+ (mg dm-3) Y = 27.74 + 3.23 x 10⁻¹***X 0.937
(Ca+Mg)/K Y = 83.53 - 1.75 x 10⁻¹***X 0.959
Fourth cluster EC (dS m-1) Y = Y
m = 1.06 + 8.14 x 10⁻³**X - 2.01 x 10⁻⁵**X2 0.742
pH Y = Ym = 6.59
K+ (mg dm-3) Y = 35.05 + 9.46 x 10⁻²***X 0.751
(Ca+Mg)/K Y = 91.88 - 1.51 x 10⁻¹***X 0.849 1Saturated extract electrical conductivity at 25°C.
2Y
m : mean values; X : potassium rates as kg ha-1.
TABLE 1. Relationship between potassium fertilizer rates and electric soil solution conductivity and soil pH, K, and K/(Ca+Mg) ratio sampled at the beginning of the 2nd and 4th cluster flowering time
1993). Also, K had no effect on total tomato yield
but marketable yield increased linearly up to
112 kg ha
-1K in soil high in plant available K (Martin
& Liebhardt, 1994).
Potassium concentrations in tomato petioles from
basal fully expanded (PBE) but not senescent leaves
and from the leaf adjacent to the second cluster
(PAC) increased with increasing K rates added
to the soil (Fig. 2); similar results were found
for K concentrations in tomato petioles sampled at
the fourth cluster stage (Sampaio, 1996). Locascio
et al. (1997) also found increasing K concentrations
in tomato leaves due to K fertirrigation. Potassium
critical concentrations in the PBE and in the
PAC associated with maximum total weighted
tomato yields decreased with the plant age and also
decreased from the young to the old petiole, that is
from PBE to PAC, mainly at the first and the second
sampling dates. At the first sampling date,
K critical concentrations in the PBE for maximum
to-tal and weighted yields were 7.16 and 6.02 dag kg
-1dry weight, respectively; in the PAC the values were
10.77 and 10.30, respectively. The corresponding K
concentrations at the second sampling date for the
PBE were 6.08 and 5.02 and for the PAC were 8.82
and 7.30 dag kg
-1dry weight, respectively. For the
whole tomato season, K concentration values higher
than 3.0 dag kg
-1of dry matter are cited as normal
(Mills & Jones Junior, 1996).
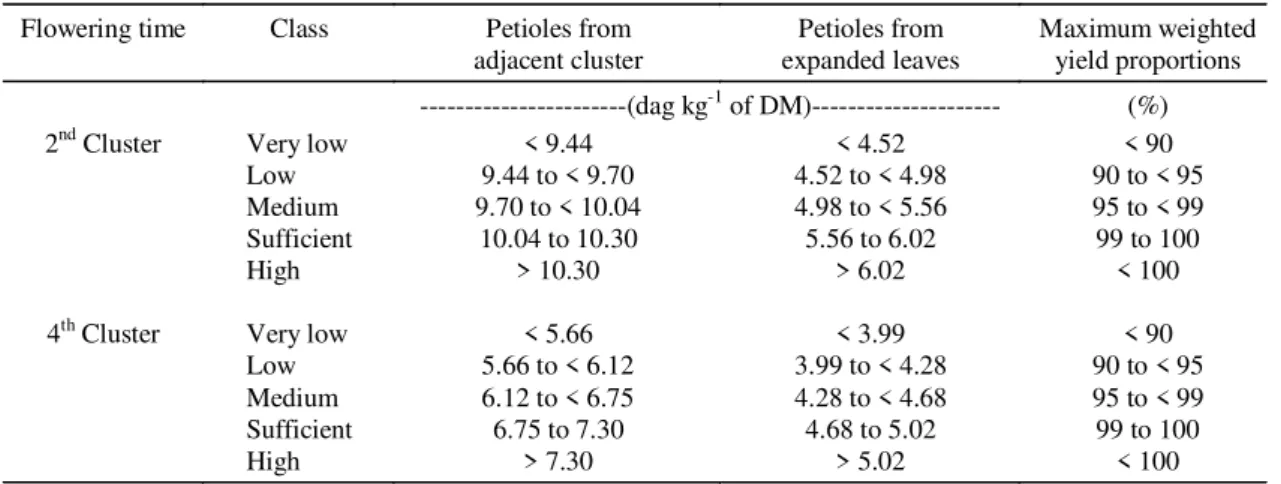
An interpretation table of K concentrations in
tomato petioles from the leaves adjacent (PAC) to
the second and the fourth clusters is shown in
Table 2. Interpretation of K concentrations in tomato
petioles from a basal fully expanded but not
senes-cent leaves (PBE) are also presented. Potassium
con-centration of 3.3 dag kg
-1in fully-expanded leaves,
sampled when most tomato fruits were small and
green, was related to maximum fruit yield (Martin &
0 4 8 12 16
0 50 100 150 200 250 300 350 400
Potassium rate (kg ha-1)
P
o
tas
s
iu
m
c
o
nc
en
tr
ati
o
n (
d
a
g
k
g
-1)
PAC = 8.6 + 1.69 x 10⁻²*X - 2.66 x 10-5X2 R2 = 0.846
PBE = 3.1 + 2.84 x 10⁻²**X - 3.97 x 10⁻⁵*X2 R2 = 0.885
*
FIG. 2. Relationship between potassium fertilizer rate and potassium concentrations in tomato petioles from basal fully expanded but not senescent leaves (PBE) and from the leaf adjacent to the second cluster (PAC) sampled by its flowering time (* and ** = significant at 0.05 and 0.01 prob-ability level).
Flowering time Class Petioles from adjacent cluster
Petioles from expanded leaves
Maximum weighted yield proportions ---(dag kg-1 of DM)--- (%)
2nd Cluster Very low < 9.44 < 4.52 < 90
Low 9.44 to < 9.70 4.52 to < 4.98 90 to < 95 Medium 9.70 to < 10.04 4.98 to < 5.56 95 to < 99 Sufficient 10.04 to 10.30 5.56 to 6.02 99 to 100 High > 10.30 > 6.02 < 100
4th Cluster Very low < 5.66 < 3.99 < 90
Low 5.66 to < 6.12 3.99 to < 4.28 90 to < 95 Medium 6.12 to < 6.75 4.28 to < 4.68 95 to < 99 Sufficient 6.75 to 7.30 4.68 to 5.02 99 to 100 High > 7.30 > 5.02 < 100
Liebhardt, 1994). Sufficient K concentrations in dry
matter of petioles at 2
ndcluster mid bloom ranged
from 5.0 to 10.0 dag kg
-1(Jones Junior et al., 1991). At
the 4
thcluster, the values were 4.0 to 8.0. The
suffi-cient K concentrations found in the present
experiment are also very close to the values cited by
Lingle & Lorenz (1969) and by Reuter & Robinson
(1986).
CONCLUSIONS
1. Total and marketable tomato yields increase with
the K rates, reaching their maxima of 86.4 and
73.4 ton ha
-1at 198 and 194 kg ha
-1K, respectively.
2. Potassium concentrations in soil and petioles
increase with the increase in the K rates.
3. At the time the tomato plants set the second
cluster, K critical concentrations for maximum
marketable tomato fruit yield are 92 mg dm
-3in the
soil and 10.30 dag kg
-1in the petioles from the leaf
adjacent to the second cluster.
REFERENCES
ANUÁRIO ESTATÍSTICO DO BRASIL. Rio de Janeiro : IBGE, v.5, p.3-38, 1996.
BARBER, S.A. Soil nutrient bioavailability. New York : John Wiley & Sons, 1984. 398p.
BESFORD, R.T.; MAW, G.A. Uptake and distribution of potassium in tomato plants. Plant and Soil, The
Hague, v.41, p.601-618, 1974.
BOLETIM INFORMATIVO DIÁRIO DE PREÇOS. Belo Horizonte : CEASA, v.21, nos 176 a 238, 1994.
Não paginado.
CADAHIA, C.; SEGURA, M.L.; EYMAR, E.; MARTINEZ, M.; GIL, C. Tomato culture fertigation in peat bags and saline conditions. Acta Horticulturae, Leuven, v.335, p.101-107, 1993.
DALIPARTHY, J.; BARKER, A.V.; MONDAL, S.S. Potassium fractions with other nutrients in crops: a review focusing on the tropics. Journal of Plant Nutrition, New York, v.17, p.1859-1886, 1994.
DANGLER, J.M.; LOCASCIO, S.J. Yield of trickle irrigated tomatoes as affected by time of N and K application. Journal of theAmerican Society for
Horticultural Science, St. Joseph, v.115,
p.585-589, 1990.
FONTES, P.C.R. Produtividade do tomateiro: kg/ha ou kg/ha/dia? Horticultura Brasileira, Brasília, v.15, p.83-85, 1997.
HOCHMUTH, G.J. Current status of drip irrigation for vegetables in the Southeastern and mid Atlantic United States. HortTechnology, Alexandria, v.4, p.390-393,
1994.
HUETT, D.O. Fertilizer nitrogen and potassium studies with Flora-Dade tomatoes grown with trickle irrigation and polyethylene mulch covered beds on krasnozem soils. Australian Journal of
Experi-mental Agriculture, East Melbourne, v.33,
p.221-226, 1993.
HUETT, D.O.; DETTMANN, E.B. Effect of nitrogen on growth, fruit quality and nutrient uptake of tomatoes grown in sand. Australian Journal of Experimental Agriculture, East Melbourne, v.28,
p.391-399, 1988.
JONES JUNIOR, J.B.; WOLF, B.; MILLS, H.A. Plant
analysis handbook: a practical sampling,
preparation, analysis, and interpretation guide. Athens : Micro-Macro, 1991. 214p.
KIDDER, G.; HANLON, E.A; HOCHMUTH, G.L. IFAS standardized fertilization recommendation for vegetable crops. Gainesville : Florida Cooperative Extension Service, 1989. 4p. (Bulletin, 38).
LINGLE, J.C.; LORENZ, O.A. Potassium nutrition of tomatoes. Journalof theAmerican Society for Horticultural Science, St. Joseph, v.94, p.679-683, 1969.
LOCASCIO, S.J.; HOCHMUTH, G.J.; RHOADS, F.M.; OLSON, S.; SMAJSTRLA, A.G.; HANLON, E.A. Nitrogen and potassium application scheduling effects on drip-irrigated tomato yield and leaf tissue analysis. HortScience, Alexandria, v.32, p.230-235,
1997.
LOCASCIO, S.J.; MYERS, J.M. Tomato response to plug-mix, mulch and irrigation method.
Proceedings of the Florida State Horticultural Society, Lake Alfred, v.87, p.126-130, 1974.
American Society for Horticultural Science,
St. Joseph, v.114, p.265-268, 1989.
MARSCHNER, H. Mineral nutrition of higher plants. 2.ed. London : Academic, 1995. 889p.
MARTIN, H.W.; LIEBHARDT, W.C. Tomato response to long-term potassium and lime application on a sandy Ultisol high in non-exchangeable potassium.
Journal of Plant Nutrition, New York, v.17,
p.1751-1768, 1994.
MILLS, H.A.; JONES JUNIOR, J.B. Plant analysis handbook II: a practical sampling, preparation,
analysis, and interpretation guide. Athens : Micro-Macro, 1996. 422p.
PHENE, C.J.; DAVIS, K.R.; MCCORMICK, R.B.; HUTMACHER, R.B.; PIERRO, J.D. Water-fertil-ity management for subsurface drip irrigated
toma-toes. In: INTERNATIONAL SYMPOSIUM ON INTEGRATED MANAGEMENT PRACTICES, 1988, Tainan. Tomato and pepper production in thetropics: proceedings. Taipei : Asian Vegetable Research and Development Center, 1989. p.323-338.
REUTER, D.J.; ROBINSON, J.B. Plant analysis: an interpretation manual. Melbourne : Inkata, 1986. 218p.
SAMPAIO, R.A. Produção, qualidade dos frutos e teores de nutrientes no solo e no pecíolo do tomateiro, em função da fertirrigação potássica e da cobertura plástica do solo. Viçosa, MG : UFV, 1996. 117p. Dissertação de Doutorado.
SOBULO, R.A.; AGBOOLA, A.A.; FAYEMI, A.A. Application of soil and plant analysis to nutrition of tomatoes in south west Nigeria. Acta Horticulturae,