Acta Scientiarum
http://www.uem.br/acta ISSN printed: 1679-9275 ISSN on-line: 1807-8621
Doi: 10.4025/actasciagron.v38i4.30534
Acta Scientiarum. Agronomy Maringá, v. 38, n. 4, p. 457-466, Oct.-Dec., 2016
QTLs identification for characteristics of the root system in upland
rice through DNA microarray
Thiago Gledson Rios Terra1, Haroldo Silva Rodrigues2, Paulo Hideo Nakano Rangel3, Rafael
Simões Tomaz4, Cosme Damião Cruz5 and Aluízio Borém6*
1
Universidade Federal do Tocantins, Gurupi, Tocantins, Brazil. 2Departamento de Fitotecnia, Universidade Federal de Viçosa, Viçosa, Minas Gerais, Brazil. 3Embrapa Arroz e Feijão, Santo Antônio de Goiás, Goiás, Brazil. 4 Universidade Estadual Paulista, Dracena, São Paulo, Brazil. 5
Departamento de Biologia Geral, Universidade Federal de Viçosa, Viçosa, Minas Gerais, Brazil. 6Departamento de Fitotecnia, Universidade Federal de Viçosa, Viçosa, Minas Gerais, Brazil. *Author for correspondence. E-mail: [email protected]
ABSTRACT. The aim of this work is the construction of a genetic map and identification of quantitative trait loci (QTLs) that control characteristics of the root system of rice. We evaluated a F2:3 population
composed of 150 families from the cross between the varieties IAC 165 × BRS Primavera. Genotyping was performed in the F2 population using 3,742 SNP (Single Nucleotide Polymorphism) markers. The
evaluation of the root system in the F3 population was performed through a large-scale phenotyping
method based on image generation with a CI-600 root scanner and on quantification through the WinRhizo® software. The experiment was arranged in a randomized block design with three replications
performed under greenhouse. The variables analyzed were root length, root surface area and root volume at the depths of 5 to 25 cm and 25 to 45 cm. The SNP markers analysis allowed the construction of the genetic map with a full length of 1424 cM. The linkage group with the largest coverage area was number 3
with 270 cM (100 SNPs), followed by linkage group 1 with 249 cM (170 SNPs) and linkage group 2 with 163 cM (99 SNPs). The genetic analysis allowed the detection of QTLs for all the characteristics.
Keywords: genomic, Oryza sativa L., DNA chip, QTL mapping, abiotic stress.
Identificação de QTL para características do sistema radicular em arroz de terras altas por
meio de microarray
RESUMO. Este trabalho objetivou a construção de um mapa genético e identificação de locos de características quantitativas (QTLs) que controlam características do sistema radicular do arroz. Foi avaliada uma população F2:3 composta de 150 famílias a partir do cruzamento entre as variedades IAC 165 x BRS
Primavera. A genotipagem foi realizada na população F2 utilizando 3.742 marcadores SNP (Polimorfismo
de um Único Nucleótido). A avaliação do sistema radicular nas populações F3 foi realizada através de
fenotipagem em larga escala baseada na geração de imagem com scanner raiz CI-600 e na quantificação através do software WinRhizo®. Foi realizado experimento em delineando blocos casualizados, em casa de vegetação com três repetições. Foram consideradas as variáveis comprimento, área de contato da raiz e volume nas profundidades de 5 a 25 cm e 25 a 45 cm. A análise dos marcadores SNP permitiu a construção de um mapa genético com comprimento total de 1424 cM. O grupo de ligação com maior área de cobertura foi o número 3 com 270 cM (100 SNPs), seguido pelo grupo de ligação 1, com 249 cM (170 SNP), e 2 com 163 cM (99 SNP). A análise genética permitiu a detecção de QTL para todas as características estudadas.
Palavras-chave: genômica, Oryza sativa L., chip de DNA, mapeamento de QTL, estresse abiótico.
Introduction
Upland rice is responsible for approximately 21% of Brazilian agricultural production. However, the lack of water throughout its production process has a major negative impact on the culture. According to Toescher, Righes, and Carlesso (1997) and Stone (1985), drought occurrence impacts mainly nutrient absorption by the root system, negatively affecting the crop productivity.
The understanding of the genetic mechanisms associated with the rice root system development aiming selection could help with the optimization of water absorption, and this strategy seems to be essential for breeding of the culture.
Long-458 Terra et al.
Zhi, 2013), construction of genetic maps (Jun-Zhi, Xiao, Chao, Ke, & Yan-Jun, 2009), identification of quantitative trait loci (QTL) (Uga, Okuno, & Yano, 2011) and identification of functional markers (Andersen & Lübberstedt, 2003), as well as in marker assisted selection (MAS) and genomic selection (GS) (Steele, Virk, Kumar, Prasad, & Witcombe, 2007; Uga et al., 2013).
For such purposes, single nucleotide polymorphisms (SNPs) have been highly used in genetic analysis because they are stable, widely distributed in the genome and allow for automation, which facilitates high-throughput genotyping and QTL detection. Since 1995, QTL mapping has been conducted in rice cultivation for both temporary and permanent populations (Sabouri, Sabouri, Jafarzadeh, & Mollashahi, 2011; Liang, 2013; Liang, Zhen-Hua, & Jie-Yun, 2013).
Drought tolerance is very dependent on the root system. This dependence on the root system in turn influences other important agronomic traits in upland rice, such as efficiency in nutrient absorption and resistance to pests and root diseases (Oliveira, Freitas, Fiúza, Menezes, & Dotto, 2010; Henry, Gowda, Torres, Mcnally, & Serraj, 2011; Uga et al., 2013). For such reasons, the root system is frequently studied given the potential for the stabilization or increase of productivity under adverse conditions (Topp et al., 2013; Gamuyao et al., 2012).
DNA microarrays are a very useful tool for QTL identification, Marker Assisted Selection (MAS) and genomic selection (GS) studies because they provide greater genome coverage. Related to MAS, it is particularly important to have an adequate linkage map saturation to detect more accurate QTL positioning and its effect estimation, as it is then easier to associate it with a causative gene. Considering the importance of the root system for rice cultivation, this work sought to evaluate a
segregating F2:3 population of upland rice to
construct a linkage map aiming QTL identification for root system traits by means of DNA microarrays technology.
Material and methods
Genetic material
The genetic material evaluated in this experiment was constituted by a segregating
population (F2:3) derived from a single F1 plant
obtained from the cross between the varieties of
upland rice (tropical japonica subspecies) IAC 165 and BRS Primavera, composed by 148 families and its two genitors.
IAC 165 is a commercial variety of upland rice developed by the Agronomic Institute of Campinas from the cross between "Dourado Precoce" and IAC 1245. It has a moderate resistance to lodging, strong root development, tolerance to water deficit, relatively short cycle and long and thick grain. BRS Primavera is a commercial variety released for cultivation in highlands and was developed by Embrapa Rice and Beans. It is derived from the cross between IRAT 10 and LS 85-158 cultivars, has intermediate size (average of 100 cm), medium tillering, low lodging resistance and early cycle (average of 100 days). It presents average productivity, susceptibility to drought, long and thin high quality grains, and shows a very narrow harvest stage.
Root phenotyping
The root phenotyping was performed in the experimental field of Fazenda Palmital, of EMBRAPA Rice and Beans, in the municipality of Goianira, Goiás State, Brazil, from October 2012 to June 2013. The experiment was installed in a randomized block outlining with three repetitions and was performed under controlled conditions in a greenhouse. The experimental unit was constituted by a polyethylene pipe with an internal diameter of 30 cm and a height of 80 cm and was filled with a clayey red latosol that presented constitution of: 19.0
g dm-3 M.O., pH 5.4, 0.5 g dm-3 P(Mel.); 0.24 cmol
c
dm-3 K, 2.0 cmol
c dm-3 Ca, 0.8 cmolc dm-3 Mg, 0.0
cmolc dm-3 Al, 2.5 cmolc dm-3 H+Al; 590.0 g kg-1
sand, 120.0 g kg-1 silt, 290.0 g kg-1 clay, with an
added 250 grams of 5-25-15 fertilizer. Installed inside of the experimental unit was an acrylic tube of 6 cm of internal diameter with rubber covers for protection against the entry of soil, water or organic waste.
Around the acrylic tube, three rice plants were transplanted with one week of emergence. Two weeks after transplantation, the generation of the images was initiated at the depth of 5-25 cm, and three weeks after transplantation, imaging at the depth of 25-45 cm was performed. The images were
digitalized using a scanner (CI – 600 Cano Scan)
inserted in the acrylic tube, which scanned the surface around the tube. The evaluations were performed weekly for until the plans were eight weeks of age.
The generated images were analyzed using the
image quantification software WinRhizo, version
QTLs identification for upland rice characteristics 459
Acta Scientiarum. Agronomy Maringá, v. 38, n. 4, p. 457-466, Oct.-Dec., 2016
the total length of the roots (COM) measured in centimeters (cm), the estimated contact area of the roots (ACR) measured in square centimeters (cm²) and the total volume of the roots (VOL) measured in cubic centimeters (cm³).
DNA Microarray Genotyping
For the genotyping of population F2:3, a
microarray composed of SNP-type markers was used. For the microarray construction, genetic
sequencing data from eight varieties of upland rice
(japonica subspecies) were employed whose
characteristics related to the root system are described in Table 1.
A total of 3,742 SNP markers were developed and distributed along the 12 rice chromosomes. These markers were submitted to the DNA microarray technique (Schena, Shalon, Davis, & Brown, 1995). Any SNPs that did not present a polymorphism, had not been evaluated in at least 80% of the population, or that presented segregation distortion by the chi-square test at 5% probability level were eliminated on the basis of the genetic map’s construction and the QTL identification.
Data analysis
The phenotyping process was performed
through the WinRhizo™ software (Arsenault,
Pouleur, Messier, & Guay, 1995). The areas under the growth curve (AUC) were estimated for each root variable over the weeks of evaluation using the trapezoidal method. The data from the AUC were submitted to variance homoscedastic testing
followed by joint variance analysis. Considering the two depths, the AUC was used to estimate a value closer to the real growth rate of the root system (Boyer, 1996) rather than using only an average calculated from the data collected along the eight weeks of this study. The variance was estimated from data of each genotype AUC related to the genotype’s averages. The analysis aimed to verify significant differences within the population for the analyzed characteristics of the root system. The GENES software (version 2013) was used in this step (Cruz, 2013).
The construction of the genetic map was
performed through the IcIMapping QTL software
(version 2012 3.2), considering an LOD Score of 3.0
for QTL identification (Collard, Jahufer, Brouwer, & Pang, 2005). For the identification of QTLs related to the root characteristics, the simple interval mapping method was performed using the Windows QTL Cartographer software (version 2.5_011, 2012) (Basten, Weir, & Zeng, 2004).
Results and discussion
The phenotypic information showed variance homoscedasticity and the joint variance analysis for the two depths (p < 0.01), which is presented in Table 2. The results demonstrated great variability as well as significant differences for all variables and all considered factors (genotypes, depth and interaction).
Table 1. Upland rice varieties (japonica subspecies) and their characteristics related to the root system.
Variety Characteristics related to the root system
Azucena Variety from the Philippines, known in the international literature as a genotype of good root development and tolerance to the stress of drought and toxic aluminum.
Moroberekan Variety from West Africa, also known in the international literature as a genotype of good root development, good root penetration capacity on soil, tolerant to drought and toxic aluminum.
Chorinho Traditional variety collected in the state of Minas Gerais, Brazil, with intermediate tolerance to stress by water deficiency in the field, with tall plants.
Puteca Traditional rice variety collected in the state of Goiás, Brazil, susceptible to stress from water deficiency, with tall plants.
IAC 165 Commercial rice variety developed by the Campinas Agronomic Institute, with high rusticity, good root development and tolerance to the stress of drought.
BRS Primavera Commercial variety developed by Embrapa Rice and Beans, presenting susceptibility to drought stress, whose plants are of intermediate size (average of 100 cm).
Catetão Traditional variety collected in the state of MatoGrosso, Brazil, tolerant to drought stress, with tall plants.
Ligeiro Traditional rice variety collected in the state of Maranhão, Brazil, tolerant to drought stress, presenting a short cycle and low productivity.
Table 2. Variance analysis for the variables of the root system: length (COM), contact area (ACR) and volume (VOL) of the roots in the depths of 5-25 cm and 25-45 cm.
Mean square
F. V. GL COM ACR VOL
Block 2 7943175.93 227320.49 42.24
Genotypes(G) 149 645107.39 ** 17818.13 ** 3.56 **
Depths(P) 1 44593404.61 ** 2080284.10 ** 550.40 **
G x P 149 596237.47 ** 16523.02 ** 3.18 **
Residue 598 179663.06 5420.12 1.23
Average 1657.23 275.73 3.69
Average depth 1 1879.83 323.80 4.48
Average depth 2 1434.64 227.65 2.91
CV (%) 25.57 26.70 30.07
460 Terra et al.
Genetic map based on the F2 population from the cross
between varieties IAC 165 and BRS Primavera
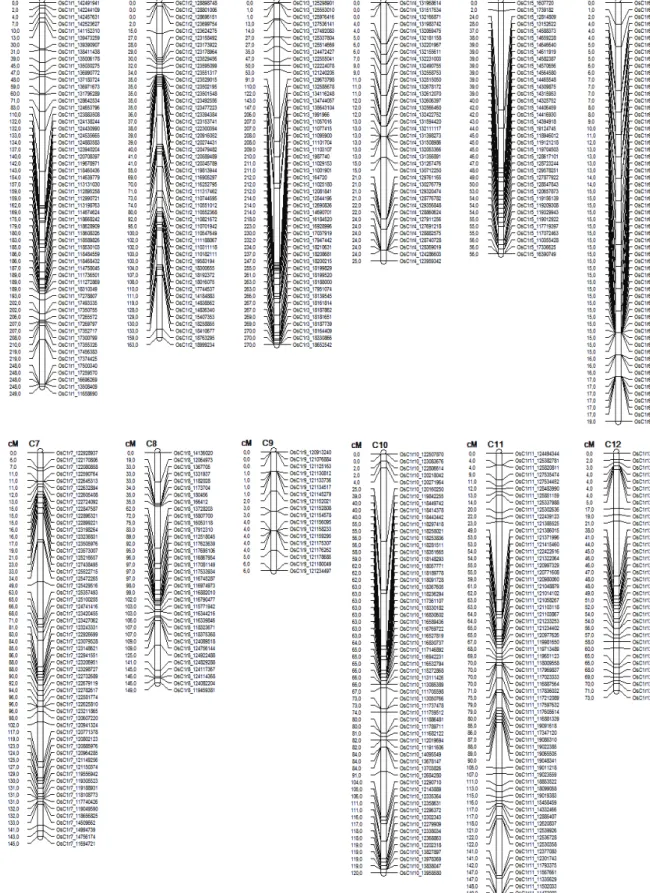
Having identified significant differences in the root system characteristics, genomic analysis was then performed by constructing a genetic map and QTLs detection for such characteristics. SNPs that did not cover 80% of the segregating population, were not polymorphic, or that presented segregation distortion evaluated through the chi-square test (p < 0.05) were eliminated from the analysis. Then, 1,061 polymorphic markers were considered for genetic analysis. The genetic maps were constructed based on these 1,061 polymorphic markers, considering an LOD score of 3.0 and a maximum recombination frequency of 0.3. The mapping process allowed the construction of 12 linkage groups (Figure 1), reconstituting the number of chromosomes of rice species considered, according to Cheng, Buell, Wing, Gu, and Jiang (2001).
The markers on the genetic map presented the same ordering presented in the physical map from which the SNPs were selected, based on the database available by the Gramene portal (Jaiswal et al., 2006). Linkage groups 1 and 7 presented the highest number of markers (170 SNPs on each chromosome), followed by linkage groups 11 (130 SNPs) and 3 (100 SNPs). The smaller linkage group was group 9, with only 18 SNPs markers. Many markers presented were completely connected, having been omitted from the linkage group (Figure 1). Overall, the markers presented good distribution along the chromosomes, with the exception of chromosome 9, which had a total length of 6 cM. This result is corroborated by Sabouri et al. (2011), in whose work on Oryza sativa L. also reported the shorter length of this chromosome in relation to others. The longest length was found in chromosome 3, with 270 cM, followed by chromosome 1 with 249 cM and by chromosome 2 with 163 cM. The total length of the genetic map constructed was 1,424 cM. The size of the genome obtained is similar to that reported by other authors in
several works for the species O. sativa L. (Liang, 2013).
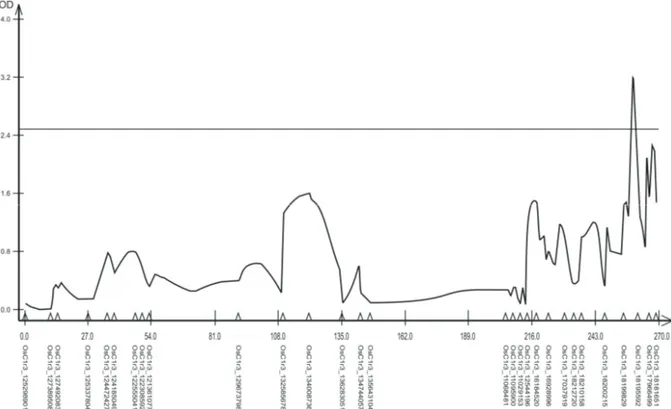
According to Uga et al. (2011), the characteristic COM is governed by a smaller quantity of genes when compared to other characteristics of the root system, such as growth in depth and the angle of growth of the roots. For the characteristic COM, QTLs with a significant effect associated with the two depths evaluated were detected in 5 to 25 cm (Figure 2) and 25 to 45 cm (Figure 3), as these are positioned at the linkage groups 3 and 1, respectively. For the depth of 5 to 25 cm, the QTL was positioned in the distal fraction of the linkage group 3, at the position 258-260 cM. This QTL was identified between the markers OsC1r3_18199829 and OsC1r3_18195592 with a LOD of 3.22. For the depth of 25 to 45 cm, the QTL was positioned in the proximal fraction of the linkage group 1, positioned
between the markers OsC1r1_142021996 and OsC1r1_141152310 with a LOD of 3.37.
The characteristic ACR, in turn, is intimately associated with the capacity to absorb water and soil nutrients, a quality of great importance for the growth and development of plants. For this characteristic, at the most superficial depth (5 to 25 cm,), one QTL was detected, as well as in the distal fraction of the linkage group associated with chromosome 3, positioned at 256-260 cM, between the markers OsC1r3_18199829 and OsC1r3_18195592 with LOD = 3.02 (Figure 4). It is possible that this QTL has a pleiotropic effect for root characteristics because it is located in the same region of the QTL detected for COM characteristics. The same happens for the second QTL detected for this characteristic in the depth of 25 to 45 cm (Figure 5), detected at the beginning of the linkage group 1, at a distance of 5-8 cM between the markers OsC1r1_142021996 and OsC1r1_141152310. The LOD associated with this QTL was of 3.06.
For the characteristic VOL a QTL in linkage group 3 was detected at the depth of 5 to 25 (Figure 6). This QTL is located at the position 96-104 cM, between the markers OsC1r3_129673798 and OsC1r3_132585678, with a LOD of 2.73. Two QTLs for the VOL characteristic were located at the depth of 25 to 45 cm in linkage group 1 (Figure 7). The first QTL at the proximal fraction of the linkage group was detected at the position of 5-9 cM between the markers OsC1r1_142021996 and OsC1r1_141152310 with LOD of 2.99. The second QTL was detected at the position 67-76 cM between the markers OsC1r1_128642534 and OsC1r1_124653796 with a LOD of 3.05.
The identification of two regions controlling a quantitative characteristic suggests an inheritance of polygenic control for the VOL characteristic. This finding allows us to infer information about the existence of more genes involved in the VOL control that would allow the plant to reach the deepest regions on the soil (Uga et al., 2011). This author highlights that such genes would allow the plant to stimulate root growth in a vertical way through, for example, elongation of the root cells. Other works conducted
with rice (O. sativa L.) also identified QTLs for
characteristics, such as COM, ACR and VOL, in these same chromosomes, corroborating with the results found in the present research. Courtois, Shen, Petalcorin, Carandang, and Mauleon (2003) studied a population of endogamic lineages from the cross
between the varieties IAC 165 (O. sativa L. subesp.
QTLs identification for upland rice characteristics 461
Acta Scientiarum. Agronomy Maringá, v. 38, n. 4, p. 457-466, Oct.-Dec., 2016
462 Terra et al.
Figure 2. QTL associated to the characteristic COM at the depth of 5 to 25 cm in a F2:3 population of rice on the chromosome 3 by the
Composed Interval Mapping analysis. The critical value of LOD of 2.5 is represented by the horizontal line.
Figure 3. QTL associated to the characteristic COM at the depth of 25 to 45 cm in a F2:3 population of rice on the chromosome 1 by the
QTLs identification for upland rice characteristics 463
Acta Scientiarum. Agronomy Maringá, v. 38, n. 4, p. 457-466, Oct.-Dec., 2016
Figure 4. QTL associated to the characteristic root contact area (ACR) at a depth of 5 to 25 cm in a F2:3 population of rice on the
chromosome 3 by the Composed Interval Mapping analysis. The critical value of LOD of 2.5 is represented by the horizontal line.
Figure 5. QTL associated to the characteristic root contact area (ACR) at the depth of 25 to 45 cm in a F2:3 population of rice on the
464 Terra et al.
Figure 6. QTL associated to Volume of the roots at the depth of 5 to 25 cm in a F2:3 population of rice in the liaison group 3 by the
Composed Interval Mapping analysis. The critical value of LOD of 2.5 is represented by the horizontal line.
Figure 7. QTL associated to the Volume of the roots at the depth of 25 to 45 cm in a F2:3 population of rice on the chromosome 1 by the
Composed Interval Mapping analysis. The critical value of LOD of 2.5 is represented by the horizontal line.
The limited progress for drought tolerance in rice culture has been attributed, in part, to the large quantity of genes involved and the large environmental influence associated with this
QTLs identification for upland rice characteristics 465
Acta Scientiarum. Agronomy Maringá, v. 38, n. 4, p. 457-466, Oct.-Dec., 2016
using MAS to monitor the gene dro1. This gene,
located on chromosome 9, is reported to be responsible for the elongation of root cells.
In rice culture, many of the QTLs identification work related to root system characteristics have been performed through crossings between subspecies of
genotypes O. sativa indica with O. sativa japonica
(Steele et al., 2007; Uga et al., 2011; Courtois et al., 2003; Ping et al., 2003). In this type of crossing, there is a huge segregation, enabling the study and detection of QTL for certain characteristics, given the knowledge of contrasting genitors. The crossing of such genetic materials results in the segregation of smaller amounts of characteristics, which enables both the most refined molecular study and cultivar development. This study, in turn, allows for the identification of genes and their subsequent use in SAM operational procedures, such as those used by Uga et al. (2013).
Conclusion
The resulting segregating population from the cross between the varieties IAC 165 and BRS Primavera presented wide variability for the root characteristics studied.
The DNA microarray technique allowed for the construction of an upland rice genetic map with broad genome coverage and a total length of 1,424 cM, covering all chromosomes of the species.
The linkage groups 1 and 3 presented QTLs related to the characteristics COM, ACR and VOL of the root system.
References
Andersen, J. R., & Lübberstedt, T. (2003). Functional markers in plants. Trends in Plant Science, 8(11), 554-560.
Arsenault, J. L., Pouleur, S., Messier, C., & Guay, R. (1995). WinRHIZO™, a root-measuring system with a unique overlap correction method. HortScience, 30(4), 906-906.
Basten, C. J., Weir, B. S., & Zeng, Z. B. (2004). QTL Cartographer, version 1.17. Raleigh, NC: Department of Statistics, North Carolina State University.
Boyer, C. B. (1996). Introdução à história da matemática. Campinas, SP: Editora Edgard Blucher.
Cheng, Z., Buell, C. R., Wing, R. A., Gu, M., & Jiang, J. (2001). Toward a Cytological Characterization of the Rice Genome. Genome Research, 11(12), 2133-2141. Collard, B. C. Y., Jahufer, M. Z. Z., Brouwer, J. B., &
Pang, E. C. K. (2005). An introduction to markers, quantitative trait loci (QTL) mapping and marker-assisted selection for crop improvement: the basic concepts. Euphytica, 142(1-2), 169-196.
Courtois, B., Shen, L., Petalcorin, W., Carandang, S., & Mauleon, R., & Li, Z. (2003). Locating QTLs controlling constitutive root traits in the rice population IAC 165 × Co39. Euphytica, 134(3), 335-345.
Cruz, C. D. (2013). GENES - a software package for analysis in experimental statistics and quantitative genetics. Acta Scientiarum. Agronomy, 35(3), 271-276. Gamuyao, R., Chin, J. H., Pariasca-Tanaka, J., Pesaresi, P.,
Catausan, S., Dalid, C., ... Heuer, S. (2012). The protein kinase Pstol1 from traditional rice confers tolerance of phosphorus deficiency. Nature, 488(7412), 535-539.
Henry, A., Gowda, V. R. P., Torres, R. O., Mcnally, K. L., & Serraj, R. (2011). Variation in root system architecture and drought response in rice (Oryza sativa): Phenotyping of the Oryza SNP panel in rainfed lowland fields. Field Crops Research, 120(2), 205-214. Jaiswal, P., Ni, J., Yap, I., Ware, D., Spooner, W.,
Youens-Clark, K., … Mccouch, S. (2006). Gramene: a bird’s eye view of cereal genomes. Nucleic Acids Research,
34(suppl 1), D717-D723.
Jun-Zhi, Z., Xiao, L., Chao, L., Ke, X., & Yan-Jun, D. (2009). Genetic analysis and molecular mapping of light-sensitive red-root mutant in rice. Rice Science,
16(1), 27-32.
Liang, G., Zhen-Hua, Z., & Jie-Yun, Z. (2013). Quantitative trait loci for heading date and their relationship with genetic control of yield traits in rice (Oryza sativa). Rice Science, 20(1), 1-12.
Liang, Y. S. (2013). Locating QTLs controlling several adult root traits in an elite Chinese hybrid rice. Gene,
526(2), 331-335.
Li-Na, Z., Gui-Lan, C., & Long-Zhi, H. (2013). Genetic Diversity of Rice Landraces from Lowland and Upland Accessions of China. RiceScience, 20(4), 259-266.
Mammadov, J., Aggarwal, R., Buyyarapu, R., & Kumpatla, S. (2012). SNP Markers and their impact on plant breeding.
International Journal of Plant Genomics, 2012(2012) 1-11. Oliveira, J. V., Freitas, T. F. S., Fiúza, L. M., Menezes, G.,
& Dotto, G. (2010). Manual de insetos associados à cultura do arroz irrigado. Cachoeirinha, RS: Instituto Rio Grandense do Arroz.
Ping, M., Zichao, L., Chunping, L., Hongliang, Z., Changming, W., Chen, L., & Xiangkun, W. (2003). QTL mapping of the root traits and their correlation analysis with drought resistance using DH lines from paddy and upland rice cross. Chinese Science Bulletin,
48(24), 2718-2724.
Sabouri, H., Sabouri, A., Jafarzadeh, M. R., & Mollashahi, M. (2011). Detection of QTLs controlling field blast resistance in rice (Oryza sativa L.). Plant Omics Journal,
4(1), 1-5.
Schena, M., Shalon, D., Davis, R. W., & Brown, P. O. (1995). Quantitative monitoring of gene expression patterns with a complementary DNA microarray.
466 Terra et al.
Steele, K. A., Virk, D. S., Kumar, R., Prasad, S. C., & Witcombe, J. R. (2007). Field evaluation of upland rice lines selected for QTLs controlling root traits. Field Crops Research, 101(2), 180-186.
Stone, L. F. (1985). Absorção de P, K, Mg, Ca e S por arroz influenciada pela deficiência hídrica, vermiculita e cultivar. Pesquisa Agropecuária Brasileira, 20(11), 1251-1258.
Toescher, C. F., Righes, A. R., & Carlesso, R. (1997). Volume de água aplicada e produtividade do arroz sob diferentes métodos de irrigação. Revista da FZVA, 4(1), 49-57. Topp, C. N., Iyer-Pascuzzi, A. S., Anderson, J. T., Lee, C.,
Zurek, P. R., Symonoa, E., … Benfey, P. N. (2013). 3D phenotyping and quantitative trait locus mapping identify core regions of the rice genome controlling root architecture. Proceedings of the National Academy of Sciences of the United States of America, 110(18), 1695-1704.
Uga, Y., Okuno, K., & Yano, M. (2011). Dro1, a major QTL involved in deep rooting of rice under upland field conditions. Journal of Experimental Botany, 62(8), 2485-2494.
Uga, Y., Sugimoto, K., Ogawa, S., Rane, J., Ishitani, M., Hara, N., ... Inoue, H. (2013). Control of root system architecture by DEEPER ROOTING 1 increases rice yield under drought conditions. Nature Genetics, 45(9), 1097-1102.
Received on January 12, 2016. Accepted on April 18, 2016.