Phylogenetic relationships in the
Drosophila fasciola
species subgroup
(Diptera, Drosophilidae) inferred from partial sequences of the mitochondrial
cytochrome oxidase subunit I (
COI
) gene
Erica C.C. Silva-Bernardi
1, Adriana C. Morales
2, Fabio M. Sene
1and Maura H. Manfrin
21
Departamento de Genética, Faculdade de Medicina de Ribeirão Preto, Universidade de São Paulo,
Ribeirão Preto, São Paulo, Brazil.
2Departamento de Biologia, Faculdade de Filosofia Ciências e Letras de Ribeirão Preto,
Universidade de São Paulo, Ribeirão Preto, São Paulo, Brazil.
Abstract
Therepleta group is one of the largest and most complex species groups in the genus Drosophila, representing an important biological model for the elaboration of evolutionary and biogeographical hypotheses on the American Con-tinent. It is divided into six subgroups, of which thefasciola subgroup is the only one with most of its species found in the humid forests of Central and South America. With the aim of understanding the origin and evolution of thefasciola subgroup, and consequently adding information about therepleta group, we analyzed partial sequences of the mito-chondrial cytochrome oxidase subunit I (COI) gene of nine Drosophila species (D. carolinae, D. coroica, D. ellisoni, D. fascioloides, D. ivai, D. moju, D. onca, D. rosinae and D. senei). The phylogenetic hypotheses obtained neither defined the relationships between the subgroups of therepleta group nor defined all the interspecific relationships in thefasciola subgroup. We found that the species D. carolinae, D. coroica, D. onca, D. rosinae and D. senei com-prised a clade in whichD. carolinae, D. onca and D. senei appeared together at a polytomy while D. fascioloides and D. ellisoni comprised another clade with a high bootstrap value.
Key words: fasciolasubgroup, molecular phylogeny, mtDNA, systematics,repletagroup. Received: December 14, 2004; Accepted: December 21, 2005.
TheDrosophila repletaspecies group, endemic to the American Continent, is one of the largest and most complex species groups in the genusDrosophila, because of which it represents an excellent biological model for speciation studies. This species group contains about one hundred de-scribed species (Vilela, 1983; Rafael and Arcos, 1989; Vilela and Bächli, 1990; Tidon-Sklorz and Sene, 1995a, 2001; Etgeset al., 2001; Bächli and Vilela, 2002) divided into theD. fasciola,D. inca, D. hydei,D. mercatorum,D. mulleriandD. repletasubgroups based on chromosome in-versions and morphological characters (Wasserman, 1960, 1982, 1992; Vilela, 1983; Rafael and Arcos, 1989). The monophyly of therepletagroup is defined on morphologi-cal (Throckmorton, 1975, 1982; Vilela, 1983), cytologimorphologi-cal (Wasserman, 1992) and molecular data (Tatarenkov and Ayala, 2001) but Durandoet al.(2000) have suggested that therepleta group is not monophyletic, stating that ‘...this
inference [of monophyly] may be the result of poor resolution at the base of the phylogenetic tree’.
The repleta group is widely distributed throughout the American Continent where it is mostly found in semiarid regions with open vegetation (Vilela, 1983; Vilela et al., 1983; Tidon-Sklorz and Sene, 1995b). The Drosophilaspecies in the hydei,mercatorum andrepleta subgroups are mostly generalists, while those in theinca andmullerisubgroups use cacti as breeding sites (Pereiraet al., 1983; Rafael and Arcos, 1989).
Thefasciolasubgroup comprises 21 species (Vilela, 1983; Vilela and Bächli, 1990; Bächli and Vilela, 2002), of which 13 species (D. carolinae,D. coroica,D. ellisoni,D. fascioloides, D. ivai, D. mapiriensis, D. moju, D. mojuoides,D. onca,D. papei,D. querubimae,D. rosinae andD. senei) have been recorded in Brazil. Regarding the geographical distribution of thefasciolasubgroup over the American Continent, five species (D. ellisoni,D. fasciola, D. moju,D. mojuoidesandD. pictura) are found in South and Central America, ten species (D. carolinae,D. coroica, D. fascioloides,D. ivai,D. mapiriensis,D. onca,D. papei, D. querubimae,D. rosinaeandD. senei) in South America,
Send correspondence to Erica Cristina de Carvalho Silva-Bernardi. Departamento de Genética, Faculdade de Medicina de Ribeirão Preto, Universidade de São Paulo, 14049-900 Ribeirão Preto, SP, Brazil. E-mail: [email protected].
four species (D. linearepleta, D. paraguttata, D. pictilis and D. prorepleta) in Central America and two (D. fulvalineataandD. hermionae) in North America (Vilela, 1983; Vilela and Bächli, 1990; Bächli and Vilela, 2002).
The species of thefasciolasubgroup inhabit mostly humid forests but little is known about the substrates with which they are associated except for the following:D. moju is known to feed on fallen blossoms and drier fruits (Pipkin, 1965);D. fasciolafeeds and breeds on the fallen flowers of Aphelandra micans(Acanthaceae), Erythrina berteroana (Fabaceae), Heliconia latispatha (Heliconiaceae), Aroid sp. (Araceae) and Coffea arabica fruits (Rubiaceae) (Pipkin, 1965; Pipkinet al., 1966);D. fulvalineatawas col-lected on fleshy fungi (Patterson and Wheeler, 1942);D. onca breeds in cladodes of decaying epiphytic cacti (Rhipsalissp.) (Seneet al., 1977);D. rosinaeemerged from cladodes of decaying columnar cacti (Cereus sp.) (Tidon-Sklorz and Sene, 1995b). The last two examples suggest that species of thefasciolasubgroup, even though inhabiting forests, may be associated with cacti. It has al-ready been noted thatD. rosinaeassociates with cacti of the genusCereusandOpuntia(Vilela, 1983; Tidon-Sklorz and Sene, 1995b) and our work described in the present paper concernsD. rosinaespecimens collected from dunes and rocky shores whereCereusandOpuntiawere growing.
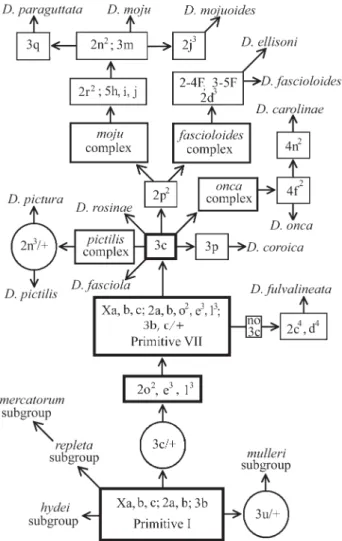
Most of the studies regarding the establishment of a phylogeny for thefasciolasubgroup have been cytological (Wasserman, 1962, 1982, 1992; Kuhnet al., 1995; Diniz and Sene, 2004). The existence of the 3c inversion in both themullericomplex of themullerisubgroup and in species of thefasciolasubgroup supports the hypothesis of a com-mon ancestry, with thefasciolasubgroup stemming from themullerisubgroup (Wasserman, 1982, 1992). However, Diniz and Sene (2004) recently showed that the fixed 3c in-version of themullericomplex is not the same as the one observed in thefasciolasubgroup, suggesting that the name of the inversion in themullericomplex should be changed from 3c to 3u. This suggests that the ancestral chromosomal composition of the fasciolasubgroup (Primitive VII) de-rived from the Primitive I, the ancestral sequence of the repletagroup (Wasserman, 1960; Wasserman, 1992) (Fig-ure 1). Furthermore, Diniz and Sene (2004) proposed two new species complexes within thefasciolasubgroup, the fascioloides complex made up of D. ellisoni and D. fascioloidesthat share the 2d3inversion, two chromosomal centric fusions (2-4F and 3-5F) and karyotype similarity re-garding the X chromosomes (Kuhnet al., 1995) (Figure 1) and theoncacomplex, containingD. carolinaeandD. onca which both share the 4f2inversion (Figure 1). Previously, chromosomal data had suggested two complexes, the pictiliscomplex (D. pictilisandD. pictura) and themoju complex (D. moju, D. mojuoides and D. paraguttata) (Wasserman, 1992) (Figure 1).
There are two hypotheses about the origin and diver-sification of therepletaspecies group. One hypothesis
sug-gests that the ancestral populations of thefasciolasubgroup were forest inhabitants that colonized the dry areas and led to the development of the species of the otherrepletagroup subgroups (Throckmorton, 1975, 1982; Moraiset al., 1995; Tatarenkov and Ayala, 2001), while the other hypothesis considers that thefasciolasubgroup is derived from species adapted to dry areas which later invaded forests (Wasserman, 1962, 1992) but this hypothesis was based on the sharing of the 3c inversion among species in the fasciolasubgroup and themullericomplex.
Many questions concerning the evolutionary relation-ships among the species in thefasciolasubgroup remain obscure. To help resolve this we analyzed partial sequences of the mitochondrial cytochrome oxidase subunit I (COI) gene of nine species of thefasciolasubgroup (Table 1) with the aim of trying to understand the origin and evolution of the this subgroup and consequently adding to the current knowledge on therepletagroup.
The species analyzed were collected using closed traps (Tidon-Sklorz and Sene, 1988) containing banana, or-ange and yeast. Flies from thefasciolasubgroup were iden-tified by morphological analysis of the aedeagus (male genitalia) (Vilela, 1983), males being directly identified and females indirectly by their male offspring.
We used D. melanogaster (NC_001709) and D. yakuba(NC_001322) as the outgroup in the phylogenetic analysis and D. hydei (hydei subgroup), D. mercatorum (mercatorumsubgroup),D. repleta(repletasubgroup) and D. serido(mullerisubgroup) were used to provide informa-tion on the relainforma-tionships between thefasciolasubgroup and the other subgroups of therepletagroup.
Genomic DNA was extracted from a single male of each species using the Wizard® Genomic DNA Purifica-tion kit (Promega) and the polymerase chain reacPurifica-tion (PCR) was used to amplifyCOIgene fragments using the primers TY-J-1460 - 5’TACAATTTATCGCCTAACTTC AGCC3’ (Simonet al., 1994) and 2191 - 5’TTGATTTTTT GGTCATCCAGAAGT3’ (De Britoet al., 1998). The fol-lowing amplifications conditions were used: 94 °C for 1 min 30 s followed by 25 cycles of 40 s at 94 °C, 40 s at 46 °C and 2 min at 72 °C. The PCR products were purified with the ExoSAP-IT® kit (Amersham Biosciences Part of GE Healthcare) and sequenced directly. Sequencing reac-tions were prepared with the BigDye® Terminator v3.1 Cycle Sequencing kit (Applied Biosystems) and reaction products sequenced on an ABI Prism 377 Automated DNA Sequencer.
Forward and reverse sequences of each taxa were compared, corrected and edited using the Chromas 2.3
pro-gram (http://www.technelysium.com.au/chromas_lite.html) and multiple sequence alignments were generated using the ClustalW 1.8 program (Thompsonet al., 1994). The pres-ence of saturation in the data was checked using Dambe 4.2.13 program (Xia and Xie, 2001).
Phylogenetic reconstruction was performed in a max-imum parsimony (MP) framework using the PAUP*4.0b10 program (Swofford, 2002) with the following settings: search type = heuristic; addition sequences = random; num-ber of replicates = 100; and branch swapping = Tree Bisec-tion ReconnecBisec-tion (TBR). Support at each node was assessed using bootstrap proportions (Felsenstein, 1985) with 1,000 replicates.
Reyeset al.(1999) and Bullet al. (2003) have sug-gested likely saturation problems for third mitochondrial codon positions and explored the use of a priori differential weighting of molecular characters. Bullet al. (2003) ob-tained the best resolution of the maximum parsimony anal-yses when third mtDNA codon positions were weighted by 0.5 and 0.1 with transitions excluded entirely. Based on this we used two weighting methods, one based on equal weighting of all informative characters and another omit-ting the transitions (zero weight) and assigning weights of 0.5 for the third codon positions with all other characters weighted equally.
Partial 624 nucleotide sequences from theCOIgene were obtained from all the species studied except D. repleta. The first base of the sequences obtained corre-sponded to position 1,510 of the mitochondrial DNA ofD. yakuba(NC_001322), the first codon from this base corre-sponding to the thirteenth amino acid of theCOIgene. No gaps were found but there were 193 variable characters (in-cluding the outgroup species) and 137 parsimony informa-tive characters. The third codon positions were the most variable, whereas the second codon positions were the most conserved in thisCOIgene region. There was an excess of T (38.9%) and A (28.9%) over G (16.7%) and C (15.5%). The saturation test (Figure 2) suggested likely saturation for transitions.
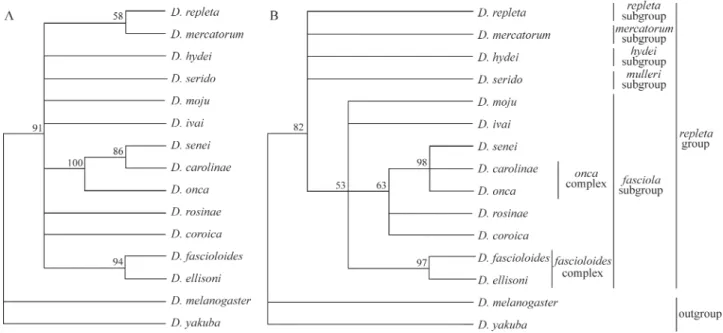
Phylogenetic analysis with equal weighting of all in-formative characters resulted in a single parsimony tree with consistency index (CI) of 0.450, retention index (RI) of 0.308 and a total length of 547 steps (Figure 3A). This parsimony tree contained a poorly resolved clade (repleta group). This polytomy can be explained by the reduced amount of phylogenetic information contained in the data due to the high level of saturation suggested for transitions (Figure 2) and/or for third codon positions. Multilocus se-quence analysis or the inclusion of morefasciolasubgroup taxa could provide enough information for a robust hypoth-eses. But inclusion of taxa could prove difficult since the strains might not be readily available.
On the basis of the likely saturation for transitions (Figure 2) and for third mtDNA codon positions (Allard and Carpenter, 1996; Reyeset al., 1999; Bullet al., 2003)
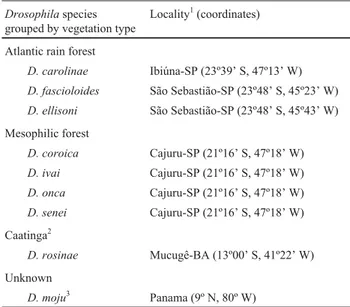
Table 1- TheDrosophilaspecies of thefasciolasubgroup used in this study, collection localities and type of vegetation.
Drosophilaspecies grouped by vegetation type
Locality1(coordinates)
Atlantic rain forest
D. carolinae Ibiúna-SP (23º39’ S, 47º13’ W)
D. fascioloides São Sebastião-SP (23º48’ S, 45º23’ W)
D. ellisoni São Sebastião-SP (23º48’ S, 45º43’ W)
Mesophilic forest
D. coroica Cajuru-SP (21º16’ S, 47º18’ W)
D. ivai Cajuru-SP (21º16’ S, 47º18’ W)
D. onca Cajuru-SP (21º16’ S, 47º18’ W)
D. senei Cajuru-SP (21º16’ S, 47º18’ W)
Caatinga2
D. rosinae Mucugê-BA (13º00’ S, 41º22’ W)
Unknown
D. moju3 Panama (9º N, 80º W)
1SP = São Paulo state, Brazil; BA = Bahia state, Brazil.
2
In Brazil this is an arid region of stunted vegetation and brushwood. 3Isoline provided by the Laboratório deDrosophila, Depto. de Genética,
we carried out a second maximum parsimony analysis with all transitions excluded (133 parsimony informative char-acters) and the third codons given a 0.5 weighting. This analysis resulted in a single parsimony tree with CI of 0.411, RI of 0.404 and a length of 137.5 steps (Figure 3B) with better resolution than the cladogram obtained with equal weighting of the characters (Figure 3A).
The cladograms obtained support monophyly of the repletagroup (Figure 3) when tested withD. melanogaster andD. yakuba(not a strong test), which is in agreement with other studies in the literature (Throckmorton, 1975, 1982; Wasserman, 1992; Tatarenkov and Ayala, 2001). On the other hand, Durando et al. (2000) suggest that the repletagroup is not monophyletic, although these authors
cautioned that this inference ‘...may be the result of poor resolution at the base of the phylogenetic tree’.
Therepletaandmercatorumsubgroups appeared as sister taxa only in the maximum parsimony analysis with equal character weighting, but support for this clade was low with a bootstrap value of only 58% (Figure 3A). This relationship has previously been suggested by morphologi-cal (Throckmorton, 1975), cytologimorphologi-cal (Wasserman, 1992) (Figure 1) and molecular data (Durandoet al., 2000; Tata-renkov and Ayala, 2001). The relationships among the other subgroups in therepletagroup were not resolved by our analysis, supporting previous work by Throckmorton (1975), Wasserman (1992) and Durandoet al.(2000).
The phylogeny with equal character weighting (Fig-ure 3A) did not suggest monophyly of the fasciola sub-group. We used the nonparametric Templeton test (Templeton, 1983) function of the PAUP* program to test if this departure from the conventional notion of the fasciolasubgroup relationships was significantly supported by theCOIgene data. This analysis showed significant dif-ferences (p = 0.0001) between the constrained topology monophyly of thefasciolasubgroup (522 steps) and the un-constrained topology (547 steps) (Figure 3A), with the con-strained topology explaining the data significantly better than the unconstrained topology. Therefore, the Templeton test showed that the data do not reject monophyly of the fasciolasubgroup. The phylogeny obtained using differen-tial weightings (Figure 3B) suggested monophyly of the fasciolasubgroup, but again, support for this clade was low with a 53% bootstrap and the Templeton test indicated no significant differences (p = 0.6844) between the topology of the Figure 3B (137.5 steps) and the constrained topology
Figure 3- Phylogenetic relationships among species of therepletagroup and thefasciolasubgroup inferred from partial sequences of the mitochondrial cytochrome oxidase subunit I (COI) gene, based upon MP analysis. Bootstrap values for 1,000 replicates are given at the nodes. A) Equal weighting of all informative characters. B) Transitions were excluded and third codon positions assigned weights 0.5.
Figure 2- Plot of the number of transitions (S) and transversions (V)vs.
of monophyly of thefasciolasubgroup (136.5 steps). Thus, ourCOIgene data neither rejected nor supported the con-cept of monophyly of thefasciolaspecies subgroup.
The phylogenies did not define all the interspecific re-lationships in thefasciolasubgroup. In both of the hypothe-ses described aboveD. ellisoniandD. fascioloidesappear as sister species (Figure 3), which is in agreement with the cytogenetic data produced by Diniz and Sene (2004) (Fig-ure 1). In the differentially weighted phylogeny (Fig(Fig-ure 3B) the speciesD. carolinae,D. coroica,D. onca,D. rosinae andD. seneiformed a single clade with a 63% bootstrap in whichD. carolinae,D. oncaandD. seneiformed a nested polytomy with a 98% bootstrap. However, the equally weighted cladogram (Figure 3A) indicated thatD. onca, D. carolinae andD. seneicomprised one clade in whichD. carolinaeandD. seneiappeared as sister species, contra-dicting the morphological data suggesting thatD. carolinae andD. oncaare sister taxa (Vilela, 1983) but which shows no relationship betweenD. carolinaeandD. senei. The re-lationships between the other species were not defined in the equally weighted cladogram. Our results are in agree-ment with theories on thefascioloidesandoncacomplexes proposed by Diniz and Sene (2004). It is possible thatD. seneialso belongs to theoncacomplex, but additional cyto-logical data are necessary to confirm this hypothesis.
Because the relationships between the subgroups were not defined our results show no evidence that the an-cestral populations of therepleta group inhabited forests (Morais et al., 1995; Throckmorton, 1975, 1982; Tata-renkov and Ayala; 2001) or arid areas (Wasserman, 1962, 1992).
However, the hypothesis that thefasciolasubgroup represents the oldest lineage of therepleta group is sup-ported by data produced by Throckmorton (1982) suggest-ing that the species groups of thevirilis-repletaradiation, closely related to therepleta group (castanea,canalinea, dreyfusi and mesophragmatica groups), occur in forests and that, morphologically, thefasciolasubgroup is the least derivedrepletagroup subgroup. Furthermore, Moraiset al. (1995) conducted ecological studies of Drosophila yeast communities associated to species of thefasciolasubgroup and produced data suggesting that this subgroup represents the lineage from which the South American species of the repleta group evolved. More recently, Tatarenkov and Ayala (2001) used the nuclear genesDdcandamdto con-struct a molecular phylogeny of thevirilis-repletaradiation which strongly indicates that thefasciolasubgroup is the earliest offshoot in therepletagroup. It thus seems that, as with the fasciola subgroup, the ancestral repleta group probably inhabited forests.
While supporting monophyly of the repleta group, our data clearly does not resolve the phylogenetic relation-ships in thefasciolasubgroup, possibly due to saturation in relation to the mitochondrial gene used to construct the phylogeny (Allard and Carpenter, 1996; Reyeset al., 1999;
Durando et al., 2000; Bull et al., 2003). Research using nuclear genes could help elucidate the phylogenetic rela-tionships in thefasciolasubgroup and between this and the other subgroups of therepletagroup.
Acknowledgments
We thank Dr. Reinaldo O.A. de Brito for providing representativehydei,mercatorum,mulleriandrepleta sub-groupsCOIgene sequences and also the Universidade de São Paulo (USP), Conselho Nacional de Desenvolvimento Científico e Tecnológico (CNPq), Coordenação de Pessoal de Nível Superior (CAPES) and the Fundação de Amparo à Pesquisa do Estado de São Paulo (FAPESP) for financial support and a personal fellowship from Fundação de Am-paro à Pesquisa do Estado de São Paulo (FAPESP) proc. 02/02195-9 for E.C.C. Silva-Bernardi. We also thank two anonymous referees for their helpful comments.
References
Allard MW and Carpenter JM (1996) On weighting and congru-ence. Cladistics 12:183-198.
Bächli G and Vilela CR (2002) Six new species ofDrosophila
(Diptera, Drosophilidae) from Parque Nacional Henri Pittier, Venezuela. Mitt Schweiz Ent Ges 75:223-243. Bull NJ, Schwarz MP and Cooper SJB (2003) Phylogenetic
diver-gence of the Australian allodapine bees (Hymenoptera, Apidae). Mol Phylogenet Evol 27:212-222.
De Brito RA, Manfrin MH and Sene FM (1998) Use of nuclear and mitochondrial data to investigate evolution and phylo-genetic relationships of the repleta group (genus
Drosophila) radiation. Genet Mol Biol 21(suppl):258. Diniz NM and Sene FM (2004) Chromosomal phylogeny of the
Drosophila fasciola species subgroup revisited (Diptera, Drosophilidae). Genet Mol Biol 27:561-566.
Durando CM, Baker RH, Etges WJ, Heed WB, Wasserman M and DeSalle R (2000) Phylogenetic analysis of therepleta spe-cies group of the genusDrosophilausing multiple sources of characters. Mol Phylogenet Evol 16:296-307.
Etges WJ, Armella MA, O’Grady PM and Heed WB (2001) Two new species ofDrosophila(Diptera, Drosophilidae) in the
repletagroup from Mexico. Ann Entomol Soc Am 94:16-20.
Felsenstein J (1985) Confidence limits on phylogenies: An ap-proach using the bootstrap. Evolution 39:783-791. Kuhn GCS, Diniz NM, Alves MAR and Sene FM (1995)
Cons-tituição cariotípica de espécies do subgrupo fasciola do grupo repleta do gênero Drosophila. Rev Bras Genet 18(suppl):282.
Morais PB, Rosa CA, Hagler AN and Mendonça-Hacler LC (1995) Yeast communities as descriptors of habitat use by theDrosophila fasciolasubgroup (repletagroup) in Atlantic rain forests. Oecologia 104:45-51.
Patterson JT and Wheeler MR (1942) Description of new species of the subgenera Hirtodrosophila and Drosophila. Univ Texas Publ 4213:67-109.
genus Drosophila (Diptera, Drosophilidae). Cienc Cult 35:1313-1319.
Pipkin SB (1965) The influence of adult and larval food habits on population size of neotropical ground-feedingDrosophila. Am Midl Nat 74:1-27.
Pipkin SB, Rodriguez RL and Leon J (1966) Plant host specificity among flower-feeding Neotropical Drosophila (Diptera, Drosophilidae). Am Nat 100:135-156.
Rafael V and Arcos G (1989) Subgrupoinca, un nuevo subgrupo del grupo repleta, con descripcíon de Drosophila huancavilcae N.SP. (Diptera, Drosophilidae). Evol Biol 3:233-243.
Reyes SG, Cooper SJB and Schwarz MP (1999) Species phylog-eny of the bee genusExoneurellaMichener (Hymenoptera, Apidae, Allodapini): Evidence from molecular and morpho-logical data sets. Ann Entomol Soc Am 92:20-29.
Sene FM, Paganelli CHM, Pedroso LG, Garcia E and Palombo CR (1977) Local natural de criação deDrosophila onca
Dobzhansky & Pavan, 1943. Cienc Cult 29(suppl):716. Simon C, Frati F, Beckenbach A, Crespi B, Liu H and Flook P
(1994) Evolution, weighting, and phylogenetic utility of mi-tochondrial gene sequences and a compilation of conserved polymerase chain reaction primers. Ann Entomol Soc Am 87:651-701.
Swofford DL (2002) PAUP*. Phylogenetic Analysis Using Parsi-mony (*and Other Methods), Version 4. Sinauer Associates, Sunderland, Massachusetts.
Tatarenkov A and Ayala FJ (2001) Phylogenetic relationships among species groups of the virilis-repleta radiation of
Drosophila. Mol Phylogenet Evol 21:327-331.
Templeton AR (1983) Phylogenetic inference from restriction endonuclease cleavage site maps with particular reference to the evolution of humans and the apes. Evolution 37:221-244.
Thompson JD, Higgins DG and Gibson TJ (1994) CLUSTALW: Improving the sensitivity of progressive multiple sequence alignment through sequence weighting, positions-specific gap penalties and weight matrix choice. Nucleic Acids Res 22:4673-4680.
Throckmorton LH (1975) The phylogeny, ecology and geography ofDrosophila. In: King RC (ed) Handbook of Genetics. Ple-num Press, New York, pp 421-459.
Throckmorton LH (1982) Pathways of evolution in the genus
Drosophilaand the founding of therepletagroup. In: Barker JSF and Starmer WT (eds) Ecological Genetics and
Evolu-tion: The Cactus-Yeast-Drosophila Model System. Aca-demic Press, New York, pp 33-48.
Tidon-Sklorz R and Sene FM (1988) A trap that retains and keeps
Drosophilaalive. Drosoph Inf Serv 67:89.
Tidon-Sklorz R and Sene FM (1995a)Drosophila serieman. sp.: New member of the Drosophila serido (Diptera, Drosophilidae) superspecies taxon. Ann Entomol Soc Am 88:139-142.
Tidon-Sklorz R and Sene FM (1995b) Fauna of Drosophila
(Diptera, Drosophilidae) in the northern area of the “Cadeia do Espinhaço”, states of Minas Gerais and Bahia, Brazil: Biogeographical and ecological aspects. Iheringia, Sér Zool 78:85-94.
Tidon-Sklorz R and Sene FM (2001) Two new species of the
Drosophila serido sibling set (Diptera, Drosophilidae). Iheringia, Sér Zool 90:141-146.
Vilela CR (1983) A revision of theDrosophila repletaspecies group (Diptera, Drosophilidae). Rev Bras Entomol 27:1-114.
Vilela CR and Bächli G (1990) Taxonomic studies on Neotropical species of seven genera of Drosophilidae (Diptera). Mitt Schweiz Ent Ges 63(suppl):1-332.
Vilela CR, Pereira MAQR and Sene FM (1983) Preliminary data on the geographical distribution of Drosophila species within morphoclimatic domains of Brazil: II. Therepleta
group. Cienc Cult 35:66-70.
Wasseman M (1960) Cytological and phylogenetic relationships in therepletagroup of the genus Drosophila. Proc Nat Acad Sci 46:842-859.
Wasserman M (1962) Cytological studies of therepletagroup of the genus Drosophila: VI. The fasciola subgroup. Univ Texas Publ 6205:119-134.
Wasserman M (1982) Evolution of the repleta group. In: Ashburner M, Carson HL and Thompson JN (eds) The Ge-netics and Biology ofDrosophila. v. 3b. Academic Press, London, pp 61-139.
Wasserman M (1992) Cytological evolution of theDrosophila repletaspecies group. In: Krimbas CB and Powell JR (eds)
Drosophila Inversion Polymorphism. CRC Press, Boca Raton, pp 455-555.
Xia X and Xie Z (2001) DAMBE: Data analysis in molecular biol-ogy and evolution. Journal of Heredity 92:371-373.
Internet Resources
Chromas Software, http://www.technelysium.com.au/chromas_ lite.html.