Research Article
Potential Cardiovascular Risk Protection of Bilirubin in
End-Stage Renal Disease Patients under Hemodialysis
Maria do Sameiro-Faria,
1,2Michaela Kohlova,
3Sandra Ribeiro,
3,4Petronila Rocha-Pereira,
4,5Laetitia Teixeira,
1Henrique Nascimento,
3,4Flávio Reis,
6Vasco Miranda,
2Elsa Bronze-da-Rocha,
3,4Alexandre Quintanilha,
1,4Luís Belo,
3,4Elísio Costa,
3,4and Alice Santos-Silva
3,41Instituto de Ciˆencias Biom´edicas Abel Salazar, Universidade do Porto, Rua Jorge Viterbo Ferreira 228, 4050-313 Porto, Portugal 2Frenesius Medical Care, Nephrocare Maia, SA, Rua Altos 70, Maia, 4470-235 Porto, Portugal
3Laborat´orio de Bioqu´ımica, Departamento de Ciˆencias Biol´ogicas, Faculdade Farm´acia, Universidade do Porto,
Rua Jorge Viterbo Ferreira 228, 4050-313 Porto, Portugal
4Instituto de Biologia Molecular e Celular (IBMC), Universidade do Porto, Rua do Campo Alegre 823, 4150-180 Porto, Portugal 5Centro Investigac¸˜ao Ciˆencias Sa´ude, Universidade Beira Interior, Covilh˜a, Avenida Infante D. Henrique, 6200-506 Covilh˜a, Portugal 6IBILI, Faculdade de Medicina, Universidade de Coimbra, Azinhaga Santa Comba, Celas, 3000-548 Coimbra, Portugal
Correspondence should be addressed to Alice Santos-Silva; assilva@ff.up.pt Received 16 June 2014; Accepted 19 August 2014; Published 10 September 2014 Academic Editor: Javier Gonz´alez-Gallego
Copyright © 2014 Maria do Sameiro-Faria et al. This is an open access article distributed under the Creative Commons Attribution License, which permits unrestricted use, distribution, and reproduction in any medium, provided the original work is properly cited. We evaluated the potential cardiovascular risk protection of bilirubin in hemodialysis (HD) patients. An enlarged set of studies were evaluated in 191 HD patients, including hematological study, lipid profile, iron metabolism, nutritional, inflammatory markers, and dialysis adequacy. The TA duplication screening in the UDP-glucuronosyltransferase 1 A1 (UGT1A1) promoter region was also performed. The UGT1A1 genotype frequencies in HD patients were 49.2%, 42.4%, and 8.4% for 6/6, 6/7, and 7/7 genotypes, respectively. Although no difference was found in UGT1A1 genotype distribution between the three tertiles of bilirubin, significant differences were found with increasing bilirubin levels, namely, a decrease in platelet, leukocyte, and lymphocyte counts, transferrin, oxidized low-density lipoprotein (ox-LDL), ox-LDL/low-density lipoprotein cholesterol ratio, apolipoprotein (Apo) A, Apo B, and interleukin-6 serum levels and a significant increased concentration of hemoglobin, hematocrit, erythrocyte count, iron, transferrin saturation, Apo A/Apo B ratio, adiponectin, and paraoxonase 1 serum levels. After adjustment for age these results remained significant. Our data suggest that higher bilirubin levels are associated with beneficial effects in HD patients, by improving lipid profile and reducing the inflammatory grade, which might contribute to increase in iron availability. These results suggest a potential cardiovascular risk protection of bilirubin in HD patients.
1. Introduction
Despite the technological advances in hemodialysis (HD) procedures and medical support in the last years, the mortal-ity and morbidmortal-ity of end-stage renal disease (ESRD) patients under HD remain 10 to 20 times higher than those observed in the general population [1–3]. Cardiovascular disease (CVD) events are the main cause of death in these patients [2]. The prevalence of the classic cardiovascular risk fac-tors, namely, hypertension, diabetes mellitus, dyslipidemia, smoking habits, and advanced age per se, cannot explain
the cardiovascular mortality rate. The enhanced inflam-matory response and oxidative stress usually observed in HD patients or even other unknown factors may, therefore, play an important role in the cardiovascular morbidity and mortality rate in ESRD patients under HD [4].
In 1987, bilirubin was proposed as a potential physiologi-cal antioxidant and anti-inflammatory agent by Stocker et al.;
they showed that bilirubin, at physiological concentrations,
protects cell membrane fatty acids from oxidation by peroxyl radicals [5]. It has been shown that both the unconjugated and conjugated forms of bilirubin can protect low-density
Volume 2014, Article ID 175286, 9 pages http://dx.doi.org/10.1155/2014/175286
lipoprotein cholesterol (LDL-c) and other lipids from oxi-dation by reactive oxygen species [6–8], leading to reduced baseline levels of oxidized LDL, especially in individuals with higher bilirubin levels [9]. Several other in vitro and in vivo
studies [5, 10–14] showed bilirubin as an antioxidant and,
therefore, as an important factor in tissue protection against
oxidative and inflammatory damage [12,15,16].
Bilirubin is a water-insoluble compound that requires glucuronidation by a microsomal enzyme, the uridine diphosphate glucuronosyltransferase-1 A1 (UGT1A1), to be excreted. The UGT1A1 locus has been mapped to chromo-some 2q37 [17] and one of the most common genetic variants that affects the glucuronidation of bilirubin in Caucasians is a TA duplication polymorphism in the TATA box region of the promoter. Homozygous individuals carrying the A(TA)7TAA allele (c.-41 -40dupTA or [TA]7) have higher levels of uncon-jugated bilirubin, caused by a reduction of 30% in the UGT1A1 transcription [17]. There are few studies on the effect of bilirubin levels and/or of UGT1A1 gene polymorphism in the outcome of CVD in the general population, namely, in the development of coronary artery disease, coronary heart disease, peripheral vascular disease, and stroke. Recent epidemiological evidences showed a reduced incidence of lung disease and all-cause mortality in individuals with high serum bilirubin levels and with Gilbert’s syndrome [18– 20]. Moreover, a study evaluating the impact of bilirubin levels and of UGT1A1 polymorphisms on CVD risk and mortality in ESRD under HD [21] showed that HD patients with lower serum bilirubin levels presented a more adverse outcome and, therefore, that the 7/7 genotype might have an important effect on preventing CVD events and death. Nevertheless, the mechanisms underlying this protective effect of bilirubin, in the general population and in ESRD patients, still remain obscure. Multiple mechanisms could explain the protective effect of bilirubin, including antioxi-dant and anti-inflammatory pathways, which may be related to the powerful redox cycle mediated by biliverdin reductase that may protect against pathological oxidation processes occurring during cardiovascular disease [22].
In this work, we aimed to evaluate the potential car-diovascular risk protection of bilirubin in ESRD patients under HD. For this, clinical and sociodemographic data, lipid profile, hematological, dialysis adequacy, inflammatory and iron metabolism markers, and screening for the TA duplication in the TATA box of the UGT1A1 promoter were studied in an ESRD Portuguese sample.
2. Material and Methods
2.1. Subjects. This transversal study included 191 ESRD
Por-tuguese patients under HD (105 males and 86 females, mean age: 66.13 years; standard derivation [SD]: 14.02 years). All participants gave their informed consent to participate in this study that was previously approved by the Ethics Committee of Fresenius Medical Care, Portugal.
Patients with malignancy, autoimmune disease, and inflammatory or infectious diseases and with increased levels of alanina transaminase and/or aspartate transaminase were
excluded. Patients were under therapeutic HD three times per week, 3–5 hours each session, for a median time of 2.13 (0.82–5.24) years, with a dose of darbepoetin-𝛼 of
0.4 (0.2–0.7)𝜇g/kg/week. For the HD procedure, high-flux
polysulfone FX-class dialyzer of Fresenius (Bad Hamburg, Germany) was used. The main causes of renal failure in our patients were diabetic nephropathy (𝑛 = 69), hypertensive nephrosclerosis (𝑛 = 22), nephritic syndrome (𝑛 = 10), pol-ycystic kidney disease (𝑛 = 8), obstructive diseases (𝑛 = 7), hereditary nephropathy (𝑛 = 3), chronic interstitial nephritis (𝑛 = 2), benign prostate hypertrophy (𝑛 = 1), other diseases (𝑛 = 8), and uncertain etiology (𝑛 = 61). The Kt/V urea was calculated using standard formula that takes into considera-tion the postdialysis serum urea nitrogen concentraconsidera-tion and compares this with the initial or predialysis level.
Blood was collected immediately before the HD proce-dure, on the second dialysis session of the week, into tubes containing ethylenediaminetetraacetic acid (EDTA) and into tubes without anticoagulant, in order to obtain whole blood, serum, and plasma. Blood samples were processed within 2 hours of collection. Aliquots of plasma, serum, and buffy
coat were immediately stored at−80∘C until the assays were
performed.
2.2. Hematologic and Biochemical Assays. Platelet, leukocyte,
and erythrocyte counts and hematocrit and hemoglobin concentration were measured by using an automatic blood cell counter (Sysmex K1000; Sysmex, Hamburg, Germany). Differential leukocyte counts were evaluated in Wright-stained blood smears. Reticulocyte count was made by microscopic counting on blood smears after vital staining with new methylene blue (reticulocyte stain; Sigma, St. Louis, MO, USA). The reticulocyte production index (RPI) was calculated as an appropriate way to measure the effective erythrocyte production, by correcting for both changes in hematocrit (degree of anemia) and for premature reticulocyte release from the bone marrow [22]. Total bilirubin (TB) was evaluated using a commercially available kit (diazotized sulfanilic acid reaction, Roche Diagnostic).
Serum iron concentration was determined using a col-orimetric method (Iron, Randox Laboratories Ltd., North Ireland, UK), whereas serum ferritin and transferrin were measured by immunoturbidimetry (Ferritin, Laboratories Ltd., North Ireland, UK; Transferrin, Laboratories Ltd., North Ireland, UK). Transferrin saturation (TS) was calculated by
the formula: TS(%) = 70.9× serum iron concentration in
𝜇g/dL/serum transferrin concentration in mg/dL. Enzyme-linked immunosorbent assays were used to measure serum soluble transferrin receptor (sTfR; human sTfR immunoas-say, R&D Systems, Minneapolis, MN, USA). Plasma levels of hepcidin-25 were quantified using a peptide enzyme immunoassay (Bachem Group, Peninsula Laboratories, LLC, San Carlos, California).
The lipid profile was performed in an autoanalyzer (Cobas Mira S, Roche, Basel, Switzerland), using commercially avail-able kits; total cholesterol and triglycerides concentrations were determined by enzymatic colorimetric tests (cholesterol oxidase-phenol aminophenazone and glycerol-3-phosphate
oxidase-phenol aminophenazone methods, Roche, resp.); high-density lipoprotein cholesterol (HDL-c) and LDL-c were measured using enzymatic colorimetric tests, after selective separation of HDLc and LDLc fractions (direct HDL cholesterol and direct LDL cholesterol, Roche, resp.); oxidized LDL (Ox-LDL) was measured directly in plasma by using a two-site enzyme immunoassay (oxidized LDL ELISA, Mercodia, Uppsala, Sweden); serum levels of apolipoprotein A-I (Apo A-I) and Apo B were evaluated by immunotur-bidimetric assays (unikit apolipoprotein A-I and B specific antiserums, Roche); serum lipoprotein(a) [Lp(a)] was quanti-fied by using an immunoturbidimetric method (Lp(a) Roche Diagnostics).
Serum C-reactive protein (CRP) was determined by nephelometry [CRP (latex) high-sensitivity, Roche Diag-nostics] and serum interleukin-6 (IL-6) was evaluated by enzyme immunoassays (human IL-6 high-sensitivity ELISA, eBioscience, Vienna, Austria). Serum albumin levels were measured using a colorimetric assay end-point method (albumin plus; Roche GmbH, Mannheim, Germany). Plasma levels of adiponectin were evaluated by using a standard com-mercial enzyme-linked immunoassay (Bender MedSystems, San Diego, CA, USA).
The activity of paraoxonase 1 (PON1) was assessed spectrophotometrically and expressed in nmol of p-nitro-phenol/mL/min. Briefly, paraoxonase activity was measured by adding serum to 1 mL Tris/HCl buffer (100 mmol/L, pH
8.0) containing 2 mmol/L CaCl2 and 5.5 mmol/L paraoxon
(O,O-diethyl-O-p-nitrophenylphosphate; Sigma Chemical Co.). The rate of generation of p-nitrophenol was determined
by reading the absorbance at 412 nm, at 37∘C, with the use of
a continuously recording spectrophotometer (Beckman DU-68).
2.3. DNA Analysis. Genomic DNA was extracted from white
blood cells (buffy coat) by proteinase K/salt precipitation method. Genotyping TA duplication in the TATA box of the UGT1A1 promoter was performed by polymerase chain reaction (PCR). Amplification reaction was carried out in a thermocycler (MiniOpticon Real-Time PCR Detection
System; Biorad) using 2𝜇L of DNA, 0.5 𝜇L of each primer at
a concentration of 10 pmol (forward: 5
-TAACTTGGTGTA-TCGATTGGTTTTTG-3; reverse: 5
-ACAGCCATGGCG-CCTTTGCT-3) and 7.5𝜇L of PCR Master Mix Promega
(M750B) and water for a final volume of 15𝜇L. The first step
of PCR was 95∘C denaturation for 5 minutes, followed by
35 cycles: denaturation at 95∘C for 30 seconds, annealing
at 55∘C for 30 seconds, extension at 72∘C for 45 seconds,
and final extension at 72∘C for 10 minutes. PCR was
fol-lowed by electrophoresis in 15% polyacrylamide gel in a Tris/borate/EDTA buffer; the gel was stained with silver nitrate and photographed.
2.4. Statistical Analysis. Statistical analysis was performed
using the Statistical Package for Social Sciences (SPSS, version 21.0) for Windows (SPSS Inc., Armonk, NY, USA). The normal distribution of continuous variables was analyzed using the Kolmogorov-Smirnov test. Continuous variables
0.20 0.40 0.60 0.80 B ilir ub in (m g/dL) 6/6 6/7 7/7 UGT1A1 polymorphism P < 0.05 P < 0.05
Figure 1: Total bilirubin levels in ESRD patients under HD accord-ing to the number of TA repeats in the promoter region of UGT1A1.
without normal distribution were log transformed. ANOVA, supplemented with Tukey’s HSD post hoc test, was conducted in order to evaluate the effect of tertiles of bilirubin on continuous covariates. ANCOVA analysis was performed for age adjustment. The association between tertiles of bilirubin and categorical variables was analyzed using the Chi-squared test or Fisher’s exact test. Pearson’s rank correlation coefficient was used to evaluate relationships between sets of data. The
significance level(𝛼) was set at 0.05.
3. Results
The results were analyzed by two ways, according to the
UGT1A1 genotype, in order to evaluate the changes associated
with a decreasing UGT1A1 activity, and in accordance with bilirubin levels. For the second analysis, we used the tertiles
of TB as follows: TB< 0.21 mg/dL (T1), TB 0.21–0.3 mg/dL
(T2), and TB> 0.3 mg/dL (T3).
The UGT1A1 genotype frequencies in our HD patients were 49.2%, 42.4%, and 8.4% for 6/6, 6/7, and 7/7 genotypes, respectively. When we stratified the results according to the UGT1A1 genotype, we found that HD patients with the 7/7 genotype presented significantly higher TB levels than patients with 6/6 genotype and that patients with the 6/7 genotype showed significantly higher TB levels than patients with 6/6 genotype (Figure 1). The HD patients with the 7/7 genotype presented also a significant increase in HDL-c (6/6
genotype: 38.5± 13.4 mg/dL; 6/7 genotype: 37.0 ± 12.4 mg/dL;
7/7 genotype: 52.7± 17.0 mg/dL; 𝑃 < 0.05, 7/7 genotype versus
6/6 and 6/7 genotypes). Beyond the increase in HDL-c and bilirubin in HD patients with 7/7 genotype, no additional significant differences were observed for the other studied variables.
When performing multiple comparisons between the bilirubin tertile groups (Table 1), we observed lower values of platelets, white blood cells, and lymphocytes in HD patients in the third tertile group. Concerning the iron metabolism, this third tertile group showed increasing values in iron and
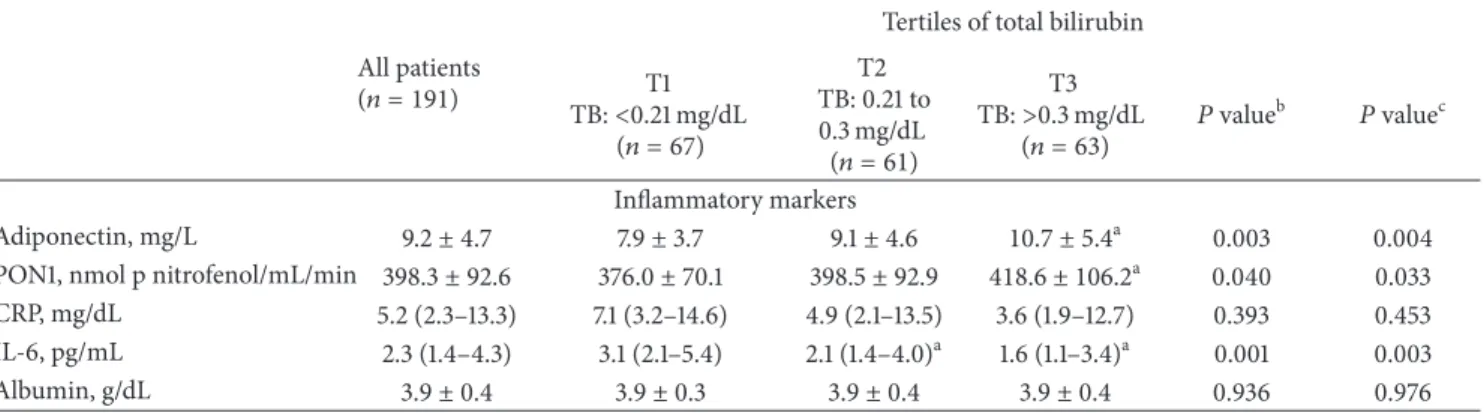
Table 1: Results of studied variables (sociodemographic data and dialysis adequacy, UGT1A1 genotype, hematological data, iron metabolism, lipid profile, and inflammatory markers) by tertiles of bilirubin.
All patients (𝑛 = 191)
Tertiles of total bilirubin T1 TB:<0.21 mg/dL (𝑛 = 67) T2 TB: 0.21 to 0.3 mg/dL (𝑛 = 61) T3 TB:>0.3 mg/dL (𝑛 = 63) 𝑃 value b 𝑃 valuec
Sociodemographic data and dialysis adequacy
Age, years 66.1± 14.0 67.7± 13.6 65.5± 15.5 65.1± 13.0 0.511 — Gender (male),𝑛 (%) 105 (55) 33 (49.3) 31 (50.8) 41 (65.1) 0.142 — Kt/V urea 1.5± 0.3 1.5± 0.4 1.5± 0.2 1.4± 0.2 0.360 0.362 Creatinine, mg/dL 8.1± 2.8 7.7± 2.4 8.2± 2.6 8.5± 3.3 0.306 0.407 Urea reduction ratio, % 76.0± 6.6 76.2± 7.6 76.8± 6.2 75.1± 5.6 0.377 0.382 Dose of darbepoetin-𝛼, 𝜇g/kg/week 0.4 (0.2–0.7) 0.5 (0.3–0.8) 0.4 (0.2–0.6) 0.5 (0.2–0.9) 0.311 0.335 Central venous catheter use,𝑛 (%) 44 (23.0) 20 (29.9) 14 (23.0) 10 (15.9) 0.167 — BMI, kg/m2 25.9± 4.6 26.3± 5.4 26.1± 4.1 25.3± 4.2 0.370 0.421 UGT1A1 genotype 6/6,𝑛 (%) 94 (49.2) 33 (49.3) 35 (57.4) 26 (41.3) 0.236 — 6/7,𝑛 (%) 81 (42.4) 31 (46.3) 20 (32.8) 30 (47.6) 7/7,𝑛 (%) 16 (8.4) 3 (4.5) 6 (9.8) 7 (11.1) Hematological data Hemoglobin, g/dL 11.7± 1.4 11.4± 1.5 12.0 ± 1.4a 11.8± 1.3 0.042 0.041 Hematocrit, % 36.4± 4.6 35.3± 4.5 37.5 ± 4.7a 36.6± 4.3 0.026 0.022 Erythrocytes,×1012/L 3.8± 0.5 3.7± 0.5 4.0 ± 0.5a 3.8± 0.5 0.043 0.042 Reticulocytes,×109/L 49.3 (27.4–72.8) 56.0 (28.5–75.6) 40.1 (28.3–66.8) 50.8 (26.2–74.7) 0.318 0.325 RPI 0.9 (0.5–1.4) 0.9 (0.5–1.3) 0.8 (0.5–1.4) 1.1 (0.5–1.5) 0.834 0.830 Platelets,×109/L 183.7± 55.1 197.7± 59.9 175.8± 43.6 164.0 ± 53.6a 0.027 0.040
White blood cells,×109/L 6.4± 2.0 6.9± 2.0 6.3± 2.0 6.0 ± 1.9a 0.046 0.057
Neutrophils,×109/L 4.0± 1.5 4.2± 1.3 3.8± 1.6 3.8± 1.6 0.247 0.287 Lymphocytes,×109/L 1.7± 0.7 1.8± 0.9 1.7± 0.6 1.5 ± 0.5a 0.011 0.011 Neutrophil/lymphocyte ratio 2.3 (1.8–3.3) 2.3 (1.8–3.4) 2.2 (1.5–3.0) 2.5 (2.0–3.3) 0.119 0.120 Iron metabolism Iron, mg/dL 38.0 (30.0–54.0) 36.0 (29.0–43.0) 41.0 (29.0–55.0) 44.0 (32.0–56.0)a 0.005 0.006 Transferrin, mg/dL 184.3± 35.6 193.3± 34.6 182.4± 39.4 176.4 ± 31.1a 0.023 0.024 Transferrin saturation, % 17.7± 10.8 13.9± 6.2 17.7± 9.4 21.5 ± 14.1a <0.001 <0.001 sTfR, nmol/L 23.3± 11.9 21.7± 9.4 25.0± 14.2 23.4± 11.7 0.281 0.284 Ferritin, ng/mL 402.0± 152.6 369.3± 153.9 419.4± 162.7 419.8± 137.0 0.093 0.090 Hepcidin-25, ng/mL 1599.1 (863.6–2409.0) 1738.0 (1144.3–2637.7) 1649.8 (931.7–2440.1) 1476.6 (537.8–2350.0) 0.108 0.101 Lipid profile Total cholesterol, mg/dL 154.4± 43.4 156.7± 34.6 151.3± 35.1 155.0± 57.3 0.777 0.796 Triglyceride, mg/dL 119.0 (91.0–176.0) 135.0 (91.0–183.0) 113.0 (96.5–172.5) 109.0 (85.0–151.0) 0.156 0.103 HDL-cholesterol, mg/dL 42.3± 13.5 41.7± 12.1 42.5± 13.6 42.7± 14.9 0.908 0.888 LDL-cholesterol, mg/dL 73.5± 29.5 73.8± 28.5 73.2± 28.0 73.4± 32.2 0.992 0.999 ox-LDL, U/L 36.0± 15.4 39.8± 21.3 34.5± 8.6 33.2 ± 12.0a 0.033 0.041
ox-LDL/LDL-c ratio, U/mg 0.053± 0.019 0.058± 0.025 0.051 ± 0.013a 0.048 ± 0.013a 0.007 0.005 Lp(a), mg/dL 45.4 (25.2–88.1) 50.4 (27.3–106.2) 45.4 (24.1–89.1) 37.4 (24.7–68.2)a 0.052 0.071 Apo A, mg/dL 123.1± 30.5 128.9± 32.4 125.7± 32.7 114.3 ± 23.8a 0.017 0.013 Apo B, mg/dL 72.8± 21.8 81.8± 21.3 70.6 ± 18.9a 65.4 ± 31.9a <0.001 <0.001
Table 1: Continued.
All patients (𝑛 = 191)
Tertiles of total bilirubin T1 TB:<0.21 mg/dL (𝑛 = 67) T2 TB: 0.21 to 0.3 mg/dL (𝑛 = 61) T3 TB:>0.3 mg/dL (𝑛 = 63) 𝑃 value b 𝑃 valuec Inflammatory markers Adiponectin, mg/L 9.2± 4.7 7.9± 3.7 9.1± 4.6 10.7 ± 5.4a 0.003 0.004 PON1, nmol p nitrofenol/mL/min 398.3± 92.6 376.0± 70.1 398.5± 92.9 418.6 ± 106.2a 0.040 0.033
CRP, mg/dL 5.2 (2.3–13.3) 7.1 (3.2–14.6) 4.9 (2.1–13.5) 3.6 (1.9–12.7) 0.393 0.453 IL-6, pg/mL 2.3 (1.4–4.3) 3.1 (2.1–5.4) 2.1 (1.4–4.0)a 1.6 (1.1–3.4)a 0.001 0.003 Albumin, g/dL 3.9± 0.4 3.9± 0.3 3.9± 0.4 3.9± 0.4 0.936 0.976
a𝑃 value < 0.05 for post hoc test considering T1 as reference category;b
ANOVA analysis for continuous covariates and Chi-squared test or Fisher’s exact test for categorical covariates.cAdjusting for age (ANCOVA). BMI: body mass index; RPI: reticulocyte production index; sTfR: soluble transferrin receptor; HDL: high-density lipoprotein; LDL: low-density lipoprotein; ox-LDL: oxidized low-density lipoprotein; Lp(a): lipoprotein (a); Apo A: apolipoprotein A; Apo B: apolipoprotein B; PON1: paraoxonase 1; CRP: C-reactive protein; IL-6: interleukin-6.
transferrin saturation and decreasing values in transferrin. In the lipid profile, lower values were found for ox-LDL, ox-LDL/LDLc ratio, Lp(a), Apo A, and Apo B and higher values for Apo A/Apo B ratio in the third tertile compared to the first and second tertiles groups. Increasing values of adiponectin and PON1 were also observed in the third tertile group. Post hoc analysis showed that HD patients in the second tertile of bilirubin, as compared with those in the first tertile, presented a significant increase in hemoglobin concentration, hematocrit, and erythrocyte count; a signifi-cant decrease was also observed for ox-LDL/LDLc ratio, Apo B, and IL-6. Comparing HD patients in the third tertile of bilirubin with those in the first tertile, we found a significant reduction in platelet, leukocyte, and lymphocyte counts; iron metabolism presented significant changes, namely, an increase in serum iron and in transferrin saturation, and a decrease in transferrin; several significant changes were also observed in the lipid profile, namely, a significant decrease in ox-LDL, ox-LDL/LDLc ratio, Apo A, and Apo B and a signif-icant increase in Apo A/Apo B ratio; for the inflammatory markers, we found a significant rise in adiponectin and PON1 and a significant reduction in IL-6 serum levels. After adjusting for age, the results remained significant (Table 1). No statistical significant differences were found in UGT1A1 genotype between the three tertiles of TB, although HD patients homozygous for the (TA)7 allele showed an increase in bilirubin levels when compared to those with genotypes 6/7 and 6/6. Additionally, applying Pearson’s rank correlation, we also found statistically significant correlations between TB and adiponectin (𝑟 = 0.238; 𝑃 = 0.001), transferrin (𝑟 = −0.213; 𝑃 = 0.003), iron (𝑟 = 0.201; 𝑃 = 0.005), transferrin saturation (𝑟 = 0.307; 𝑃 < 0.001), ferritin (𝑟 = 0.173; 𝑃 = 0.017), Apo A (𝑟 = −0.249; 𝑃 < 0.001), lymphocytes (𝑟 = −0.223; 𝑃 = 0.002), and IL-6 (𝑟 = −0.193; 𝑃 = 0.008).
4. Discussion
Bilirubin is a key metabolic product of hemoglobin catabolism and seems to have a protective effect in oxidative stress conditions, such as atherosclerosis, coronary heart
disease, inflammatory diseases, cancer, and renal disease
[8,21,23,24]. Plasma bilirubin concentrations higher than
20 mg/mL are associated with deleterious effects in fetus and newborns, by increasing the risk of neurological dysfunction
[25, 26], as a result of its toxic effect on neuronal tissue.
Under physiological conditions, most of the bilirubin is bound to albumin. Homozygosis for the TA duplication in the promoter region of UGT1A1 gene, associated with higher levels of unconjugated bilirubin, is considered as the main cause of Gilbert syndrome in Caucasian population
[2, 17] and justifies some of the interindividual variations
in bilirubin levels, even in the normal population [27]. The estimated frequency of this allele is 0.35 in Caucasians, leading to a homozygous genotype in about 10% of the population, but the frequency is highly variable in different
ethnicities [28,29].
By studying a group of ESRD patients under HD and by using a very broad analytical panel, we were able to demonstrate that higher bilirubin levels, within the normal range (<1 mg/mL), are associated with higher hemoglobin concentration, lower platelet and lymphocyte counts, an increased iron availability, an improvement in the lipid profile, and a decrease in the inflammatory status.
This transversal study showed a prevalence of 8.8% for homozygosity of the TA duplication in the UGT1A1 promoter region, which is in accordance with the prevalence reported
for a healthy Portuguese population [30, 31]. Moreover, we
found a relationship between bilirubin levels and the presence of the TA duplication in the promoter region of UGT1A1; actually, HD patients homozygous for the (TA)7 allele showed an increase in bilirubin levels, when compared with those heterozygous, or with normal number of TA repeats. It is known that bilirubin is removed during the dialysis process [32], but the UGT1A1 genotype may modify serum bilirubin levels, even before the next dialysis session, as suggested by the increase in bilirubin levels observed in HD patients homozygous for the (TA)7 allele. When we stratified the results by UGT1A1 genotype, we only found a significant increase in HDL-c in the group of HD patients homozygous for the (TA)7 allele. Nevertheless, we did not find significant
differences in HDL-c when the results were stratified by tertiles of bilirubin, suggesting that this increase in HDL-c in HD patients homozygous for the (TA)7 allele is linked to a decrease in glucuronidation, related to the presence of this polymorphism, more than with the bilirubin serum levels. This association between higher bilirubin concentrations and higher HDL-c was previously described in a large number of studies [23]. Only one study reported decreasing HDL-c concentrations with increasing bilirubin [33].
Stratifying results by tertiles of bilirubin, no significant differences were found in UGT1A1 genotype distribution between groups, reflecting the low penetrance of the TA duplication polymorphism. Actually, ESRD patients present-ing higher bilirubin levels showed also high hemoglobin concentration and hematocrit and erythrocyte counts, sug-gesting that the red cell mass and hemoglobin concentration are associated with interindividual variations of bilirubin, as
previously reported in a healthy population [30,34] and in
individuals with Gilbert’s syndrome [35]. High bilirubin lev-els may be associated also with a decrease in the inflammatory status [36]. Actually, moderate and elevated unconjugated bilirubin concentrations have been associated with a reduced inflammatory status, namely, with lower levels of IL-6 [34, 35]. We also detected an inverse association between bilirubin levels with platelets and lymphocyte counts, suggesting that bilirubin levels may influence hematopoiesis. Recently, it was described that mild elevated serum unconjugated bilirubin levels could delay atherosclerotic plaque progress by prevent-ing thrombus formation through the prevention of collagen induced platelet aggregation [37]. The immunomodulatory effects of unconjugated bilirubin may explain its ability to restrain inflammation [24].
As previously described, high bilirubin levels are asso-ciated with low inflammatory grade in nonrenal patients
[38, 39] and in ESRD patients [21]. Indeed, a significant
decrease in IL-6 levels can be observed in the last tertile of bilirubin. Although we have not found significant differences in CRP between tertiles of bilirubin, a trend towards lower values with increasing bilirubin was found. As previously reported, unconjugated bilirubin is negatively associated with
CRP levels [37, 38], which is a widely used biomarker for
inflammation status and CVD risk. As IL-6 is a known inducer of hepatic CRP production, the reduction of IL-6 with bilirubin levels could explain, at least in part, the trend towards lower values of CRP concentration in our ESRD patients. It has been suggested that bilirubin is associated with lower CRP levels via reduction of blood lipid concentrations and not by direct inhibition of inflammation [40].
The rise in adiponectin found in HD patients presenting higher bilirubin levels and the significant positive correlation between bilirubin and adiponectin, described here by the first time in HD patients, could justify also the decreased inflammatory markers in HD patients presenting lower bilirubin levels. In fact, several reports demonstrated the anti-inflammatory effects for adiponectin [41–43]. In addition, the predictive value of adiponectin in all-cause mortality in ESRD patients appears to be critically dependent on serum magnesium (s-Mg) and calcium levels (sCa) since strong positive and negative associations of adiponectin with s-Mg
and s-Ca were found, respectively, in ESRD patients, and these associations were independent of each other and inde-pendent of body composition, nutritional, and inflammatory status [44]. These data are consistent with other studies, which showed a 3% to 10.3% increased risk for all-cause mortality for each 1 mg/mL increment of adiponectin in chronic kidney disease and ESRD patients [45]. Moreover, plasma adiponectin is an independent (inverse) predictor of cardiovascular events and mortality among HD patients. Analysis of adiponectin and several metabolic risk factors have shown that adiponectin has a protective function in prevention of CVD [46]. More recently, it was reported that an increase in obesity-related markers of the metabolic syndrome might be associated with lower adiponectin [47].
The inflammatory stimulus has an important impact in iron metabolism, by mobilizing iron from erythropoiesis traffic to storage sites within the reticuloendothelial system, inhibiting erythroid progenitor proliferation and differen-tiation [48]. These modifications in iron mobilization lead to an iron depleted erythropoiesis. In this work, the lower grade of inflammation found in the third tertile of bilirubin was associated with an increase in serum iron levels and transferrin saturation and with a decrease in transferrin levels. Additionally, a significant positive correlation between bilirubin and serum iron and transferrin saturation and a significant negative correlation between bilirubin and trans-ferrin were found. We also observed a trend (𝑃 = 0.108) towards a decrease in hepcidin serum levels that follows the increase in bilirubin levels and the decrease in IL-6 serum levels. The increased iron serum levels were previously reported in Gilbert’s syndrome patients [40] similar to our ESRD patients that present higher bilirubin levels. This improvement in iron metabolism seems to be due to the decrease in the inflammatory status that favors iron mobiliza-tion from macrophages and increases intestinal iron absorp-tion. Moreover, it has also been hypothesized that bilirubin could induce a mild hemolytic effect, liberating haem, which is subsequently degraded to iron, carbon monoxide and, ultimately, to bilirubin. Carbon monoxide further stimulates haem oxygenase-1 and production/accumulation of bilirubin, inducing further red blood cell lyses, completing the loop of anti-inflammatory compound production [40].
An association between TB and an improvement in the lipid profile has been already described in several studies in nonrenal patients [49–51]. There are evidences that support a role for bilirubin in protecting lipids from various oxygen radical species [52], particularly from lipid peroxidation induced by copper [8]. Indeed, as bilirubin and copper accu-mulate in atherosclerotic lesions, bilirubin could delay copper induced oxidation of lipids; therefore, the susceptibility to lipid oxidation might be reduced by elevated concentrations of the endogenous antioxidant bilirubin. This could explain the negative relationship between circulating bilirubin and CVD. Moreover, our HD patients presented an association between high bilirubin levels (third tertile) and a decrease in ox-LDL, Apo A, and Apo B and an increase in Apo A/Apo B ratio, in accordance with a previous report [53]. Lipoproteins, particularly LDL-c, are highly susceptible to oxidation, and it is known that the atherogenic process
involves an uptake of oxidized LDL by intimal macrophages leading to accumulation of lipid-rich foam cells [54]. Given the antioxidant capacity of bilirubin, it is plausible that bilirubin protects lipids and lipoproteins against oxidation, protecting, therefore, against atherogenesis [15]. Indeed, we found in our HD patients a decrease in ox-LDL/LDL ratio, showing a reduction in LDL oxidation associated with higher bilirubin levels. Considering the known involvement of oxidized LDL in the development of atherosclerosis and the ability of bilirubin to act as a potent lipid chain-breaking antioxidant under physiological conditions, the rise of plasma bilirubin concentrations may reduce the atherogenic risk in HD patients.
We also found an association between higher bilirubin levels and higher PON1 activity. PON1 presents antioxidant properties and contributes to control of the development of
oxidative stress at blood level [55, 56]. As referred to, the
oxidation of LDL is a crucial starting step for the athero-genic process [57]. By preventing oxidative stress, PON1 contributes to protecting LDL from oxidative modifications, reducing foam cell formation, and inhibiting atherosclerosis [58]. In line, serum antioxidant activity of PON1 is an impor-tant factor in cardiovascular diseases, providing protection from oxidative stress and lipid peroxidation [59]. PON1 concentration has been proposed as a predictive marker of cardiovascular mortality and all-cause mortality [60]. Reduced serum PON1 activity has been clearly established in HD patients and could contribute to accelerating the development of atherosclerosis in these patients [61], as they are, probably, more susceptible to the harmful effects of lipid peroxidation than healthy subjects with a normal PON1 activity. An association between PON1 activity after dialysis with creatinine changes, advanced glycation end products, and acrolein has been found, suggesting that uremic toxins could play a mechanistic role in PON1 inactivation [61]. A reduced PON1 activity in HD patients who are not under statin therapy is strongly associated with inflammation, longer time on dialysis, and high recombinant human ery-thropoietin (rhEPO) doses, suggesting that the reduction in PON1 activity may worsen the prognosis of these patients [62]. Treatment with rhEPO seems to reduce the oxidative stress and to improve PON1 activity in HD patients [63]; patients who are resistant to this therapy present higher levels of inflammatory and oxidative stress markers that could contribute to the lower PON1 activity [64].
In conclusion, this work shows that higher bilirubin levels present potential beneficial effects in ESRD patients under HD, namely, in the prevention and/or development of CVD, by improving lipid profile and reducing the inflamma-tory grade, which may increase iron availability. Moreover, we described for the first time an association between high bilirubin levels, within the normal range, with higher adiponectin and PON1 activities.
Conflict of Interests
The authors declare that there is no conflict of interests regarding the publication of this paper.
Acknowledgments
This study was supported by “Fundac¸˜ao para a Ciˆencia e Tecnologia” (FCT: PIC/IC/83221/2007) and cofinanced by FEDER (FCOMP-01-0124-FEDER-008468).
References
[1] R. N. Foley, P. S. Parfrey, J. D. Harnett, G. M. Kent, D. C. Murray, and P. E. Barre, “The impact of anemia on cardiomyopathy, morbidity, and mortality in end- stage renal disease,” The
American Journal of Kidney Diseases, vol. 28, no. 1, pp. 53–61,
1996.
[2] R. N. Foley, P. S. Parfrey, and M. J. Sarnak, “Clinical epidemi-ology of cardiovascular disease in chronic renal disease,” The
American Journal of Kidney Diseases, vol. 32, no. 5, supplement
3, pp. S112–S119, 1998.
[3] F. Locatelli, F. Conte, and D. Marcelli, “The impact of haemat-ocrit levels and erythropoietin treatment on overall and cardio-vascular mortality and morbidity—the experience of the Lom-bardy Dialysis Registry,” Nephrology Dialysis Transplantation, vol. 13, no. 7, pp. 1642–1644, 1998.
[4] P. Gollapudi, J. W. Yoon, S. Gollapudi, M. V. Pahl, and N. D. Vaziri, “Leukocyte toll-like receptor expression in end-stage kidney disease,” The American Journal of Nephrology, vol. 31, no. 3, pp. 247–254, 2010.
[5] R. Stocker, Y. Yamamoto, A. F. McDonagh, A. N. Glazer, and B. N. Ames, “Bilirubin is an antioxidant of possible physiological importance,” Science, vol. 235, no. 4792, pp. 1043–1046, 1987. [6] T.-W. Wu, K. P. Fung, J. Wu, C.-C. Yang, and R. D. Weisel,
“Antioxidation of human low density lipoprotein by uncon-jugated and conuncon-jugated bilirubins,” Biochemical Pharmacology, vol. 51, no. 6, pp. 859–862, 1996.
[7] Z. Yesilova, M. Serdar, C. N. Ercin et al., “Decreased oxidation susceptibility of plasma low density lipoproteins in patients with Gilbert's syndrome,” Journal of Gastroenterology and
Hepatol-ogy, vol. 23, no. 10, pp. 1556–1560, 2008.
[8] A. C. Bulmer, J. T. Blanchfield, I. Toth, R. G. Fassett, and J. S. Coombes, “Improved resistance to serum oxidation in Gilbert’s syndrome: a mechanism for cardiovascular protec-tion,” Atherosclerosis, vol. 199, no. 2, pp. 390–396, 2008. [9] A.-C. Boon, C. L. Hawkins, K. Bisht et al., “Reduced
circulat-ing oxidized LDL is associated with hypocholesterolemia and enhanced thiol status in Gilbert syndrome,” Free Radical Biology
and Medicine, vol. 52, no. 10, pp. 2120–2127, 2012.
[10] J. Neuzil and R. Stocker, “Bilirubin attenuates radical-mediated damage to serum albumin,” FEBS Letters, vol. 331, no. 3, pp. 281– 284, 1993.
[11] L. V´ıtek, M. Jirsa Jr., M. Brodanov´a et al., “Gilbert syndrome and ischemic heart disease: a protective effect of elevated bilirubin levels,” Atherosclerosis, vol. 160, no. 2, pp. 449–456, 2002. [12] L. Novotn´y and L. V´ıtek, “Inverse relationship between serum
bilirubin and atherosclerosis in men: a meta-analysis of pub-lished studies,” Experimental Biology and Medicine, vol. 228, no. 5, pp. 568–571, 2003.
[13] C. Mancuso, A. Bonsignore, E. di Stasio, A. Mordente, and R. Motterlini, “Bilirubin and S-nitrosothiols interaction: evidence for a possible role of bilirubin as a scavenger of nitric oxide,”
Biochemical Pharmacology, vol. 66, no. 12, pp. 2355–2363, 2003.
[14] T. Nakagami, K. Toyomura, T. Kinoshita, and S. Morisawa, “A beneficial role of bile pigments as an endogenous tissue
protector: anti-complement effects of biliverdin and conjugated bilirubin,” Biochimica et Biophysica Acta, vol. 1158, no. 2, pp. 189– 193, 1993.
[15] M. Mayer, “Association of serum bilirubin concentration with risk of coronary artery disease,” Clinical Chemistry, vol. 46, no. 11, pp. 1723–1727, 2000.
[16] Q.-H. Gong, J. W. Cho, T. Huang et al., “Thirteen UDPglu-curonosyltransferase genes are encoded at the human UGT1 gene complex locus,” Pharmacogenetics, vol. 11, no. 4, pp. 357– 368, 2001.
[17] P. J. Bosma, J. R. Chowdhury, C. Barker et al., “The genetic basis of the reduced expression of bilirubin UDP-glucuronosyltransferase 1 in Gilbert's syndrome,” New England
Journal of Medicine, vol. 333, no. 18, pp. 1171–1175, 1995.
[18] L. J. Horsfall, G. Rait, K. Walters et al., “Serum bilirubin and risk of respiratory disease and death,” Journal of the American
Medical Association, vol. 305, no. 7, pp. 691–697, 2011.
[19] I. Curjuric, M. Imboden, M. Adam et al., “Serum bilirubin is associated with lung function in a Swiss general population sample,” European Respiratory Journal, vol. 43, no. 5, pp. 1278– 1288, 2014.
[20] Y. H. Chen, S. C. Hung, and D. C. Tarng, “Serum bilirubin links UGT1A1∗28 polymorphism and predicts long-term cardiovas-cular events and mortality in chronic hemodialysis patients,”
Clinical Journal of the American Society of Nephrology, vol. 6,
no. 3, pp. 567–574, 2011.
[21] A. C. Boon, A. C. Bulmer, J. S. Coombes, and R. G. Fassett, “Circulating bilirubin and defense against kidney disease and cardiovascular mortality: mechanisms contributing to protec-tion in clinical investigaprotec-tions,” American Journal of Physiology.
Renal Physiology, vol. 307, pp. F123–F136, 2014.
[22] R. S. Hillman and K. A. Ault, “Clinical approach to anemia,” in
Hematology in Clinical Practice, McGraw-Hill, New York, NY,
USA, 3rd edition, 2002.
[23] A. C. Bulmer, H. J. Verkade, and K.-H. Wagner, “Bilirubin and beyond: a review of lipid status in Gilbert’s syndrome and its relevance to cardiovascular disease protection,” Progress in Lipid
Research, vol. 52, no. 2, pp. 193–205, 2013.
[24] S. Jangi, L. Otterbein, and S. Robson, “The molecular basis for the immunomodulatory activities of unconjugated bilirubin,”
International Journal of Biochemistry and Cell Biology, vol. 45,
no. 12, pp. 2843–2851, 2013.
[25] J.-S. Hahm, J. D. Ostrow, P. Mukerjee, and L. Celic, “Ionization and self-association of unconjugated bilirubin, determined by rapid solvent partition from chloroform, with further studies of bilirubin solubility,” Journal of Lipid Research, vol. 33, no. 8, pp. 1123–1137, 1992.
[26] G. R. Gourley, “Bilirubin metabolism and kernicterus,”
Advan-ces in Pediatrics, vol. 44, pp. 173–229, 1997.
[27] N. Kaniwa, K. Kurose, H. Jinno et al., “Racial variability in hap-lotype frequencies of UGT1A1 and glucuronidation activity of a novel single nucleotide polymorphism 686C>T (P229L) found in an African-American,” Drug Metabolism and Disposition, vol. 33, no. 3, pp. 458–465, 2005.
[28] E. Beutler, T. Gelbart, and A. Demina, “Racial variability in the UDP-glucuronosyltransferase 1 (UGT1A1) promoter: a bal-anced polymorphism for regulation of bilirubin metabolism?”
Proceedings of the National Academy of Sciences of the United States of America, vol. 95, no. 14, pp. 8170–8174, 1998.
[29] M. Clementi, E. Di Gianantonio, L. Fabris et al., “Inheritance of hyperbilirubinemia: evidence for a major autosomal recessive
gene,” Digestive and Liver Disease, vol. 39, no. 4, pp. 351–355, 2007.
[30] C. Rodrigues, E. Costa, E. Vieira et al., “Bilirubin dependence on UGT1A1 polymorphisms, hemoglobin, fasting time and body mass index,” The American Journal of the Medical Sciences, vol. 343, no. 2, pp. 114–118, 2012.
[31] C. Rodrigues, E. Vieira, R. Santos et al., “Impact of UGT1A1 gene variants on total bilirubin levels in Gilbert syndrome patients and in healthy subjects,” Blood Cells, Molecules, and Diseases, vol. 48, no. 3, pp. 166–172, 2012.
[32] A. Jung, P. Korohoda, P. Krisper, and D. Schneditz, “Relation-ship between kinetics of albumin-bound bilirubin and water-soluble urea in extracorporeal blood purification,” Nephrology
Dialysis Transplantation, vol. 27, no. 3, pp. 1200–1206, 2012.
[33] H. J. Hwang and S. H. Kim, “Inverse relationship between fasting direct bilirubin and metabolic syndrome in Korean adults,” Clinica Chimica Acta, vol. 411, no. 19-20, pp. 1496–1501, 2010.
[34] Y. Buyukasik, U. Akman, N. S. Buyukasik et al., “Evidence for higher red blood cell mass in persons with unconjugated hyperbilirubinemia and Gilbert’s syndrome,” The American
Journal of the Medical Sciences, vol. 335, no. 2, pp. 115–119, 2008.
[35] M. Wallner, A. C. Bulmer, C. M¨olzer et al., “Haem catabolism: a novel modulator of inflammation in Gilbert's syndrome,”
European Journal of Clinical Investigation, vol. 43, no. 9, pp. 912–
919, 2013.
[36] K. H. Chan, R. L. O’Connell, D. R. Sullivan et al., “Plasma total bilirubin levels predict amputation events in type 2 diabetes mellitus: the Fenofibrate Intervention and Event Lowering in Diabetes (FIELD) study,” Diabetologia, vol. 56, no. 4, pp. 724– 736, 2013.
[37] A. R. Kundur, A. C. Bulmer, and I. Singh, “Unconjugated bilirubin inhibits collagen induced platelet activation,” Platelets, vol. 25, no. 1, pp. 45–50, 2014.
[38] K. Ohnaka, S. Kono, T. Inoguchi et al., “Inverse associations of serum bilirubin with high sensitivity C-reactive protein, glycated hemoglobin, and prevalence of type 2 diabetes in middle-aged and elderly Japanese men and women,” Diabetes
Research and Clinical Practice, vol. 88, no. 1, pp. 103–110, 2010.
[39] H.-J. Hwang, S.-W. Lee, and S.-H. Kim, “Relationship between bilirubin and C-reactive protein,” Clinical Chemistry and
Labo-ratory Medicine, vol. 49, no. 11, pp. 1823–1828, 2011.
[40] H. J. Hwang, S. W. Lee, and S. H. Kim, “Relationship between bilirubin and C-reactive protein,” Clinical Chemistry and
Labo-ratory Medicine, vol. 49, no. 11, pp. 1823–1828, 2011.
[41] G. Nanayakkara, T. Kariharan, L. Wang, J. Zhong, and R. Amin, “The cardio-protective signaling and mechanisms of adiponectin,” American Journal of Cardiovascular Disease, vol. 2, pp. 253–266, 2012.
[42] M. T. Villarreal-Molina and B. Antuna-Puente, “Adiponectin: anti-inflammatory and cardioprotective effects,” Biochimie, vol. 94, no. 10, pp. 2143–2149, 2012.
[43] G. Fantuzzi, “Adiponectin in inflammatory and immune-mediated diseases,” Cytokine, vol. 64, no. 1, pp. 1–10, 2013. [44] A. Markaki, J. Kyriazis, K. Stylianou et al., “The role of
serum magnesium and calcium on the association between adiponectin levels and all-cause mortality in end-stage renal disease patients,” PLoS ONE, vol. 7, no. 12, Article ID e52350, 2012.
[45] N. Ohashi, A. Kato, T. Misaki et al., “Association of serum adiponectin levels with all-cause mortality in hemodialysis patients,” Internal Medicine, vol. 47, no. 6, pp. 485–491, 2008.
[46] E. Abdallah, E. Waked, M. Nabil, and O. El-Bendary, “Ad-iponectin and cardiovascular outcomes among hemodialysis patients,” Kidney and Blood Pressure Research, vol. 35, no. 4, pp. 247–253, 2012.
[47] H. Nascimento, E. Costa, S. Rocha et al., “Adiponectin and markers of metabolic syndrome in obese children and adoles-cents: impact of 8-month regular physical exercise program,”
Pediatric Research, vol. 76, pp. 159–165, 2014.
[48] M. L. V. Jacober, R. L. Mamoni, C. S. P. Lima, B. L. Dos Anjos, and H. Z. W. Grotto, “Anaemia in patients with cancer: role of inflammatory activity on iron metabolism and severity of anaemia,” Medical Oncology, vol. 24, no. 3, pp. 323–329, 2007. [49] H. A. Schwertner and J. R. Fischer Jr., “Comparison of various
lipid, lipoprotein, and bilirubin combinations as risk factors for predicting coronary artery disease,” Atherosclerosis, vol. 150, no. 2, pp. 381–387, 2000.
[50] H.-J. Hwang and S.-H. Kim, “Inverse relationship between fasting direct bilirubin and metabolic syndrome in Korean adults,” Clinica Chimica Acta, vol. 411, no. 19-20, pp. 1496–1501, 2010.
[51] J. Jo, J. E. Yun, H. Lee, H. Kimm, and S. H. Jee, “Total, direct, and indirect serum bilirubin concentrations and metabolic syndrome among the Korean population,” Endocrine, vol. 39, no. 2, pp. 182–189, 2011.
[52] R. Stocker, “Antioxidant activities of bile pigments,”
Antioxi-dants and Redox Signaling, vol. 6, no. 5, pp. 841–849, 2004.
[53] M. Wallner, R. Marculescu, D. Doberer et al., “Protection from age-related increase in lipid biomarkers and inflammation contributes to cardiovascular protection in gilbert’s syndrome,”
Clinical Science, vol. 125, no. 5, pp. 257–264, 2013.
[54] Y. I. Miller, S.-H. Choi, L. Fang, and R. Harkewicz, “Toll-like receptor-4 and lipoprotein accumulation in macrophages,”
Trends in Cardiovascular Medicine, vol. 19, no. 7, pp. 227–232,
2009.
[55] C. Zoccali, F. Mallamaci, G. Tripepi et al., “Adiponectin, met-abolic risk factors, and cardiovascular events among patients with end-stage renal disease,” Journal of the American Society
of Nephrology, vol. 13, no. 1, pp. 134–141, 2002.
[56] S. Colman, R. Bross, D. Benner et al., “The Nutritional and Inflammatory Evaluation in Dialysis patients (NIED) study: overview of the NIED study and the role of dietitians,” Journal
of Renal Nutrition, vol. 15, no. 2, pp. 231–243, 2005.
[57] C. Delporte, P. van Antwerpen, L. Vanhamme, T. Roumegu`ere, and K. Zouaoui Boudjeltia, “Low-density lipoprotein modified by myeloperoxidase in inflammatory pathways and clinical studies,” Mediators of Inflammation, vol. 2013, Article ID 971579, 18 pages, 2013.
[58] F. Sztanek, I. Seres, M. Harangi et al., “Decreased paraoxonase 1 (PON1) lactonase activity in hemodialyzed and renal trans-planted patients. A novel cardiovascular biomarker in end-stage renal disease,” Nephrology Dialysis Transplantation, vol. 27, no. 7, pp. 2866–2872, 2012.
[59] M. Shekhanawar, S. M. Shekhanawar, D. Krisnaswamy et al., “The role of “paraoxonase-1 activity” as an antioxidant in coronary artery diseases,” Journal of Clinical and Diagnostic
Research, vol. 7, no. 7, pp. 1284–1287, 2013.
[60] Y. Ikeda, T. Suehiro, T. Itahara et al., “Human serum par-aoxonase concentration predicts cardiovascular mortality in hemodialysis patients,” Clinical Nephrology, vol. 67, no. 6, pp. 358–365, 2007.
[61] A. Gugliucci, K. Kotani, and S. Kimura, “Paraoxonase 1 in chronic kidney failure,” Journal of Lipids, vol. 2012, Article ID 726048, 10 pages, 2012.
[62] S. Ribeiro, M. Do Sameiro Faria, F. Mascarenhas-Melo et al., “Main determinants of PON1 activity in hemodialysis patients,”
The American Journal of Nephrology, vol. 36, no. 4, pp. 317–323,
2012.
[63] J. Marsillach, A. Mart´ınez-Vea, L. Marcas et al., “Administration of exogenous erythropoietin𝛽 affects lipid peroxidation and serum paraoxonase-1 activity and concentration in predialysis patients with chronic renal disease and anaemia,” Clinical and
Experimental Pharmacology and Physiology, vol. 34, no. 4, pp.
347–349, 2007.
[64] E. Costa, M. Lima, J. M. Alves et al., “Inflammation, T-cell phe-notype, and inflammatory cytokines in chronic kidney disease patients under hemodialysis and its relationship to resistance to recombinant human erythropoietin therapy,” Journal of Clinical
Submit your manuscripts at
http://www.hindawi.com
Stem Cells
International
Hindawi Publishing Corporation
http://www.hindawi.com Volume 2014
Hindawi Publishing Corporation
http://www.hindawi.com Volume 2014
INFLAMMATION
Hindawi Publishing Corporation
http://www.hindawi.com Volume 2014
Behavioural
Neurology
Endocrinology
International Journal ofHindawi Publishing Corporation
http://www.hindawi.com Volume 2014
Hindawi Publishing Corporation
http://www.hindawi.com Volume 2014
Disease Markers
Hindawi Publishing Corporation
http://www.hindawi.com Volume 2014
BioMed
Research International
Oncology
Journal of Hindawi Publishing Corporationhttp://www.hindawi.com Volume 2014
Hindawi Publishing Corporation
http://www.hindawi.com Volume 2014
Oxidative Medicine and Cellular Longevity
Hindawi Publishing Corporation
http://www.hindawi.com Volume 2014
PPAR Research
The Scientific
World Journal
Hindawi Publishing Corporation
http://www.hindawi.com Volume 2014
Immunology Research
Hindawi Publishing Corporation
http://www.hindawi.com Volume 2014 Journal of
Obesity
Journal ofHindawi Publishing Corporation
http://www.hindawi.com Volume 2014
Hindawi Publishing Corporation
http://www.hindawi.com Volume 2014
Computational and Mathematical Methods in Medicine
Ophthalmology
Journal ofHindawi Publishing Corporation
http://www.hindawi.com Volume 2014
Diabetes Research
Journal ofHindawi Publishing Corporation
http://www.hindawi.com Volume 2014
Hindawi Publishing Corporation
http://www.hindawi.com Volume 2014 Research and Treatment
AIDS
Hindawi Publishing Corporation
http://www.hindawi.com Volume 2014
Gastroenterology Research and Practice
Hindawi Publishing Corporation
http://www.hindawi.com Volume 2014