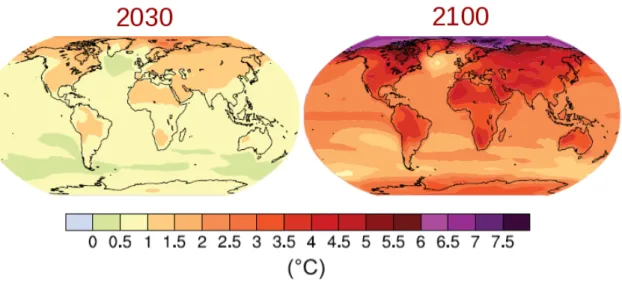
The results showed that temperatures would rise most in the northern areas of Sweden and Finland. The highly discontinuous wind data is caused by residual discontinuities in the input data for this station – the observed wind data is quite different from year to year, presumably a result of sensor changes.
Climate Models and scenarios
This method involves repeating each day in the GCM future scenario, and for each day finding the day in the historical record for which the large-scale atmospheric patterns are most similar. The impact of climate change on the road network is a major concern for road owners, as many decisions, especially in infrastructure investments, can have consequences for decades.
Winter indexes
Although the amount of snowfall will decrease in the southern parts of the country, the number of traffic disturbances due to heavy snowfall will increase. The total amount of freeze and thaw cycles will decrease in the southern parts of the country, but will increase further in the north.
RWIS data
With the Swedish data, observations that were further than 15 minutes away from the nominal time were replaced as missing. To further validate the Swedish RWIS data, precipitation data from SMHI were downloaded and checked with the RWIS.
Maintenance data
To make homogeneous time series for all stations for the selected periods, the data has been adjusted to the nearest half hour. In the Swedish data, the rain sensor often recorded rain values a factor 10 too high during transition from rain to snow or vice versa. For the Swedish and Finnish data, snow and ice depths were converted to mm water equivalent by dividing by 10.
Temperature, dew point and precipitation values that differed significantly from the values measured in the previous and next half hour were marked as missing. Where air and surface temperature records for the same station and half-hour were inconsistent, they were both marked as missing. Where average wind speed and maximum gust records for the same station and half hour were inconsistent, they were both marked as missing.
A general conclusion from this comparison was that SMHI stations measure somewhat more precipitation than RWIS stations.
The IRWIN database
Climate of the studied areas
Past climate
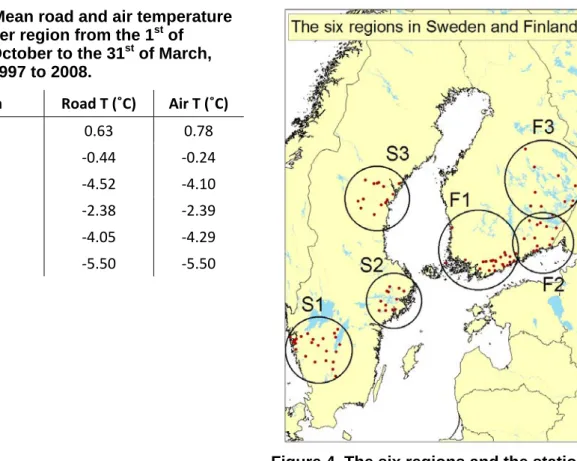
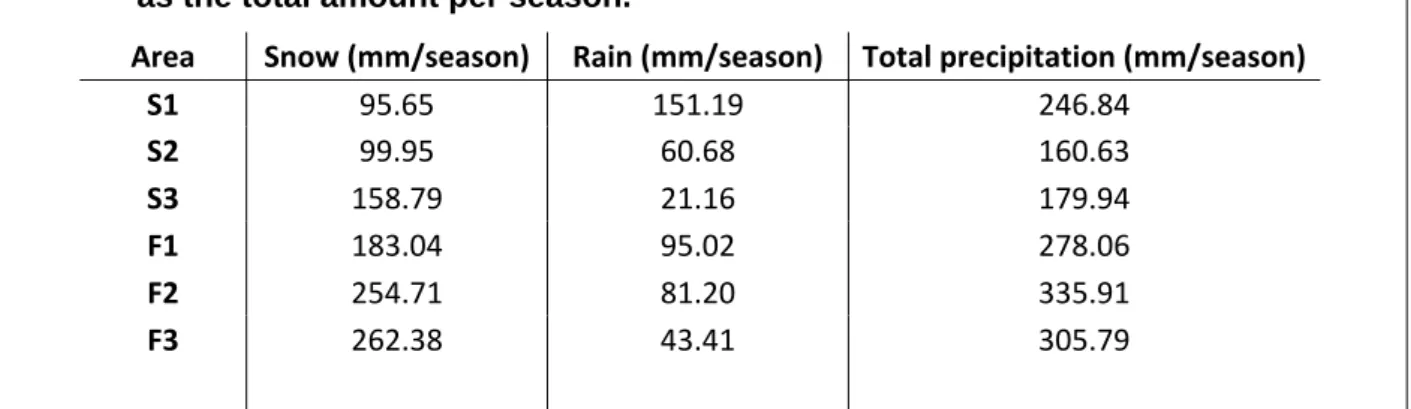
The natural climate variations in the two countries are therefore covered by these six defined regions, and they can provide valuable information about the climate changes that occur both locally and regionally. The precipitation pattern, in the winter season from 1997 to 2008, shows that the regions of Finland generally have higher precipitation than the regions of Sweden. The area with the highest total precipitation in the winter season from 1997 to 2008 was F2 (Table 2).
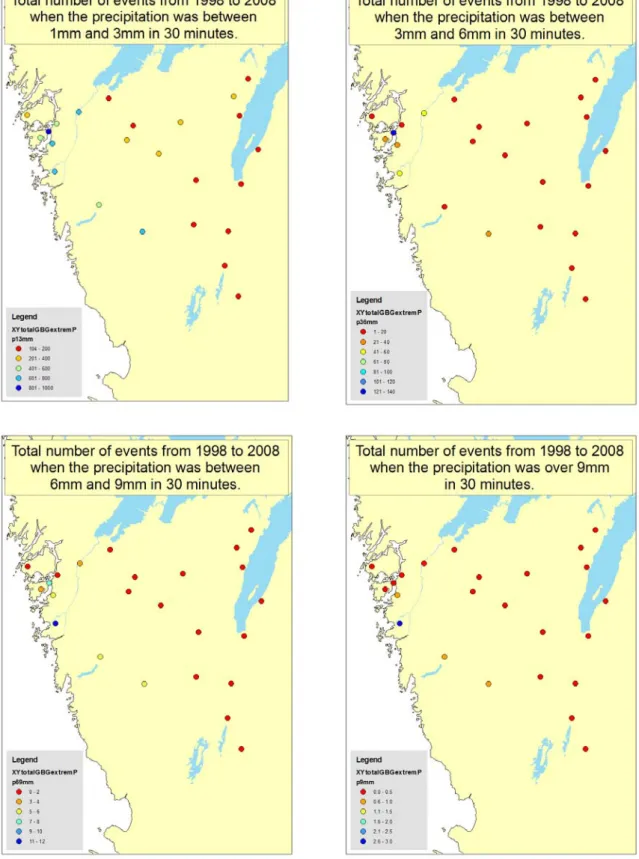
However, this large difference in precipitation between the two countries may be due to the different precipitation measurement techniques used in the two countries. The bright blue station on the top two maps is located on “Tjörnbron”, a bridge in the archipelago, which has previously shown very high precipitation values. The highest wind speed was found in southwestern Sweden, the S1 region, both for the mean maximum wind speeds and for the mean wind speeds (Table 4).
Furthermore, the distribution is quite well spread, due to the different positioning of the stations in the landscape. The maps illustrate the total number of events where a given wind speed was reached in a 30-minute interval. Station 1407 on the bridge “Tjörnbron” in the archipelago was removed due to extremely high wind values.
Climate scenarios
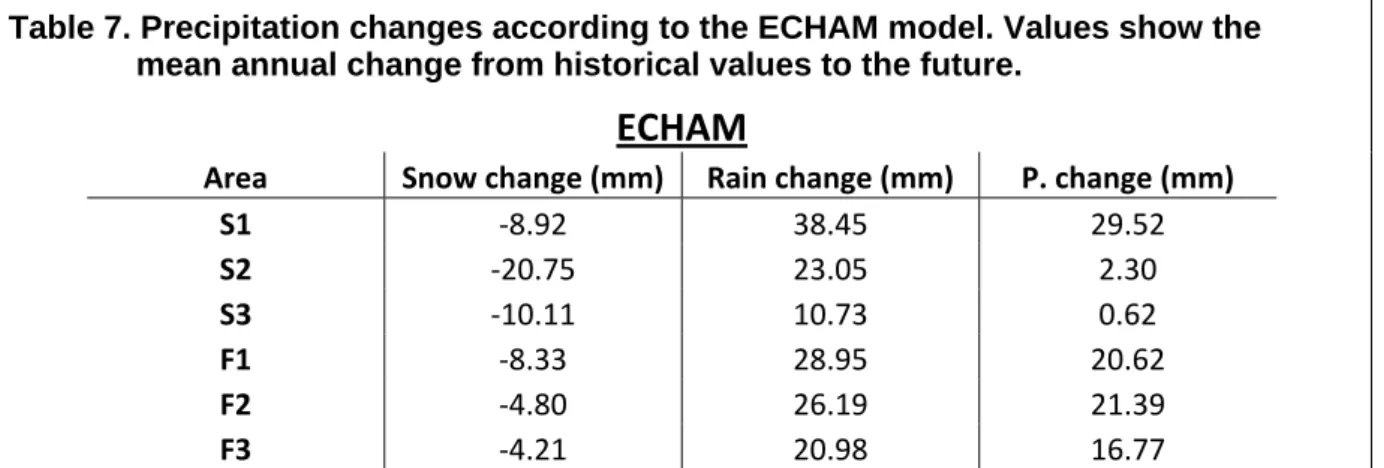
The NCAR model shows in agreement with the Echam model that snowfall will decrease in all areas in the future, most in southern Sweden in the S1 region, in northern Sweden in the S3 region and in F1 (southwest Finland), although the decrease is more great. than for the Eçam model. However, in S2 and S3, the mean total seasonal precipitation will decrease compared to the current climate. Källström (2009) showed that there will be more precipitation extremes in the future, and that precipitation during the winter months will increase more than during the summer.
Extreme precipitation changes in the mean number of events (30 min period) from the historical period to the future in the S1 region. According to the Echam model, the maximum wind speed will increase the most in the north in S3 and F3. The S3 region which in the Echam model shows fairly high wind speed changes for the future shows opposite results in the NCAR model.
The variability exceeds the change, but a small decrease in wind potential was recorded especially in the northern parts of the country. The local variability distributed today due to the different positioning of the stations is likely to be maintained in the future, but certain areas may experience a greater increase in extremes than others. This is evident from comparing the future changes (Figure 8) with the historical observations (Figure 6).
Downscaling with RWIS data
NCEP/NCAR reanalysis data were used for the historical days and the normalized GCM temperature for the GCM scenarios. Normalization of the GCM temperature time series was required to remove the bias between the GCM and NCEP/NCAR reanalysis temperatures. Thus, the GCM temperatures were normalized to the NCEP/NCAR reanalysis temperatures, independently for each season and circulation class, using data from the period in which the overlap between the observations and the GCM Climate of the 20th Century simulations was used).
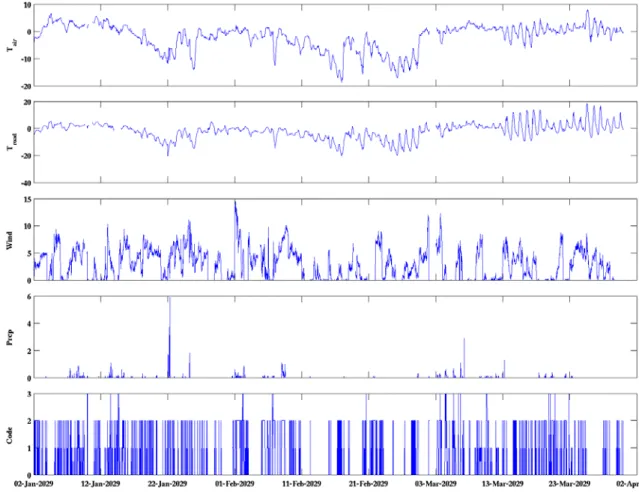
This is because solar heating of the road surface is insignificant in the middle of winter, but becomes important in late winter. These criteria ensured that the reduced temperature and dew point time series were truly continuous. A short section of the downscaled time series for a SW Finland station is shown in Figure 10.
The temperature profile shows the same basic pattern as the GCM time series from Figure 9, with cold spells around January 21, February 14 and February 23, but there are much more realistic details. A short section of the downscaled data for Helsinki station (1002) for the year 2029, based on the CCSM3 model. We calculated the bias in the average regional temperatures for the selected days. If the temperatures of the analogs were consistently much lower than the GCM days, this indicates that the method has failed.
IRWIN index
Average annual occurrence of events as defined by indices 1 and 4 under the current climate conditions. As for indices 2 and 3, these events will not be as frequent in the future as they were historically (Table 10). Indexes 4, 5 and 6 show the number of cases where snow has accumulated for 4 hours, the temperature is less than -3˚C and the wind varies as in the first three indices.
A high negative change (-50%) from historical to future values is due to one event in the past and then no event in the future. The results show that this happens most often in the F2, F3 and S3 regions (in the northern parts of Finland and Sweden), while the more southern parts show a decrease in the number of such events. Only the region in southern Sweden shows a decrease in future frosts caused by this temperature shift, while other areas show an increase.
The number of events increased in the north and decreased further in the south in response to future warming (Table 11). This division is done to show how the need for plowing will change in the future compared to the current situation. Almost all areas will experience a decrease in snow events in the future, and the S2 region will experience a large decrease.

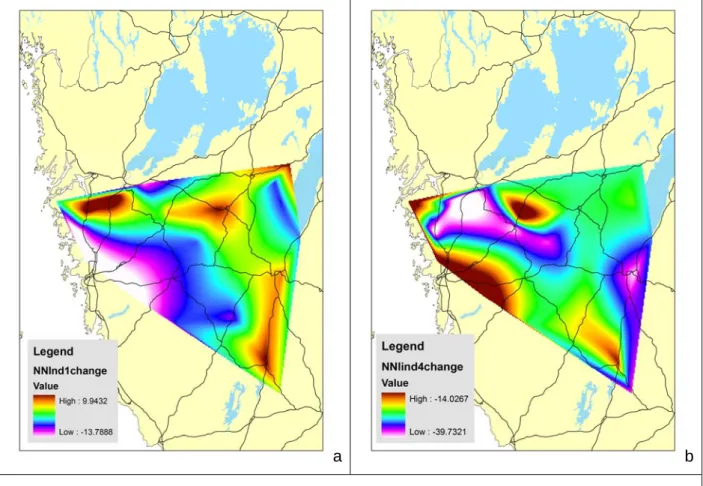
Maintenance needs
Figures 12 a-b present examples of indices 1 and 4 and show the change in how often plowing will be required for these two indices in the future. The maps show the percentage change in how often plowing will be required in the future compared to the past in the S1 region.
Quality of data
User benefits
Evaserve is a meta-tool for the evaluation and development of information services that can be used by service developers and evaluation experts. Evaserve is designed for evaluation of information services in the field of transportation and logistics, but is also suitable for other information services. The tool has been used in the R&D projects focused on meteorological information services in Finland and other countries.
ITS service assessment sheet for IRWIN can be found as an attachment at the end of this report.
Extending IRWIN in other areas and countries
The results showed that, according to well-established climate models, the temperature increase in the coming decades would be greatest in northern areas in Sweden and Finland. The same areas will have a higher number of events when there is a shift from plus to minus degrees (index 9), so these areas need more maintenance due to the slippage caused by this shift. Only the region in the south-west of Sweden will have fewer days when the temperature moves from plus to minus degrees in the future due to a warmer climate.
The future will bring more rainy days on a cold surface in the north due to milder climate and more rainy days in the north instead of precipitation in the form of snow. In northern areas, there will also be more slippage due to icy days when the surface temperature is low and the dew point is higher than the surface temperature. In the future, these cold days will be less frequent in more southerly places due to fewer days with minus degrees.
Northern Sweden and southwestern Finland, which today have average winds, will in the future experience an increase of index 5. The need for maintenance operations will vary in different regions as the climate changes. A warmer climate can mean even more salt needs due to more slippery roads, but at the same time less plowing when precipitation falls as rain instead of snow.