Assessment of the impacts of velocity management measures should take into account the specific health and environmental effects of different types of pollutants. This document describes the effects of speed on noise and pollutant emissions from road traffic.
The cases to be considered
Effects are considered in relation to changes in the vehicle fleet as the percentage of vehicles equipped with catalytic converters changes. It also provides a reference resource for those using the MASTER framework to obtain the most appropriate models/components for evaluating the effects of speed management policies for specific cases/locations.
Overview
Trucks are limited to speeds of 85 km/h so this is the highest speed that can be selected for this vehicle class.
Vehicle emission production processes
- Overview of the production of exhaust gases
- Catalytic converters
- Other emissions
- Health impacts of emissions
A stoichiometric air-fuel ratio "supplies enough oxygen to convert all of the fuel into fully oxidized products" (Heywood, 1988). Enrichment occurs when additional fuel is injected, so the cylinder operates below the stoichiometric air-fuel ratio.

The effects of speed and driving mode on emissions
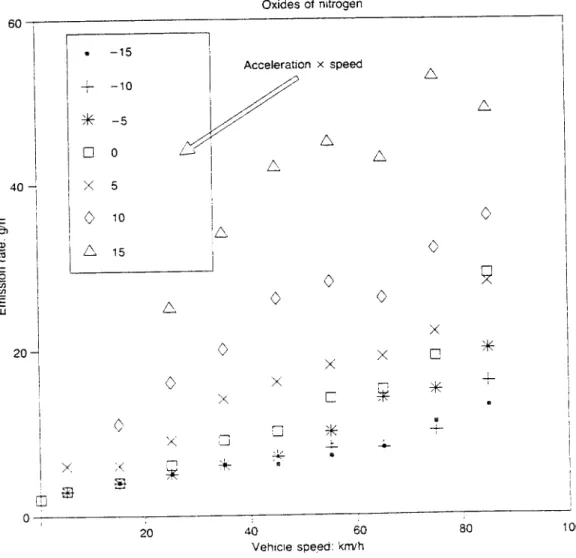
The level of NOx emission was related to a function of the product of acceleration and velocity. From all the above experiments it is clear that vehicle emissions are not just linked to speed.

Environmental effects of speed control strategies
Urban traffic calming
The results of the project showed an increase in CO, CO2 and HC emissions with a slight decrease in NOx, although absolute NOx levels were low. Research into the changes in driving behavior at each of the individual locations led the authors to conclude that lower speeds cause a reduction in NOx emissions.

Inter-urban traffic calming
However, it is not sufficient to simply consider the effects of a traffic restriction scheme in terms of what happens on the micro scale between the bumps in one street. If, unlike the Graz scheme where significant infrastructure change was avoided, the traffic calming scheme causes diversion of traffic to roads better suited to that traffic, the environmental effects of this shift must be considered.
Emission models
Emissions databases
Conclusions
The MODEM and HEB databases appear more suitable for the environmental assessment of schemes based on changes in the speed profiles of vehicles passing through the schemes.
Introduction
Noise perception and measurement
The context of the sound; In fact, the information content of the sound can influence the degree of annoyance or disruption. In the context of the road network, there may be a small safety benefit if vehicles make noise that alerts other road users to their presence.
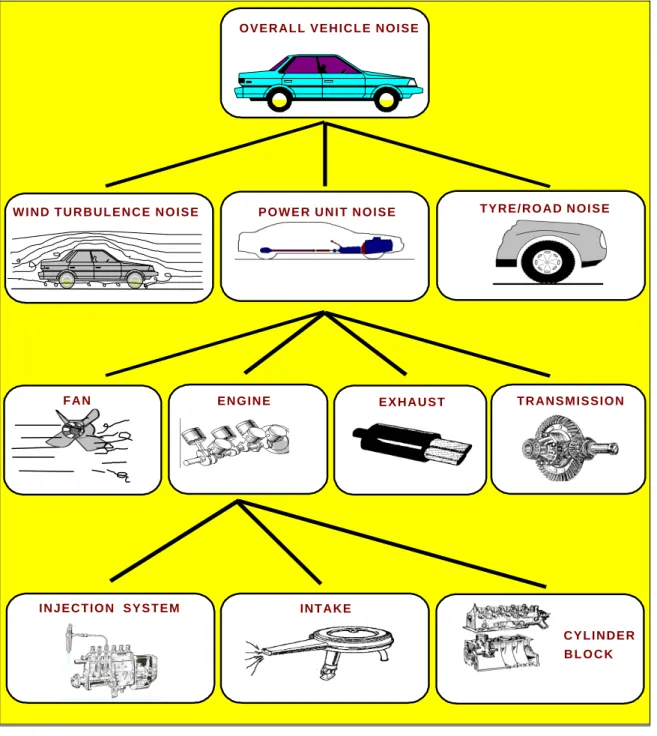
Sources of road traffic noise
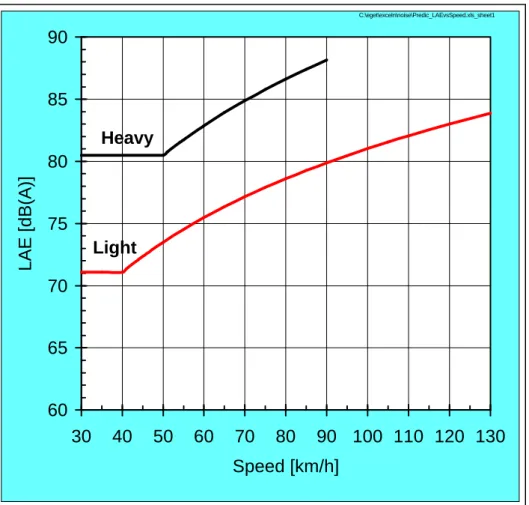
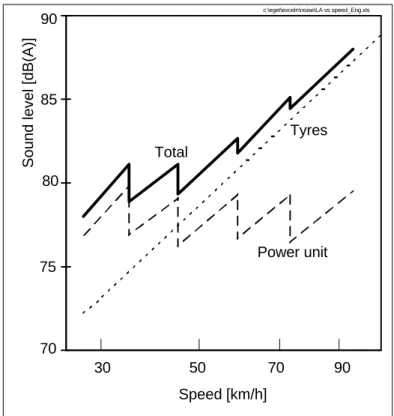
While the use of horns is thought to have decreased in recent decades, vehicle sound systems have been a growing problem in recent years in some areas, sometimes causing more noise emissions than the vehicle itself. The noise of the power unit which dominates at low speeds, on the other hand, is only slightly affected by speed if seen over the whole speed scale. Therefore, there is a "crossover speed" above which tire/road noise dominates the overall noise and below which it is negligible, see Fig.
Since urban traffic consists of traffic at speeds both above and below these "crossing speeds", it is clear that both power output and tire/road noise must be reduced in order to achieve a better environment. In freeway traffic (generally this has speeds greater than 50 km/h), almost no reduction in overall traffic noise is possible unless tire/road noise is reduced. Currently, and with new generation vehicles, it is being realized that tire/road noise plays a greater role in urban traffic noise than previously expected.
Measurements of full throttle acceleration noise for new vehicles, in accordance with current noise emission regulations, have shown that tire/road noise can account for a large part of the overall noise, even when accelerating at the medium gears of the vehicles.
The effect of speed on sources of vehicle noise
For traffic consisting of a large number of vehicles, the "roughness" of the curve becomes smoother because different drivers shift gears at different speeds. According to the experience of VTI (Swedish National Road and Transport Research Institute), the noise speed slope for tyre/road noise, the constant B, varies between 27 and 40 with an average of about 33 for a range of current tire types and road surfaces. It is the speed exponent that is most relevant to consider here, as virtually all traffic noise prediction models these days are designed to calculate the equivalent levels and maximum levels, if calculated at all, will only be supplementary.
Another complication is that when one switches from equivalents to maximum levels, it must also be taken into account that the statistical distribution of noise levels of the vehicles changes with speed and then the maximum levels will be affected by this. The range of noise variation is higher at the lower speeds than at the higher ones, i.e. it happens that the exposure time factor approximately balances the effect due to increased variation of noise levels at low speeds, so that the equivalent levels and maximum levels are relatively similar noise-speed relationships, see for example TemaNord, (1996).
Road traffic noise prediction models
In the range of 50-100 km/h, the maximum deviation between the models can be illustrated as follows. It is estimated here that in a hypothetical case of calculating the noise reduction for a speed reduction of 20 km/h, the choice of model can make a difference of about 1 dB in the results. However, in practice, none of the models would capture the true variation that probably exists between such cases, i.e.
As mentioned, the Nordic model "overestimates" the speed effect on noise relative to the average of the other models. The reason may be that the Nordic model is based on very recent data, and at least some of the other models may be based on rather old data, from a time when power unit noise dominated under more circumstances than now and the influence of speed on noise was lower than currently. The authors therefore believe that the Nordic model is the most relevant one for today and the future, but this is of course debatable.
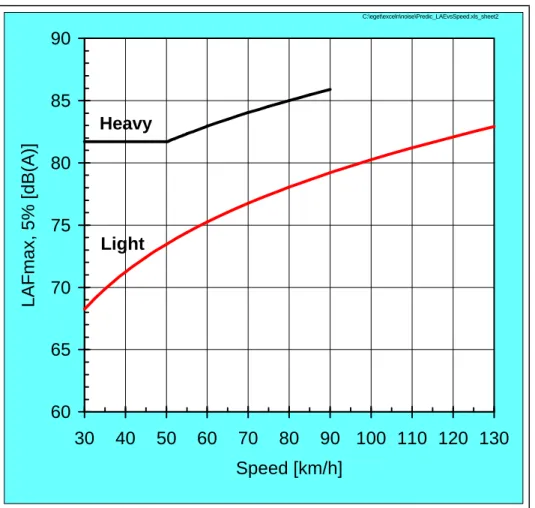
6 Noise-speed relationships for "equivalent levels" used in the Nordic Traffic Noise Prediction Model.
Choice of noise measure - equivalent or maximum noise levels?
7 The noise-speed ratios for "maximum noise levels" (those levels exceeded by 5 % of vehicles during their passage) used in the Nordic traffic noise prediction model. It is debatable whether one should consider these maximum levels or not, as it is only in the Nordic countries that this measure is used. This would also raise the question of which of the two groups of results one should consider (and which differ only slightly).
However, this measure will likely be abandoned in an upcoming review and the Leq will be adopted instead. Calculations based on L10 would yield similar (but not identical) sound speed relationships as those based on Leq.
Effects of acceleration and deceleration
Effects of speed management devices
Tempo 30
The effects of speeds in the range of around 30-50 km/h in the Nordic noise prediction model should account for such (moderate) effects, as it is based on measurements in actual cases where speeds have been reduced by various (enforced) means. Therefore, no special calculations or corrections for nonuniform velocity profiles were used in the predictions here. However, if the speed is reduced in one location and restored in another location, in a way that results in accelerations or decelerations of the same magnitude, such as near a street light or at a busy intersection, noise levels are likely to increase as predicted .
Effects of gradients on the noise-vs-speed relation
Road surface effects
However, it has been found that some cobblestone surfaces can increase noise levels by up to 10 dB(A), while some brick surfaces may not increase noise levels at all. The use of protrusions can locally increase noise at the location of these protrusions, for example due to the sound of loose parts on vehicles, which often causes reactions among residents in the neighborhood. It is impossible to quantify these effects in general, but those responsible for applying such measures must consider the potential for increased noise and the potential noise complaints that may result.
This report deals with dry surfaces only; however, it should be taken into account that a wet surface can cause a noise increase of 0-6 dB(A), depending on the type of road surface. This impact would be negligible in this project if the effect was speed neutral. Unfortunately, the effect of wetness is slightly greater at lower speeds than at higher speeds.
For speed changes in the range of 20 km/h, the error in the speed effects calculated in the Appendix, if the surface were wet, is estimated to be no more than 1 dB(A).
Distance effects
In many cases there will be resource constraints and limitations on the availability of the data itself. To obtain a more in-depth assessment of the impact of speed on these emissions, more detailed specifications of the model components and assumptions to reflect local conditions must be made. Estimation of the valuation of the effects of noise and emissions is dealt with in MASTER Working Paper R1.2.2.
Driver response to traffic calming: investigating the effects of road humps on driver acceleration and braking. 1988a) Case Studies of the Effects of Traffic Induced Vibration on Heritage Buildings, TRRL Research Report RR156 TRRL, Crowthorne. The fuel consumption module in AIMSUN2 was added as part of the EU SAVE project.
While calibration of the models has been performed, most calibrations are performed against detector data. The PREMIT model (Bostock, 1994) was developed as part of the QUARTET European Union DRIVE II initiative. To assess the more localized effects of speed control schemes, the speed-dependent curves developed within CORINAIR could be used.
The model may not be as compatible with the objectives of the MASTER project, but deserves further investigation. The model can then be used to estimate the emissions for specific types of speed management strategy, provided the speed profiles before and after implementation of the measure are known.