During my master's thesis, we published (Cottret et al. (2008)) our first version of the algorithm. Chapter 4 presents a collection of work on the enumeration of minimal sets of precursors, for which we have developed three different algorithms, which will be described in detail, as well as biological validation and analysis of the time complexity of the problem.
Metabolic network
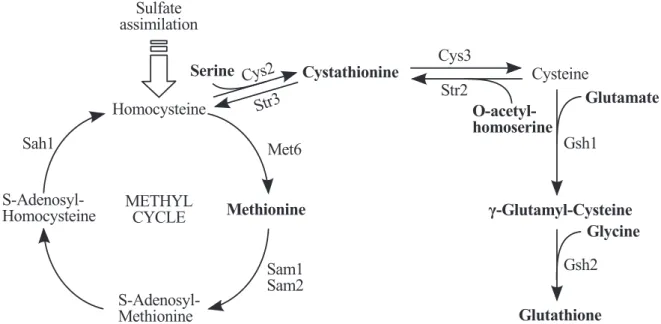
A metabolic pathway can still be seen as a transformation of a set of substrates into a set of products, but now the task is performed by several successive metabolic reactions. This does not mean that chemical processes inside the cell are irreversible, but that they are carried out through different metabolic pathways depending on their direction, which usually exchange only the extremes of the pathway and preserve the reversible intermediate reactions.
Metabolic network reconstructions
Once the function of the genes is known, it is a trivial task to select among them the catalytically related proteins, i.e. the enzymes. The quality of the first draft of a metabolic network reconstruction obtained automatically from one of these tools will basically depend on the taxonomy of the organism.

Modelling metabolic networks
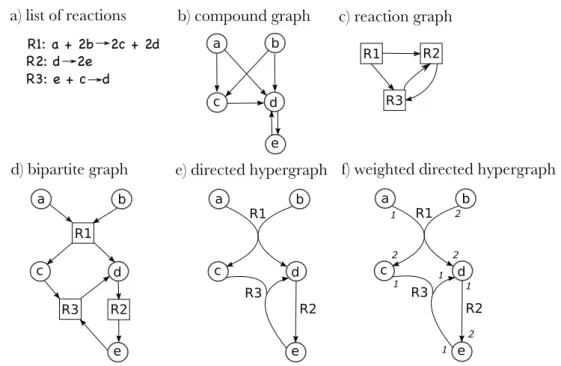
Figure 2.3(f) presents a weighted directed hypergraph with a weight assigned to each node in the hyperarc corresponding to the stoichiometric coefficients of the reaction modeled by the hyperarc. In such a case, the feasible flow space of a metabolic network can be described as a multidimensional cone, each axis corresponding to a set of flows through the reactions of the network.
Analysing structural properties of metabolic networks
Algorithm complexity analysis
Algorithms on graphs
By the end of the execution, all nodes reachable by shaving have been visited and a so-called BFS-tree is obtained, as shown in Figure 2.6, which explores the induced subgraph G[{a, b, d, e, g}] that corresponds to larger. The core of the algorithm is performed by the main loop that analyzes the vertices in the queue.
Complexity analysis of algorithms
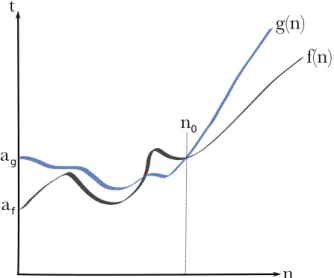
We then say that this problem is also O(n+m) since there is an algorithm of this complexity to solve it. Whenever the complexity of an algorithm is bounded by a polynomial of its input size, the problem is said to be polynomially solvable and belongs to a class of Pof problems.
Enumeration problems
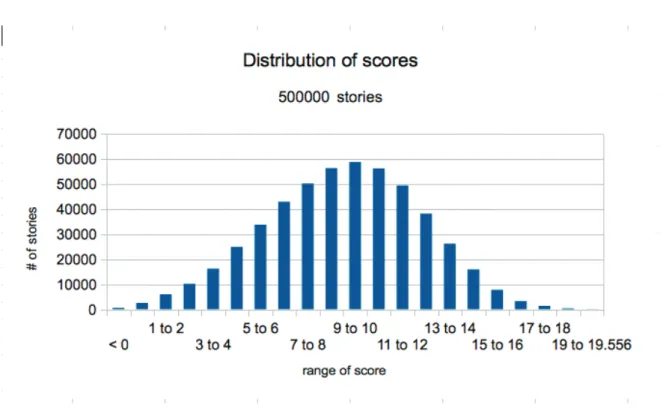
The inability and unwillingness to tell a priori the role of the compounds of interest in the metabolic stories to be found is a key factor of our approach. For the specific case of metabolomics data analysis, we propose a scoring function that assigns value to the stories based on how the concentration of the compounds of interest is observed to vary in the experiment.

Modelling metabolic stories
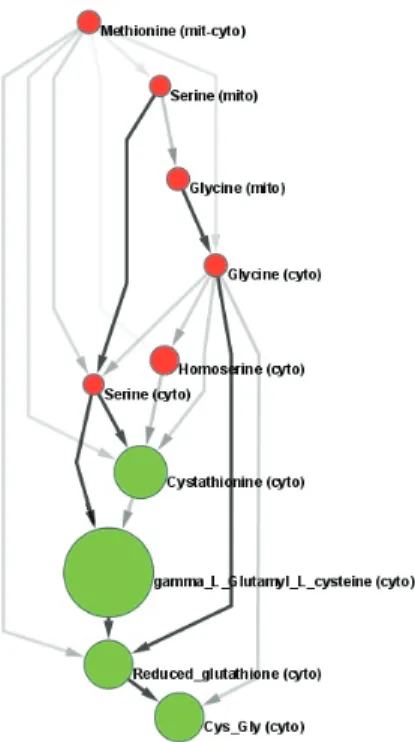
The color of the nodes corresponds to decreased (red) or increased (green) concentration, while their size corresponds to their concentration change in the metabolomic experiment. In our version, only a certain subset of the nodes may be sources or targets of the DAGs to be enumerated.
Definitions
Algorithms and complexity for finding and enumerating stories
- Preprocessing the graph
- Finding single stories
- Enumerating stories by enumerating FAS s
- Enumerating stories by enumerating permutations
In this way, the weight of a path is the sum of the weights of the arcs in the path. According to the results of the previous section, we can assume that a path pk, pk−1, exists.
Alternative definition of a story
A minimum number of paths that must be removed from P so that the union of the remaining paths is a path story is called feedback path set. A natural question is whether the problem changes when a collection P is given as input, and the graph GP is defined by the union of the paths of P, where the endpoints of the paths in P form the set of black nodes of GP. However, transforming the input of the original problem into the equivalent case of the second one requires the calculation of all paths between the black nodes.

Biological application
Enumerating stories for interpreting metabolomics experiments
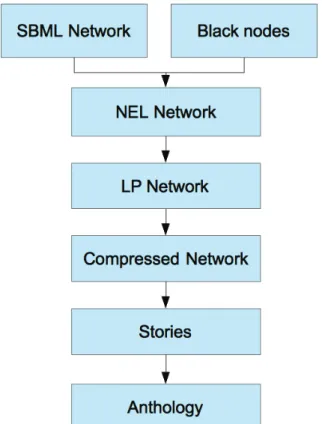
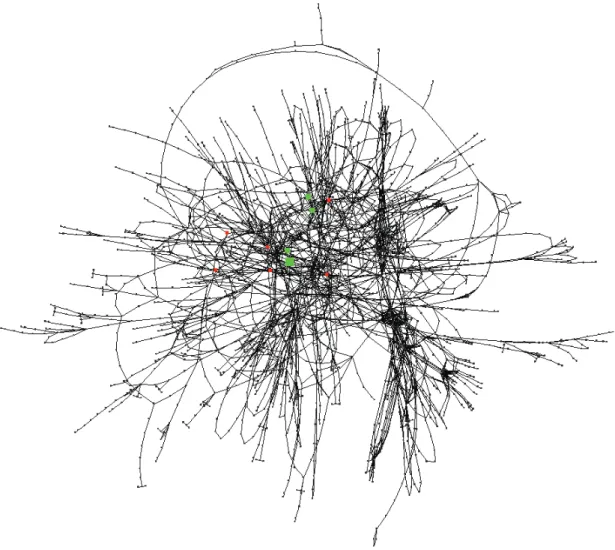
White nodes are also assumed to have zero intensity because they were not measured in the metabolomics experiment. The thickness of the arcs corresponds to the frequency with which each arc appears in the stories grouped in the anthology. In the second experiment, when the entire list of interesting compounds was considered, the com-.
Enumerating stories for recovering metabolic pathways
For example, Figure 3.25 represents one of the 69 metabolic pathways used in our experiment, namely the glucose fermentation superpathway. Arc thickness represents the frequency of the arc among the stories in the anthology. However, it is interesting to note that our method outperformed some of the methods shown in Faust et al.
Open problems and perspectives
This alternative definition of a story in terms of a set of hyperarches could also be a future direction of the present work. Note that any change in definition may imply a revision of the formal results presented here. The algorithm must also guarantee that any internal metabolite used in target synthesis can be regenerated.
Definitions
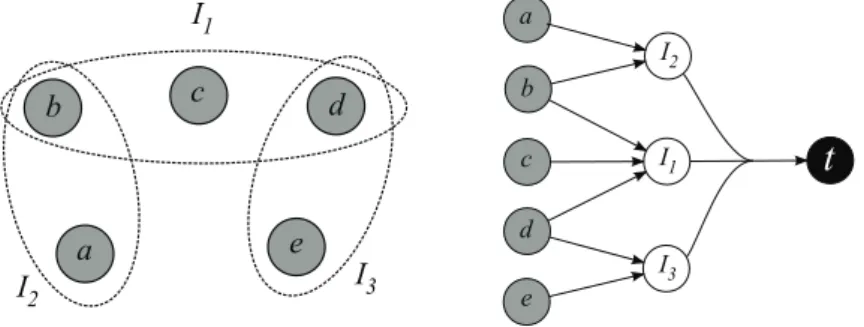
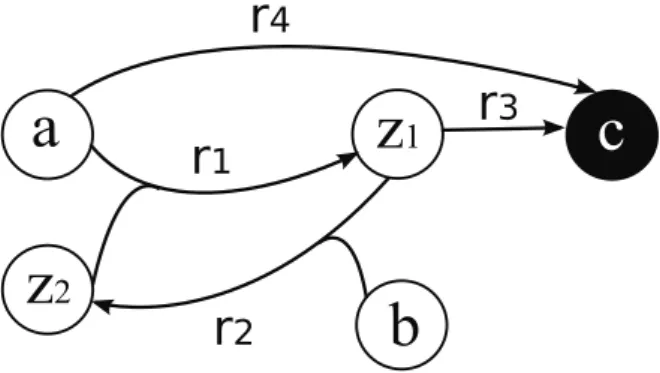
Romero and Karp considered a subsetX of the sourcesS as a precursor set of a target set T, whenT ⊆Fwd(X)(Romero and Karp,2001). A subset X of the sources is a precursor set of T if T and Z are both included in FwdZ(X). Now suppose that the target is a set of metabolites whose production we want to avoid.
Complexity results
Although finding a minimal set of precursors of an objective set is easy, obtaining a (minimal) set of precursors of minimal size is NP-hard. We show the robustness by proving the completeness version of the decision where we ask whether there exists a precursor set of size at most k. It is easy to see that the only minimal precursor set of T is the empty set.
Algorithms for precursor sets enumeration
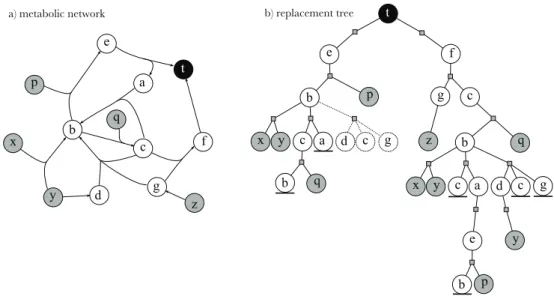
At each level, a metabolite is replaced by the substrates of the reactions that produce it. For this reason, we must explicitly include in the input of the subproblems the set of available metabolites, that is, the metabolites already analyzed in the previous steps of the algorithm. The algorithm ends by returning a cross-union of the solutions obtained for each m∈M, i.e., the minimal precursor sets for the production of the entire M set of metabolites.
Performance analysis
All algorithms were implemented in Java, more details on the modeling and coding aspects are given in the Appendix, and the runtimes were collected using a cluster for the computation and a limit of 1 GB of RAM for each process. Although pitufo may be fast for small networks, its use is limited because as the size of the networks grows, the method takes a long time to complete, and for some targets it does not complete within the given time limit of 24 hours. Note that the same instance (and not a random one) was used to collect the runtime for the different methods.

Biological application
By comparing with metabolites produced in the metabolic network of another bacterium (green arrays), we determined which metabolites are potentially provided by the cosymbiont or the insect host. On the contrary, the carbon metabolism of the latter seems dependent on that of S. Colored arrows indicate those generated in the metabolic network of the co-endocytobiont and those potentially provided by the insect host according to the literature.

Open problems and perspectives
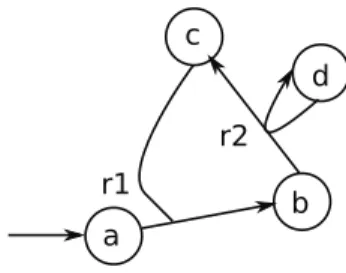
However, it is not clear how the minimality of the solutions is preserved after this addition. The idea is to find minimal hyperpathies that connect the target to resource subsets that satisfy the steady-state assumption, i.e., the internal metabolites in the hyperpathies must be balanced. Therefore, we can simply verify that the required amount of internal supply compounds is sufficient to keep the cycle running, with some left over to produce the target.
Introduction
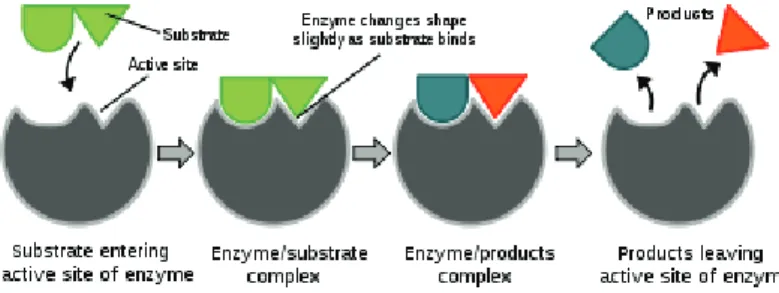
A set is closed if all metabolites produced from reactions for which all the inputs in the set are present will also be present and thus be part of the set. Intuitively, the concept of a chemical organization can be illustrated by means of the following experiment. If this set of metabolites is a chemical organization, one can look at the barrel again at any time, none of the original metabolites put in the barrel have disappeared (self-sustaining) and no new metabolite has appeared (locked). .
Definitions
In particular, the empty array closure will contain all inputs and anything that can be produced from them. A group of molecules is self-sustaining if there exists a flux vector such that the molecules present in the group can accumulate ((Sv)[i]>0) or be consumed and produced at the same rate ((Sv)[i] = 0) ( first and second conditions) but none of them can disappear (third condition). On the other hand, the closure of the empty set is and is an organization.

Chemical organisations in consistent networks
It follows from the flux consistency of the network and from Proposition 11 that the smallest organization is the entire network. The following result shows that the problem of finding a nontrivial organization in a mass and flux consistent network is NP-hard. Deciding whether a mass- and flux-consistent network contains non-trivial organization is NP-hard.
Enumerating chemical organisations
Furthermore, it is not an input from the network, as it would otherwise be black. A basic solution to finding all organizations is to know how to unblock all of the network's cycles. Therefore, instead of finding a framework set for all cycles of the network, it is enough to break all potentially blocking cycles to compute all reactive connected organizations.

Hitting set approach to enumerate organisations
Finally, a variation of the first algorithm was proposed to enumerate only reactive connected organizations. Note that the size of the frameset calculated by the algorithm is never larger than the number of blocking metabolites. In this case, the frameset has size 1, which is better than checking the combination of C with each of the blocking metabolites.
Open problems and perspectives
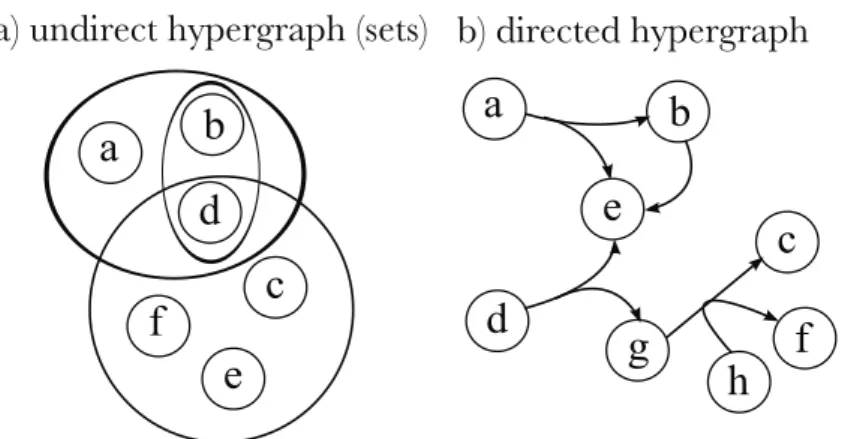
Graphs and hypergraphs
If the metabolite is not involved in the reaction, the value of the corresponding cell is zero. The forward propagation of C, denoted by Fwd(C), is the set of metabolites sequentially produced from C using network reactions. Note that if C is a closed set of molecules, then C must contain all network entries (since the empty set is a subset of C, the network entries must belong to RC).