HAL Id: hal-00302827
https://hal.archives-ouvertes.fr/hal-00302827
Submitted on 30 May 2007
HAL is a multi-disciplinary open access archive for the deposit and dissemination of sci- entific research documents, whether they are pub- lished or not. The documents may come from teaching and research institutions in France or abroad, or from public or private research centers.
L’archive ouverte pluridisciplinaire HAL, est destinée au dépôt et à la diffusion de documents scientifiques de niveau recherche, publiés ou non, émanant des établissements d’enseignement et de recherche français ou étrangers, des laboratoires publics ou privés.
Chemical composition of atmospheric aerosols between Moscow and Vladivostok
S. Kuokka, K. Teinilä, K. Saarnio, M. Aurela, M. Sillanpää, R. Hillamo, V.-M.
Kerminen, E. Vartiainen, M. Kulmala, A. I. Skorokhod, et al.
To cite this version:
S. Kuokka, K. Teinilä, K. Saarnio, M. Aurela, M. Sillanpää, et al.. Chemical composition of atmo- spheric aerosols between Moscow and Vladivostok. Atmospheric Chemistry and Physics Discussions, European Geosciences Union, 2007, 7 (3), pp.7473-7508. �hal-00302827�
ACPD
7, 7473–7508, 2007
Aerosol chemistry between Moscow and
Vladivostok S. Kuokka et al.
Title Page Abstract Introduction Conclusions References
Tables Figures
◭ ◮
◭ ◮
Back Close
Full Screen / Esc
Printer-friendly Version Interactive Discussion
EGU Atmos. Chem. Phys. Discuss., 7, 7473–7508, 2007
www.atmos-chem-phys-discuss.net/7/7473/2007/
© Author(s) 2007. This work is licensed under a Creative Commons License.
Atmospheric Chemistry and Physics Discussions
Chemical composition of atmospheric aerosols between Moscow and
Vladivostok
S. Kuokka1, K. Teinil ¨a1, K. Saarnio1, M. Aurela1, M. Sillanp ¨a ¨a1, R. Hillamo1, V.-M. Kerminen1, E. Vartiainen2, M. Kulmala2, A. I. Skorokhod3, N. F. Elansky3, and I. B. Belikov3
1Finnish Meteorological Institute, Erik Palm ´enin aukio 1, 00560, Helsinki, Finland
2University of Helsinki, Department of Physical Sciences, P.O. Box 64, 00014 University of Helsinki, Finland
3Obukhov Institute of Atmospheric Physics, Pyzhevsky 3, Moscow 119017, Russia Received: 13 April 2007 – Accepted: 11 May 2007 – Published: 30 May 2007 Correspondence to: K. Teinil ¨a (kimmo.teinila@fmi.fi)
ACPD
7, 7473–7508, 2007
Aerosol chemistry between Moscow and
Vladivostok S. Kuokka et al.
Title Page Abstract Introduction Conclusions References
Tables Figures
◭ ◮
◭ ◮
Back Close
Full Screen / Esc
Printer-friendly Version Interactive Discussion
EGU Abstract
The TROICA-9 expedition (Trans-Siberian Observations Into the Chemistry of the At- mosphere) was carried out at the Trans-Siberian railway between Moscow and Vladi- vostok in October 2005. Measurements of aerosol physical and chemical properties were made from an observatory carriage connected to a passenger train. Black car-
5
bon (BC) concentrations in fine particles (PM2.5, aerodynamic diameter<2.5µm) were measured with an aethalometer using a five-minute time resolution. Concentrations of inorganic ions and some organic compounds (Cl−, NO−3, SO24−, Na+, NH+4, K+, Ca2+, Mg2+, oxalate and methane sulphonate) were measured continuously by using an on- line system with a 15-min time resolution. In addition, particle volume size distributions
10
were determined for particles in the diameter range 3–850 nm using a 10-min. time resolution. The continuous measurements were completed with 24-h. PM2.5filter sam- ples which were stored in a refrigerator and later analyzed in chemical laboratory. The analyses included mass concentrations of PM2.5, ions, monosaccharide anhydrides (levoglucosan, galactosan and mannosan) and trace elements (Al, As, Cd, Co, Cr, Cu,
15
Fe, Mn, Ni, Pb, Sb, V and Zn). The mass concentrations of PM2.5varied in the range of 4.3–34.8µg m−3 with an average of 21.6µg m−3. Fine particle mass consisted mainly of BC (average 27.6%), SO2−4 (13.0%), NH+4 (4.1%), and NO−3 (1.4%). One of the ma- jor constituents was obviously also organic carbon which was not determined. The contribution of BC was high compared with other studies made in Europe and Asia.
20
High concentrations of ions, BC and particle volume were observed between Moscow and roughly 4000 km east of it, as well as close to Vladivostok, primarily due to local anthropogenic sources. In the natural background area between 4000 and 7200 km distance from Moscow, observed concentrations were low, even though there were lo- cal particle sources, such as forest fires, that increased occasionally concentrations.
25
The measurements indicated that during forest fire episodes, most of the aerosol mass consisted of organic particulate matter. Concentrations of biomass burning tracers lev- oglucosan, oxalate and potassium were elevated close to the forest fire areas observed
ACPD
7, 7473–7508, 2007
Aerosol chemistry between Moscow and
Vladivostok S. Kuokka et al.
Title Page Abstract Introduction Conclusions References
Tables Figures
◭ ◮
◭ ◮
Back Close
Full Screen / Esc
Printer-friendly Version Interactive Discussion
EGU by the MODIS satellite. The polluted air masses from Asia seem to have significant in-
fluences on the concentration levels of fine particles over south-eastern Russia.
1 Introduction
Atmospheric aerosol particles have significant influences on our environment and the quality of our life. In global and regional scales, aerosol particles have a potential to
5
affect climate and hydrological cycle (Ramanathan et al., 2001; Penner et al., 2006; Yu et al., 2006). More locally, and especially in polluted urban environments, aerosol par- ticles deteriorate visibility and have adverse effects on human health (Watson, 2002;
Pope and Dockery, 2006). Better understanding of these aerosol effects requires de- tailed information on how aerosol particles originating from different sources are dis-
10
tributed in the atmosphere and how the chemical and physical properties of the parti- cles vary from location to location.
Until now, very little is known about the concentrations and chemical composition of aerosol particles over the Russian territory. Such information would be of great inter- est for several reasons. First, there are large urban areas and industrial complexes
15
in Russia with poorly known but potentially large emissions of anthropogenic aerosol particles. Aerosol measurements downwind of such sources would be of great benefit for global aerosol modelers, as well as for people planning air quality regulations in Russia. Second, most of the Earth’s boreal forests are located in Russia. A recent analysis based on long-term aerosol measurements demonstrated that boreal forests
20
in Northern Europe produce large quantities natural aerosol particles into the atmo- sphere (Tunved et al., 2006). Whether forests in Russia are capable of doing the same cannot be verified without detailed aerosol measurements there. Third, aerosol parti- cles formed by agricultural and forest fires in Russia can, under suitable meteorological conditions, deteriorate seriously the air quality all the way through Europe and over high
25
Arctic areas (e.g. Saarikoski et al., 2007; Stohl et al., 2007). Aerosol measurements in the vicinity of these fire spots would be of great help in developing operational systems
ACPD
7, 7473–7508, 2007
Aerosol chemistry between Moscow and
Vladivostok S. Kuokka et al.
Title Page Abstract Introduction Conclusions References
Tables Figures
◭ ◮
◭ ◮
Back Close
Full Screen / Esc
Printer-friendly Version Interactive Discussion
EGU by which such air pollution episodes could be predicted in the future.
In this paper, we present results from aerosol measurements conducted using a car- riage mobile laboratory in a moving passenger train in Russia. The measurement cam- paign lasted for two weeks, during which period we traveled roughly a 10 000 km tran- sect from Moscow to Vladivostok and back. The measurements discussed here include
5
fine particle mass and volume concentration and the chemical composition of fine par- ticulate matter. Both on-line measurement techniques and more traditional filter-based sampling methods were used. The main objective of this paper is to provide, for the first time ever, experimental information on aerosol chemistry over a relatively large geo- graphical area in Russia. In this regard, we will investigate how the PM2.5concentration
10
and its chemical composition varied between urban, rural and remote areas encoun- tered during the trip, and how our observations compare with similar ones made earlier in Europe, in Northern America and in major Asian cities. We will further illustrate that despite their complexity and associated problems, rapid on-line chemical techniques, such as Particle Into Liquid Sampler (PILS), are applicable in moving measurement
15
platforms and have real advantages over more traditional sampling techniques.
2 Measurements
2.1 Description of the campaign
The TROICA-9 expedition continues the series of Transcontinental Observations Into the Chemistry of Atmosphere train-based campaigns having occurred since 1995
20
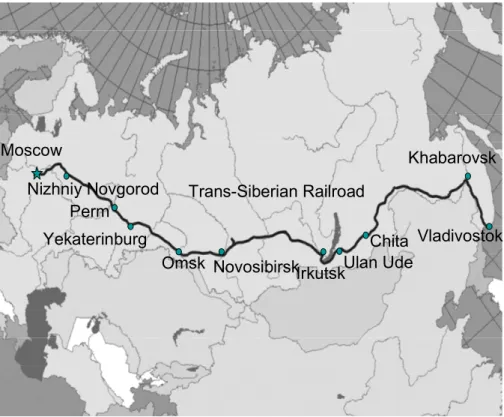
(Crutzen et al., 1998; Oberlander et al., 2002, and others). It started on 4 October 2005 from Moscow and reached Vladivostok on 10 October 2005. The journey from Vladivostok back to Moscow started on 11 October and ended on 18 October. Figure 1 shows the course of the Trans-Siberian railway from Moscow to Vladivostok, over a distance of 9200 km.
25
An observatory carriage was coupled to a passenger train just behind the elec-
ACPD
7, 7473–7508, 2007
Aerosol chemistry between Moscow and
Vladivostok S. Kuokka et al.
Title Page Abstract Introduction Conclusions References
Tables Figures
◭ ◮
◭ ◮
Back Close
Full Screen / Esc
Printer-friendly Version Interactive Discussion
EGU tric locomotive and it was equipped with several continuously-measuring instruments
for aerosol particles and gases. TROICA-9 was the second campaign that had been carried out on the new laboratory carriage elaborated and manufactured at the Torzhok carriage plant in Russia specially for making atmospheric measurements. The Obukhov Institute of Atmospheric Physics in Russia had instruments for measuring me-
5
teorological parameters and concentrations of main trace gases. A global positioning system (GPS) was used to get an accurate location of the train. Events such as forest fires and observed settlements were marked on a diary. Aerosol chemical and physical measurements were made by the Finnish Meteorological Institute and the University of Helsinki. Most of the measurements were made with high temporal resolution.
10
2.2 Instrumentation and chemical analyses
The sample air for aerosol measurements was taken from the roof of the carriage. It was estimated that when the average train speed is 80 km/h and the bulk flow rate of the aerosol sampling system is 38.4 l min−1, the sampling flow is close to isokinetic with a 6 mm diameter tube. The aerosol instruments were connected to an uninterruptible
15
power system (UPS) in order to avoid interruptions in measurements.
The black carbon (BC) concentration was measured with a 5-min time resolution us- ing a dual-wavelength aethalometer (model AE-42, Magee Scientific; Hansen et al., 1984) with a flow rate of 5 l min−1. The aethalometer operates at 370 nm (UV channel) and 880 nm (IR channel) wavelengths, and it was equipped with a cyclone remov-
20
ing particles larger than 2.5µm in aerodynamic diameter. The aethalometer collects particles on a quartz fiber filter and measures the light attenuation simultaneously for both wavelength channels. The method uses an inverse-lambda relationship in order to scale the UV channel data relative to the IR channel. The assumed absorption cross-section was 39.5 m2g−1for the 370 nm channel and 16.6 m2g−1 for the 880 nm
25
channel. BC has a strong absorption in IR and UV region. In the near UV region also many aromatic organic species have strong absorbance, such as those present in wood smoke and in fresh diesel exhaust.
ACPD
7, 7473–7508, 2007
Aerosol chemistry between Moscow and
Vladivostok S. Kuokka et al.
Title Page Abstract Introduction Conclusions References
Tables Figures
◭ ◮
◭ ◮
Back Close
Full Screen / Esc
Printer-friendly Version Interactive Discussion
EGU The ionic composition of aerosol particles was measured using a Particle Into Liquid
Sampler (PILS; Metrohm Peak Inc; Orsini et al., 2003) coupled with two ion chro- matographs (IC) for direct on-line analysis of the collected sample. A virtual impactor (VI; Loo and Cork, 1988) was used to remove particles larger than 2.5µm in aerody- namic diameter from the sampled air. The major flow of the VI (15 l min−1) with only
5
the fine fraction (particles smaller than 2.5µm) of aerosol particles was fed into the PILS system. Annular denuders (URG) were placed in a series in the sampling line before the VI and the PILS. They were used to remove acidic gases and ammonia from the sample air. Two denuders were coated using KOH (1%) solution and one denuder was coated using H3PO4 (3%) solution. Inside the PILS aerosol particles
10
are grown to droplets inside a cavity containing water vapour. After the cavity the droplets are impacted onto a collection plate. The impaction plate is washed offwith a steady stream of transport liquid containing an internal standard (LiF) and delivered into two sample loops (1000µl), one for anions and the other for cations. The sam- ples were analysed simultaneously using two Dionex ICS-2000 ion chromatographs
15
(Dionex, Sunnyvale, USA). The anions were analyzed using a 4×250 mm AS-18 an- alytical column, 4×50 mm AG-18 guard column, 4 mm ASRS-ULTRA II suppressor, CR-ATC anion trap column and potassium hydroxide eluent generator. The cations were analyzed using a 4×250 mm CS12A analytical column, 4×50 mm CG-12A guard column, 4 mm CSRS-ULTRA II suppressor, CR-CTC cation trap column and methane-
20
sulphonic acid eluent generator. Concentrations of Cl−, NO−3, SO24−, Na+, NH+4, K+, Ca2+, Mg2+, oxalate and methane sulphonate (MSA) were quantified with a time res- olution of 15 min. The uncertainty of the IC analysis connected with PILS is estimated to be 5%, even though higher uncertainties can be encountered close to the detection limit. The level of noise in the baseline was negligible in this instrumental set-up, so the
25
limit of detection was estimated to be 0.3 ng ml−1for all ions. This is equivalent to the approximately 0.005µg m−3concentration in the air.
A VI that was identical with that used in connection with the PILS, was used to collect samples for gravimetric and chemical analysis. The VI divides the sample into fine
ACPD
7, 7473–7508, 2007
Aerosol chemistry between Moscow and
Vladivostok S. Kuokka et al.
Title Page Abstract Introduction Conclusions References
Tables Figures
◭ ◮
◭ ◮
Back Close
Full Screen / Esc
Printer-friendly Version Interactive Discussion
EGU (aerodynamic particle diameter Dp<2.5µm) and coarse fractions (2.5µm<Dp<8µm).
The particles were collected on polytetrafluoroethylene (PTFE) filters (diameter 47 mm, pore size 3µm, type FS, Millipore). The fine particle filter was followed by a nylon backup filter (Pall, Nylasorb, pore size 1.0µm) in order to collect nitric acid evaporating from aerosol particles on the upper filter. The VI used the same sampling line as the
5
PILS system, so acidic gases and ammonia were removed also from the sample air entering the VI. The total flow rate of the VI was 16.7 l min−1. The sampling duration was 24 h. The PTFE filters were weighed before and after the sampling. After the sampling, the PTFE samples were cut into four pieces and stored frozen at −20◦C before chemical analysis.
10
Anions and cations were analyzed from the PTFE filters by using two Dionex DX500 ion chromatograph systems (Dionex, Sunnyvale, USA). A quarter of the filter was used to extract collected particulate matter using a solution consisting of 10% MeOH in deionized water (Milli-Q, Millipore Gradient A10). The anions were analyzed using a 4×250 mm AS-11 analytical column and 4×50 mm AG-11 guard column with chem-
15
ical suppression (sulfuric acid) and NaOH eluent. The cations were analyzed using a 4×250 mm CS-12A analytical column, 4×50 mm CG-12A guard column, 4 mm CSRS- ULTRA II suppressor and methanesulfonic acid eluent. The determined ions were the same as those determined by the PILS-IC system. The uncertainty of IC analysis from the filters is 5–10% for all of the analyzed ions. Anions from the nylon backup filters
20
were analyzed in a similar way as in case of the PTFE filters.
Three monosaccharide anhydrides (levoglucosan, galactosan, mannosan) were de- termined from one quarter of the VI samples by using a liquid chromatograph mass spectrometer (LC-MS; Agilent 1100 Series, Trap SL, Agilent Technologies, USA).
The standards for quantitative chemical analysis were prepared by dissolving known
25
amounts of monosaccharide anhydrides with 50% tetrahydrofurane in deionized water.
The VI samples were dissolved with 50% tetrahydrofurane in deionized water. The un- certainty of LC-MS method for monosaccharide anhydrides was estimated to be 20%.
The trace elements were analyzed by using an inductively coupled plasma mass
ACPD
7, 7473–7508, 2007
Aerosol chemistry between Moscow and
Vladivostok S. Kuokka et al.
Title Page Abstract Introduction Conclusions References
Tables Figures
◭ ◮
◭ ◮
Back Close
Full Screen / Esc
Printer-friendly Version Interactive Discussion
EGU spectrometer (ICP-MS; Perkin Elmer Sciex Elan 6000, The Perkin-Elmer Corporation,
Norwalk, USA) from one quarter of the VI samples. The aerosol sample was extracted with a HNO3-HF mixture (3+1) (Jalkanen et al., 1996). Al, As, Cd, Co, Cr, Cu, Fe, Mn, Ni, Pb, Sb, V and Zn were analysed by the ICP-MS. The uncertainty of the ICP-MS analyses was of the order of 25% for Cr, Cu and Ni, 30% for Zn, 35% for Fe and 20%
5
for all the other trace elements.
Particle number size distributions were measured with a twin differential mobility particle sizer (DMPS; Winklmayr et al., 1991). The DMPS measured the number of particles in 50 (+2 zero) partially overlapping voltage channels (for more detailed de- scription of the DMPS used see Vartiainen et al., 2007). The DMPS raw data were
10
converted into number size distributions which were further converted into volume size distributions. By integrating the volume of particles between 3 and 950 nm (electrical mobility diameter of a particle), the total volume concentration of particles for this size range was obtained with a ten-minute time resolution.
2.3 Other data
15
The laboratory carriage was equipped with instruments for measuring meteorological data (temperature, air pressure, humidity, solar radiation) as well as concentrations of gaseous compounds (O3, NO, NO2, CO, CO2, SO2, CH4, NMHC). Measurements were also made for the wind speed, wind direction, vertical wind speed and for the concentrations of of222Rn, and its decay products (218Po,214Pb,214Bi). The date and
20
time, distance in kilometers from Moscow, latitude, longitude, altitude, and the speed and course of the train were recorded during the journey using a GPS.
3 Results and discussion
The concentrations of measured chemical components in aerosol particles varied largely during the journey. This was expected, since the railway route included remark-
25
ACPD
7, 7473–7508, 2007
Aerosol chemistry between Moscow and
Vladivostok S. Kuokka et al.
Title Page Abstract Introduction Conclusions References
Tables Figures
◭ ◮
◭ ◮
Back Close
Full Screen / Esc
Printer-friendly Version Interactive Discussion
EGU ably polluted regions from Moscow to Yekaterinburg and from Khabarovsk to Vladivos-
tok (Fig. 1). In these areas the main aerosol sources are energy production, process industry and traffic. The railway route went also through sparsely-populated regions in mid-Siberia between Novosibirsk and Chita (Fig. 1). In this natural background area, there were major local sources due to forest fires, which could be seen as high tem-
5
porary concentration levels in the measurements. In this paper, we concentrate on the PM2.5aerosol fraction.
3.1 Back trajectories and meteorological conditions during the expedition
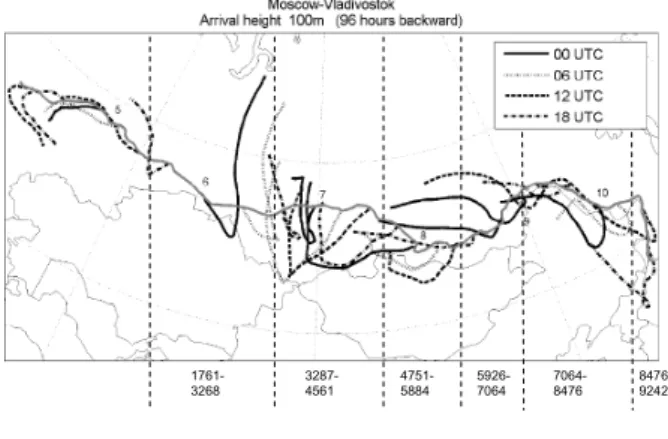
Backward air mass trajectories during the journey were calculated for 96 h using the arrival heights of 100 m and 500 m above the ground level. The trajectories were cal-
10
culated every six hours, such that each trajectory arrival time was equal to the location of the train. According to the trajectory analysis, the source areas of the sampled air masses were different between the two transects (from Moscow to Vladivostok and from Vladivostok to Moscow) (Fig. 2). In the middle of the route air came mainly from the south-west direction (direction of Kazakhstan) on the way to Vladivostok and from
15
northern side of Mongolia on the way back to Moscow. Near Vladivostok the mea- sured air masses came from west (mid-Siberia) on the way to Vladivostok, whereas on the way back to Moscow the air came from south (China). Trajectories were very similar between the 100 and 500 m heights. The average ambient temperature var- ied between−5.5 and 22.3◦C and relative humidity between 24 and 100% during the
20
expedition. The air pressure varied in the range 896–1025 mbar.
3.2 Particulate mass concentrations
The mass concentrations of PM2.5 from the VI samples varied in the range 4.3–
34.8µg m−3, the average concentration being 21.6µg m−3. The PM2.5 mass concen- trations were, in general, at the same level as PM2.5concentrations measured at urban
25
background sites in different European cities (20 to 30µg m−3) (Querol et al., 2004). In
ACPD
7, 7473–7508, 2007
Aerosol chemistry between Moscow and
Vladivostok S. Kuokka et al.
Title Page Abstract Introduction Conclusions References
Tables Figures
◭ ◮
◭ ◮
Back Close
Full Screen / Esc
Printer-friendly Version Interactive Discussion
EGU one region in mid-Siberia on the way back to Moscow, the PM2.5 mass concentration
was lower than what has been reported for regional background sites (8 to 20µg m−3) in Europe (Querol et al., 2004). The measured concentrations were similar to those (6 to 31.3µg m−3) observed urban areas in the United States (Pinto et al., 2004). The mass concentrations measured in this work were substantially lower than concentra-
5
tions measured in six Asian cities (Kim Oanh et al., 2006) during the dry season (44–
168µg m−3) and during most of the wet season (18–104µg m−3).
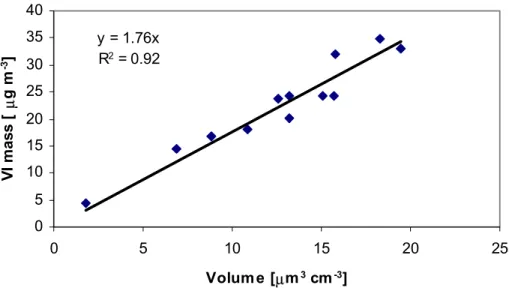
The PM2.5mass concentrations obtained from the VI measurement were compared with particle volume concentrations obtained from the DMPS measurements. In order to do this, we averaged the DMPS data over each VI sampling. There was a high cor-
10
relation between the mass and volume concentrations (R2=0.92, Fig. 3). The average density of aerosol particles during the campaign can be estimated from the slope of the regression line, and it was 1.76 g cm−3. The density varied between 1.5 and 2.4 g cm−3 during the campaign, being higher close to Vladivostok and lower near Moscow. On comparison, the density obtained in a similar way for fine particle samples collected
15
in a background area of southern Finland in May 2004 (Saarikoski et al., 2005) was 1.66±0.13 g cm−3.
3.3 Chemical composition of PM2.5
The concentrations of the measured ions and total mass as well as the concentra- tions of levoglucosan, galactosan and mannosan from the virtual impactor samples
20
(Dp<2.5µm) are shown in Tables 1 and 2. The BC concentration from the aethalome- ter measurements was averaged over each VI sampling period (Table 2). Concentra- tions of most of the ions and BC were at low levels in mid-Siberia, whereas higher concentrations were observed near Moscow and Vladivostok. The different concen- tration levels between the urban and rural areas could be seen more clearly on the
25
way back to Moscow than on the way to Vladivostok. The particle mass concentration followed closely the concentrations of major ions. However, on the way to Vladivostok there was one sample with an increased particle mass concentration in mid-Siberia in
ACPD
7, 7473–7508, 2007
Aerosol chemistry between Moscow and
Vladivostok S. Kuokka et al.
Title Page Abstract Introduction Conclusions References
Tables Figures
◭ ◮
◭ ◮
Back Close
Full Screen / Esc
Printer-friendly Version Interactive Discussion
EGU which the concentrations of ions were not elevated. This increase was due to forest
fires as discussed later in this paper.
The levoglucosan concentration, a tracer of incomplete biomass combustion (Si- moneit et al., 1999), varied typically between 0.01 and 0.45µg m−3, but in one sam- ple (5926–7064 km from Moscow) on the way to Vladivostok it reached a value of
5
0.96µg m−3 (Table 2). The particle mass concentration was highest for this sample.
However, compared to other samples, the ion and BC concentrations did not increase in a similar way as did levoglucosan. This shows indirectly that in this sample most of the aerosol mass consisted of particulate organic matter. The high contribution of particulate organic matter is most probably due to biomass burning, as has been ob-
10
served also elsewhere during forest fire episodes (Saarikoski et al., 2007). In the area having the high levoglucosan concentration, the aethalometer UV channel showed sus- tained increases over the IR channel concentration, which is probably due to organic compounds absorbing the UV radiation (Table 2).
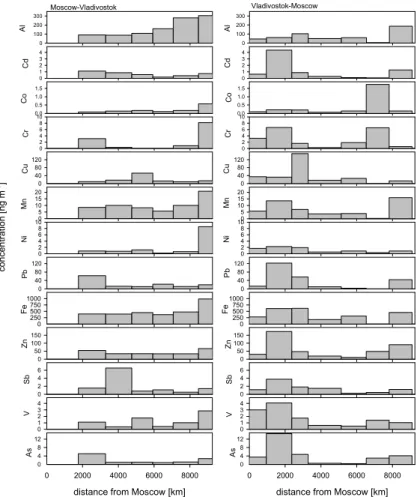
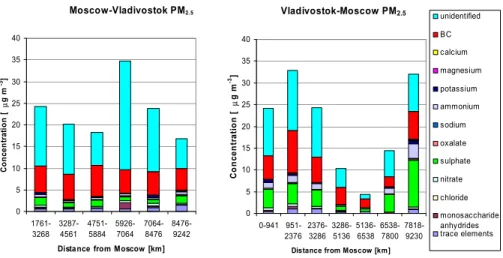
The concentrations of the trace elements from the VI samples in PM2.5 are shown
15
in Fig. 4. The VI sample corresponding to the distance of 951–2376 km from Moscow (on the way from Vladivostok to Moscow) was collected when the train passed through the big cities of Yekaterinburg and Perm. In this sample the concentrations of Pb, Zn, As, V and Cd were at their highest level. In the same area also the concentrations of BC were at their highest. Near big cities traffic and different industrial processes can
20
be sources of these compounds. The same compounds had high concentration on the way to Vladivostok, but since the measurements started after Perm, the VI sample 1761–3268 km from Moscow included only the passage through Yekaterinburg. In the VI samples close to Vladivostok, the concentrations of soil-derived elements Al, Ca, Fe and Mn (Song et al., 2001) were elevated both when going to Vladivostok and
25
when coming back to Moscow. The concentrations of Cr and Ni were elevated near Vladivostok only on the way there, but not when coming back to Moscow. This indicates that their sources are more likely regional or long-range transport than local. Cr and Ni can be emitted from coal or oil combustion (NAEI, 2003).
ACPD
7, 7473–7508, 2007
Aerosol chemistry between Moscow and
Vladivostok S. Kuokka et al.
Title Page Abstract Introduction Conclusions References
Tables Figures
◭ ◮
◭ ◮
Back Close
Full Screen / Esc
Printer-friendly Version Interactive Discussion
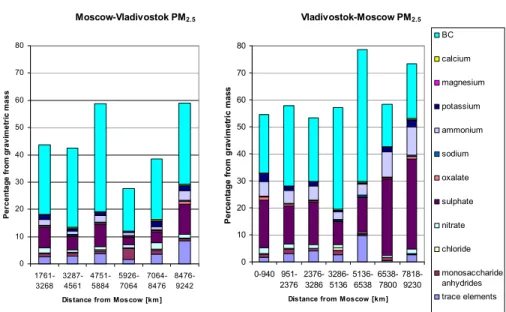
EGU A summary of the mean mass concentrations in PM2.5and chemical components in it
between Moscow and Vladivostok are shown in Fig. 5. The mass concentrations were taken from the VI samples, except that of BC which was taken from the aethalometer measurements. The contributions of measured chemical compounds to fine particles for each VI sample are shown in Fig. 6. Fine particles consisted mainly of BC (15.8–
5
48.7%, average 27.6%), SO2−4 (2.7–33.5%, 13.0%), NH+4 (1.2–10.5%, 4.1%), and NO−3 (0.5–2.4%, 1.4%). Trace metals together accounted for 0.4–9.8% of the fine particulate mass. The fraction of monosaccharide anhydrides was usually in the range 0.4–1.6%, but in one sample (5926–7064 km from Moscow) on the way to Vladivostok it was as high as 4%. The measured chemical components accounted for 27.7–78.5% of
10
the PM2.5 mass. The unidentified fraction is expected to include organic particulate matter, water-insoluble material and water. The unidentified fraction was the highest in the sample, for which the total aerosol mass concentration and the concentration of levoglucosan were the highest. As mentioned earlier, most of the unknown mass in this sample was probably organic particulate matter formed in forest fires. Close
15
to wildfires or biomass burning, organic material can account for up to 70–90% of the total aerosol mass (Yamasoe et al., 2000).
The contribution of BC to PM2.5was much higher during the whole expedition than what has been observed in Europe, where the BC fraction has estimated to be 5–
10% (Putaud et al., 2004). The fraction of EC (elemental carbon) in PM2.5 has been
20
found to be 5.4–9.0% in urban areas in Europe (Sillanp ¨a ¨a et al., 2006). In China, the contribution of EC to PM2.5has been estimated to be 6.6–8.8% (Cao et al., 2004).
Measurements made by Sillanp ¨a ¨a et al. (2006) at six urban sites in Europe showed 14–
31% contribution for the nss-SO24−. During our expedition the SO24− contribution was lower on the way to Vladivostok, but on the way to Moscow it was close to contributions
25
measured in Europe. The contributions of NO−3 and NH+4 to PM2.5in Europe have been found to be in ranges 1.1–18% and 7.0–9.3% (Sillanp ¨a ¨a et al., 2006), respectively, which are higher values than measured during our expedition.
ACPD
7, 7473–7508, 2007
Aerosol chemistry between Moscow and
Vladivostok S. Kuokka et al.
Title Page Abstract Introduction Conclusions References
Tables Figures
◭ ◮
◭ ◮
Back Close
Full Screen / Esc
Printer-friendly Version Interactive Discussion
EGU 3.4 Variability of concentrations during the campaign
In order to get information on rapidly changing concentrations of ions in aerosol parti- cles, PILS measurements were made during the journey. The 15-min time resolution of the PILS gives much better information on the changing aerosol ion composition than the VI which integrates the sampling over more than a thousand of kilometers. Ion con-
5
centrations from PILS measurements are typically lower than concentrations based on filter or impactor measurements (Orsini et al., 2003). The typical concentration ratios between the PILS and impactor measurements have been of the order of 0.7–0.9 (Ma et al., 2004) for major ions like SO2−4 , NO−3 and NH+4. The correlations between PILS measurements and impactor measurements have usually been reasonably good (Ma
10
et al., 2004).
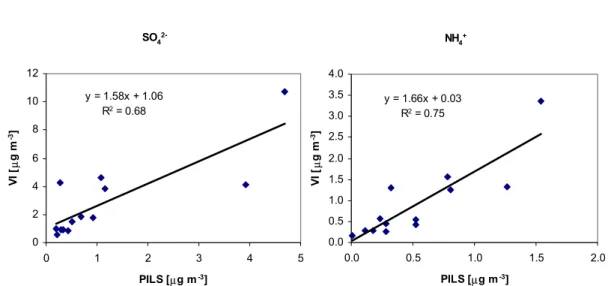
It seems that there were some problems with the PILS measurements during the expedition. The comparison of PILS results to VI results showed that their ratio was unusually low, and that the agreement between the PILS and VI results were good only for sulphate (R2=0.68) and ammonium (R2=0.75). The correlations between VI
15
concentrations and average PILS concentrations during the sampling time for SO24− and NH+4 are shown in Fig. 7. Uncertainties in the PILS measurements can be due to uncertainties in the IC analyses connected with the PILS system, in sample or liquid flow rates, or in particle losses inside the sampling system. The sample flow rate was monitored during the expedition and losses for particles smaller than 2.5µm of
20
aerodynamic diameter should have been minimal. The accuracy of the IC systems was checked with standard test solutions. The most probable explanation for the lower concentrations measured with the PILS system was either the problems with the liquid flow rates of the system or some unexpected problems caused by strong vibrations in the moving train. Concentrations of potassium, oxalate, sodium, chloride, calcium and
25
magnesium were near the detection limit of the PILS system, which further explains the problems associated with their measurements.
The differences between the VI and PILS measurements were unexpectedly large
ACPD
7, 7473–7508, 2007
Aerosol chemistry between Moscow and
Vladivostok S. Kuokka et al.
Title Page Abstract Introduction Conclusions References
Tables Figures
◭ ◮
◭ ◮
Back Close
Full Screen / Esc
Printer-friendly Version Interactive Discussion
EGU for nitrate, although the measured nitrate concentrations were most of the time clearly
above the detection limit. In some occasions nitrate concentrations measured with the PILS were much higher than those measured with the VI. When looking in more detail at the VI and PILS results, it seems that evaporation of nitrate from the PTFE filters had been taking place during the samplings. Large amounts of nitrate were found in
5
the nylon backup filters, and also small amounts of chloride. Sometimes the nitrate concentrations in the nylon filters were higher than those in the PTFE filters. When comparing the nitrate concentration obtained from the PILS with the sum of nitrate found in the PTFE and nylon filters (Table 2), the agreement between these two mea- surement devices is much better. The calculated average cation to anion ratio (PTFE)
10
was 0.98 and varied from 0.91 to 1.07. This ratio is related to the acidity of aerosol particles and was near unity here. It is possible that particulate ammonium nitrate and ammonium chloride evaporated as volatile acids like nitric acid and hydrochloridic acid from the PTFE filter during the sampling. Since denuders were used upstream of the sampling line, the extent of evaporation from the PTFE filters may have increased.
15
Such evaporation is taking place until equilibrium between the cations and anions is being reached (neutralization). When looking at the VI sample between 7818–9230 km on the way back to Moscow, much higher nitrate concentrations were obtained from the PILS measurements than from the VI PTFE filter. In this sample also the amount of nitrate found in the nylon backup filter was the highest. The high concentration of sul-
20
phate in this same sample indicates that the collected aerosol was very acidic, which have probably increased the evaporation of nitrate from the PTFE filter.
Although the concentrations from the PILS measurements were lower than those from the VI measurements, they still give valuable information on the variability of the ion concentrations during the journey because of their high time resolution. From the
25
PILS data it is also possible to find temporary high concentration levels and exact locations of the events such as forest fires. The PILS data were used in this study merely to see fast temporal variations in ion concentrations.
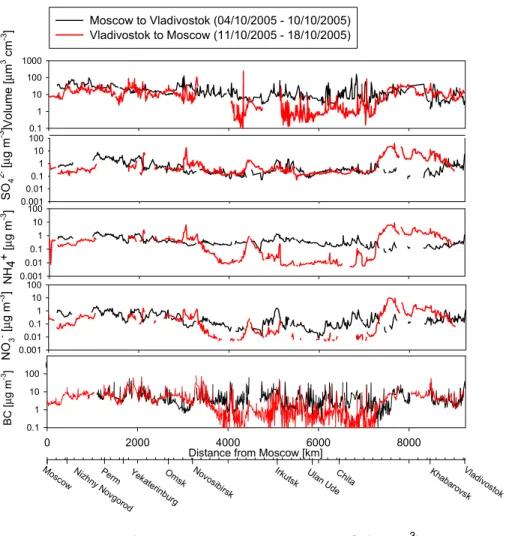
The concentrations of SO2−4 , NO−3 and NH+4 from the PILS measurements
ACPD
7, 7473–7508, 2007
Aerosol chemistry between Moscow and
Vladivostok S. Kuokka et al.
Title Page Abstract Introduction Conclusions References
Tables Figures
◭ ◮
◭ ◮
Back Close
Full Screen / Esc
Printer-friendly Version Interactive Discussion
EGU (Dp<2.5µm), BC from the aethalometer and volume concentration of particles
(µm3cm−3) from DMPS measurements are shown in Fig 8. On the way to Vladivostok the measured concentrations did not show a very large variability. On the way back to Moscow, clear differences between the background areas in mid-Siberia (4000–
7200 km from Moscow) and urban areas could be seen. Also several temporary high
5
concentration levels could be identified from the PILS data. Some of them were due to passing through industrial areas during the journey. Especially in the beginning of the way back to Moscow (7400–8800 km from Moscow), the concentration of SO24−, NO−3, NH+4, and BC as well as the total particle volume concentration were high.
3.5 Selected regions
10
3.5.1 A high-concentration region
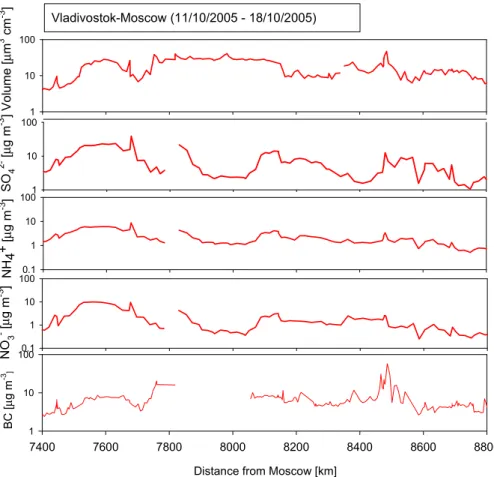
On the way back to Moscow, concentrations of ions, BC and particle volume were at a high level over large distance (7400–8800 km from Moscow). The concentrations of SO24−, NO−3 and NH+4 were around one order of magnitude higher on the way to back to Moscow than on the way to Vladivostok. The concentrations of BC and particle
15
volume were quite similar during both directions in this area, but high compared with concentrations measured during the whole expedition. From the calculated air mass back trajectories it can be seen that on the way back to Moscow, the ion concentrations were high for air masses traveled through the north-east China and close to the city of Beijing. When the source area of the air masses was close to the Russian border on
20
the way to Vladivostok, the concentrations of ions were not as high.
It is quite evident that the measured high concentrations on the way back to Moscow were mostly long-range-transported aerosol particles. The increased potassium and oxalate concentrations in this area are indicative of combustion sources. The presence of calcium is an indicator of long-range-transported soil particles. The concentrations
25
of SO2−4 , NO−3 and NH+4 from the PILS measurements (Dp<2.5µm) and BC from the
ACPD
7, 7473–7508, 2007
Aerosol chemistry between Moscow and
Vladivostok S. Kuokka et al.
Title Page Abstract Introduction Conclusions References
Tables Figures
◭ ◮
◭ ◮
Back Close
Full Screen / Esc
Printer-friendly Version Interactive Discussion
EGU aethalometer measurements as well as the concentration of particles (µm3cm−3) from
the DMPS measurements in this region are shown in Fig. 9. The concentrations of SO24−, NO−3 and NH+4 correlated strongly with each other (R2=0.95 between SO24− and NH+4; R2=0.79 between SO2−4 and NO−3; R2=0.88 between NO−3 and NH+4). The con- centrations of BC and total particles volume behaved similarly to each other but had
5
no correlation with ion concentrations. The concentrations of both SO24− and BC were above 1µg m−3 throughout the region, that of NH+4 was mainly above 1µg m−3, and that of NO−3 was mostly below 1µg m−3. The particle volume concentration was most of the time above 10µm3cm−3.
3.5.2 A low-concentration region
10
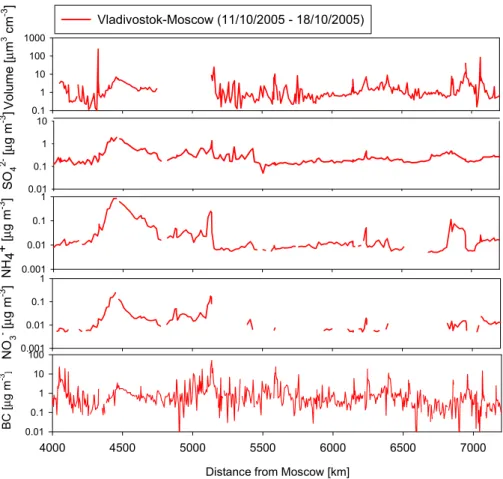
The lowest ion concentrations were measured in mid-Siberia (4000–7200 km from Moscow) on the way back to Moscow. This is a rural area with few local pollution sources. In addition to ions, also the concentrations of BC and particle volume were very low in this area. However, the concentration of NO−3, NH+4, BC and particle volume were around one order of magnitude higher on the way to Vladivostok than on the way
15
back to Moscow. The concentration of sulphate was nearly at the same level during both directions. There was a clear difference in the origin of the air masses between the way to Vladivostok and back to Moscow. It seems that when the air masses were coming from over the northern side of the railroad in mid-Siberia, the air was much cleaner than air from the west or south direction from south-Russia or near from the
20
border of Kazakhstan.
The concentrations of SO2−4 , NO−3 and NH+4 from the PILS measurements (Dp<2.5µm) and volume concentration of particles (µm3cm−3) from the DMPS mea- surements in the low-concentration region are shown in Fig. 10. In this region, SO24−, NO−3 and NH+4 concentrations correlated quite strong with each other (R2=0.80 be-
25
tween SO2−4 and NH+4; R2=0.69 between SO2−4 and NO−3; R2=0.71 between NO−3 and
ACPD
7, 7473–7508, 2007
Aerosol chemistry between Moscow and
Vladivostok S. Kuokka et al.
Title Page Abstract Introduction Conclusions References
Tables Figures
◭ ◮
◭ ◮
Back Close
Full Screen / Esc
Printer-friendly Version Interactive Discussion
EGU NH+4). Concentration of BC and total particles volume behaved similarly to each other
but had no correlation with ion concentrations. The concentration of SO2−4 was mainly below 1µg m−3 and that of NH+4 was all the time below 1µg m−3. The NO−3 concen- tration was slightly lower than the NH+4 concentration. The concentration of BC varied between 0.01 and 100µg m−3and volume concentration of particles varied mostly be-
5
tween 0.1 and 10µm3cm−3in this region. The concentrations of SO24−, NO−3 and NH+4 were typically one to two orders of magnitude lower in this region as compared with the high-concentration region.
3.5.3 Forest fire episodes
On the way to Vladivostok, between 5925–7064 km from Moscow, the concentration
10
of levoglucosan was extremely high in the VI sample. At the same area, there were three simultaneous temporary high concentration levels of oxalate and potassium in the PILS measurements (Fig. 11). Oxalate and potassium as well as levoglucosan have been used as biomass combustion tracers, (Simoneit et al., 1999). Of these, the only specific tracer of biomass combustion particles is levoglucosan which is formed
15
in the thermal breakdown of cellulose (Fraser and Lakshmanan, 2000). In addition to biomass combustion, potassium can be derived from soil, whreas oxalate can be formed in the atmosphere from hydrocarbons or be emitted by other primary sources.
Different types of man-made or wildfires (e.g. forest fires, agricultural waste combus- tion, flaming, smoldering) have different emission profiles (Conny and Slater, 2002), in
20
addition to which the chemical composition of emitted particles may be changed during their transportation in the atmosphere.
In a wildfire map based on the observations of the MODIS satellite (http://modis.
gsfc.nasa.gov/), forest fires were observed over large areas near the locations with high concentrations of oxalate and potassium. The concentrations of BC, sulphate and
25
total particle volume were elevated at the same time with biomass combustion tracers, but to different extents (Fig. 11). We could also observe temporary high concentration
ACPD
7, 7473–7508, 2007
Aerosol chemistry between Moscow and
Vladivostok S. Kuokka et al.
Title Page Abstract Introduction Conclusions References
Tables Figures
◭ ◮
◭ ◮
Back Close
Full Screen / Esc
Printer-friendly Version Interactive Discussion
EGU levels of potassium, black carbon, sulphate and particle volume that did not coincide
with the high oxalate concentrations. These differences in the composition of biomass combustion particles may be due to differences in burning conditions. BC and potas- sium are emitted to larger extent from flaming fires compared with smoldering fires, whereas oxalate is emitted preferably from smoldering fires.
5
4 Summary and conclusions
Aerosol chemical and physical measurements were made at the Trans-Siberian railway in Russia in October, 2005. Concentrations of BC, aerosol ions and particle volume were measured using continuously-measuring devices for fine particles (<2.5µm di- ameter). In addition, 24-h samples were collected using a virtual impactor for mass
10
concentration determination and chemical analysis. The concentrations of measured chemical components in aerosol particles varied largely during the journey. Due pri- marily to local anthropogenic sources, the areas around the route of the Trans-Siberian railway were heavily polluted between Moscow and roughly 4000 km east of it, as well as in the eastern part of the route close to Vladivostok. In the middle of the
15
route observed concentrations were typically low, even though there were local particle sources, such as forest fires, that increased particulate matter concentrations occa- sionally. The polluted air masses from Asia seem to have significant influences on the concentration levels of fine particles over the south-eastern Russia.
The mass concentrations of PM2.5 from the VI samples varied in the range 4.3–
20
34.8µg m−3 with an average of 21.6µg m−3. These concentrations are comparable to those observed in Europe and North America, but considerable lower than con- centrations measured in major Asian cities. Fine particles consisted mainly of BC (average 27.6%), SO2−4 (13.0%), NH+4 (4.1%) and NO−3 (1.4%). Trace metals together accounted for 0.4–9.8% of the fine particulate mass. The fraction of monosaccharide
25
anhydrides was usually in the range of 0.4–1.6%, but in one sample (5926–7064 km from Moscow) on the way to Vladivostok it was substantially elevated (4%) indicative of
ACPD
7, 7473–7508, 2007
Aerosol chemistry between Moscow and
Vladivostok S. Kuokka et al.
Title Page Abstract Introduction Conclusions References
Tables Figures
◭ ◮
◭ ◮
Back Close
Full Screen / Esc
Printer-friendly Version Interactive Discussion
EGU forest fire emissions. The measured chemical components accounted for 27.7–78.5%
of the PM2.5 mass. The remaining fraction consisted very likely of organic particulate matter and some water, not quantified in our chemical analyses. The contribution of BC to PM2.5was much higher compared with other studies in Europe and in Asia.
On the way back to Moscow, the concentrations of ions, BC and particle volume were
5
at high levels over large distances (7400–8800 km from Moscow). The high concen- trations were mainly due to long-range-transported aerosol particles from China. The lowest ion concentrations were measured in mid-Siberia (4000–7200 km from Moscow) on the way back to Moscow. This is a rural area with few local pollution sources. In addition to ions, the concentrations of BC and particle volume were at low levels in this
10
area. On the way to Vladivostok (5925–7064 km from Moscow), the concentration of levoglucosan was extremely high. In the same region, there were simultaneous tem- porary high concentration levels of oxalate, potassium and BC. In a wildfire map based on the observations of the MODIS satellite, the forest fires were observed over large areas close to the location in which oxalate, potassium and BC concentrations were at
15
high levels.
Since a moving laboratory was used, measurements with a high time resolution gave more valuable information about the variability of concentrations during the journey than the traditional filter-based sampling methods. From on-line measurements it was possible to see temporary high concentration levels and exact locations of the events,
20
such as forest fires or passing through industrial areas, which can not be seen from 24- h VI samples. We also found evidence that evaporation of nitrate from the PTFE filters had been taking place during the samplings. The concentration of nitrate was higher in the high time resolution measurements compared with the VI measurements and large amounts of nitrate was found in the nylon backup filters. The evaporation seemed to
25
be highest in the sample with highest concentration of sulphate, which is expected because the aerosol acidity increases evaporation. The extent of nitrate evaporation may have been enhanced because of the use of denuders upstream of the sampling line.
ACPD
7, 7473–7508, 2007
Aerosol chemistry between Moscow and
Vladivostok S. Kuokka et al.
Title Page Abstract Introduction Conclusions References
Tables Figures
◭ ◮
◭ ◮
Back Close
Full Screen / Esc
Printer-friendly Version Interactive Discussion
EGU Acknowledgements. This study was funded by the Academy of Finland (Program “Russia in
Flux”), grant no. 208208. The TROICA expedition was partly funded by the ISTC Project #2773.
References
Cao, J. J., Lee, S. C., Ho, K. F., Zou, S. C., Fung, K., Li, Y., Watson, J. G., and Chow, J.
C.: Spatial and seasonal variations of atmospheric organic carbon and elemental carbon in
5
Pearl River Delta Region, China, Atmos. Environ., 38, 4447–4456, 2004.
Conny, J. M. and Slater, J. F.: Black carbon and organic carbon in aerosol particles from crown fires in the Canadian boreal forest, J. Geophys. Res., 107, D11, doi:10.1029/2001JD001528, 2002.
Crutzen, P. J., Elansky, N. F., Hahn, M., Golitsyn, G. S., Brenninkmeijer, C. A. M., Scharffe,
10
D. H., Belikov, I. B., Maiss, M., Bergamaschi, P., R ¨ockmann, T., Grisenko, A. M., and Sevostyanov, V. M.: Trace gas measurements between Moscow and Vladivostok using Trans-Siberian railroad, J. Atmos. Chem., 29(2), 179–194, 1998.
Hansen, A. D. A., Rosen, H., and Novakov, T.: The aethalometer: an instrument for the real- time measurement of optical absorption by aerosol particles, Sci. Tot. Environ., 36, 191–196,
15
1984.
Fraser, M. P. and Lakshmanan, K.: Using levoglucosan as a molecular marker for the long range transport of biomass combustion aerosols, Environ. Sci. Technol., 34, 4560–4564, 2000.
Jalkanen, L. M. and H ¨as ¨anen, E. K.: Simple method for the Dissolution of atmospheric aerosol
20
samples for analysis by inductively coupled plasma mass spectrometry, J. Anal. Atmos.
Spectrom., 11, 365–369, 1996.
Kim Oanh, N. T., Upadhyay, N., Zhuang, Y-. H., Hao, Z.-P., Murthy, D. V. S., Lestari, P., Villarin, J. T., Chengchua, K., Co, H. X., Dung, N. T., and Lindgren, E. S.: Particulate air pollution in six Asian cities: Spatial and temporal distributions, and associated sources, Atmos. Environ.,
25
40, 3367–3380, 2006.
Loo, B. W. and Cork, C. P.: Development of high efficiency virtual impactor, Aerosol Sci. Tech- nol., 9, 167–170, 1988.
Ma, Y. Weber, R. J., Maxwell-Meier, K., Orsini, D. A., Lee, Y.-N., Huebert, B. J., Howell, S.
G., Bertram, T., Talbot, R. W., Dibb, J. E., and Scheuer, E.: Intercomparisons of airborne
30
ACPD
7, 7473–7508, 2007
Aerosol chemistry between Moscow and
Vladivostok S. Kuokka et al.
Title Page Abstract Introduction Conclusions References
Tables Figures
◭ ◮
◭ ◮
Back Close
Full Screen / Esc
Printer-friendly Version Interactive Discussion
EGU measurements of aerosol ionic chemical composition during TRACE-P and ACE-Asia, J.
Geophys. Res., 109, D15S06, doi:10.1029/2003JD003673, 2004.
National Atmospheric Emissions Inventory (NAEI): UK Emissions of Air Pollutants 1970 to 2001, National Environmental Technology Centre, Abington, UK, available at: http://www.
airquality.co.uk/archive/reports/cat07/naei report 1970-2001.pdf, 2003.
5
Oberlander, E., Brenninkmeijer, C. A. M., Crutzen, P. J., Elansky, N. F., Golitsyn, G. S., Granberg, I. G., Scharffe, D. H., Hofmann, R., Belikov, I. B., Paretzke, H. G., and Velthoven, P.
F. J.: Trace gas measurements along the Trans-Siberian railroad: The TROICA 5 expedition, J. Geophys. Res., 107(D14), 4206, doi:10.1029/2001JD000953, 2002.
Orsini, D., Ma, Y., Sullivan, A., Sierau, B., Baumann, K., and Weber, R.: Refinements to the
10
particle-into-liquid sampler (PILS) for ground and airborne measurements of water soluble aerosol composition, Atmos. Environ., 37, 1243–1259, 2003.
Penner, J. E., Quaas, J., Storelvmo, T., Takemura, T., Boucher, O., Guo, H., Kirkev ˚ag, A., Kristjansson, J. E., and Seland, Ø.: Model intercomparison of indirect aerosol effects, Atmos.
Chem. Phys. 6, 3391–3405, 2006.
15
Pinto, J. P., Lefohn, A. S., and Shadwick, D. S.: Spatial variability of PM2.5in urban areas in the united states, J. Air Waste Manage, 54, 440–449, 2004.
Pope III, C. A. and Dockery, D. W.: Health effects of fine particulate air pollution: Lines that connect, J. Air Waste Manage. Assoc. 56, 709–742, 2006.
Putaud, J.-P., Raes, F., Van Dingenen, R., Br ¨uggemann, E., Facchini, M.-C., Decesari, S.,
20
Fuzzi, S., Gehrig, R., H ¨uglin, C, Laj, P., Lorbeer, G., Maenhaut, W., Mihalopoulos, N., M ¨uller, K., Querol, X., Rodriguez, S., Schneider, J., Spindler, G., Ten Brink, H., Tørseth, K., and Wiedensohler, A.: A European aerosol phenomenology – 2: chemical characteristics of particulate matter at kerbside, urban, rural and background sites in Europe, Atmos. Environ., 38, 2579–2595, 2004.
25
Querol, X., Alastuey, A., Ruiz, C. R., Arti ˜nano, B., Hansson, H. C., Harrison, R. M., Buringh, E., ten Brink, H. M., Lutz, M., Bruckmann, P., Strael, P., and Schneider, J.: Speciation and origin of PM10 and PM 2.5 in selected European cities, Atmos. Environ., 38, 6547–6555, 2004.
Ramanathan, V., Crutzen, P. J., Kiehl, J. T., and Rosenfeld, D.: Aerosols, climate, and the hydrological cycle, Science, 294, 2119–2124, 2001.
30
Saarikoski, S., M ¨akel ¨a, T., Hillamo, R., Aalto, P., Kerminen, V.-M., and Kulmala, M.: Physico- chemical characterization and mass closure of size segregated atmospheric aerosols in Hyyti ¨al ¨a Finland, Boreal Environ. Res., 10, 385–400, 2005.