ACPD
6, 12389–12431, 2006Chemical characterization of inorganic aerosols in
Athens
E. T. Karageorgos et al.
Title Page
Abstract Introduction
Conclusions References
Tables Figures
◭ ◮
◭ ◮
Back Close
Full Screen / Esc
Printer-friendly Version
Interactive Discussion
Atmos. Chem. Phys. Discuss., 6, 12389–12431, 2006 www.atmos-chem-phys-discuss.net/6/12389/2006/ © Author(s) 2006. This work is licensed
under a Creative Commons License.
Atmospheric Chemistry and Physics Discussions
Chemical characterization of the
inorganic fraction of aerosols and
mechanisms of the neutralization of
atmospheric acidity in Athens, Greece
E. T. Karageorgos1, S. Rapsomanikis1, and P. W ˚ahlin2
1
Laboratory of Atmospheric Pollution and Pollution Control Engineering, Faculty of
Engineering, Department of Environmental Engineering, Democritus University of Thrace, P.O. Box 447, 67100 Xanthi, Greece
2
Department of Atmospheric Environment, NERI, Frederiksborgvej 399, P.O.Box 358, 4000 Roskilde, Denmark
Received: 31 July 2006 – Accepted: 22 November 2006 – Published: 1 December 2006
Correspondence to: E. T. Karageorgos (vkarageo@env.duth.gr)
ACPD
6, 12389–12431, 2006Chemical characterization of inorganic aerosols in
Athens
E. T. Karageorgos et al.
Title Page
Abstract Introduction
Conclusions References
Tables Figures
◭ ◮
◭ ◮
Back Close
Full Screen / Esc
Printer-friendly Version
Interactive Discussion Abstract
Mass concentration levels and the inorganic chemical composition of PM10 (two
frac-tions; PM10−2.5 and PM2.5) were determined during August 2003 and March 2004,
in the centre of Athens, Greece. August 2003 monthly mean PM10 mass
concentra-tion, at 5 m above ground, was 56µg/m3 and the EU imposed daily limit of 50µg/m3
5
was exceeded on 16 occasions. The corresponding monthly mean for March 2004
was 92µg/m3and the aforementioned daily limit was exceeded on 23 occasions. The
PM10 (PM10−2.5+PM2.5) mass concentrations at 1.5 m above ground were found to be
approximately 20% higher compared to the respective PM10 measured at 5 m.
Conse-quently, for a realistic estimation of the exposure of citizens to particulate matter, PM10
10
sampling at a height of 1.5–3 m above ground, in the “breathing zone” is necessary. Such data are presented for the first time for the centre of Athens. In both campaigns, calcium was found to be the predominant component of the coarse fraction while crust-related aluminosilicates and iron were found to be the other major components of the same fraction. The above elements constitute the most important components of the
15
fine fraction, together with the predominant sulphur. Toxic metals were found to be below the air quality limits and in lower concentrations compared to older studies, with the exception of Cu and V for which some increase was observed. Pb, in particular, appeared mostly in the fine fraction and in very low concentrations compared to studies dating more than a decade back. The major ions of the coarse fraction have been found
20
to be Ca2+, NO−3 and Cl−, while SO4−2, Ca2+and NH+4 were the major ionic components
of the fine fraction. The low molar ratio of NH+4/SO−42indicated an ammonium-poor
am-bient air, where atmospheric ammonia is not sufficient to neutralize all acidity and the
formation of NH4NO3 does not occur to a significant extend. Calcium predominated
the coarse fraction and its good correlations with NO−3 and SO−42 indicated its role as
25
an important neutralizing agent of atmospheric acidity in this particle size range. In the
fine fraction, both Ca2+ and NH+4 participate in the neutralizing processes with NH+4
ACPD
6, 12389–12431, 2006Chemical characterization of inorganic aerosols in
Athens
E. T. Karageorgos et al.
Title Page
Abstract Introduction
Conclusions References
Tables Figures
◭ ◮
◭ ◮
Back Close
Full Screen / Esc
Printer-friendly Version
Interactive Discussion
was not found to occur to a significant extend. Total analyzed inorganic mass
(elemen-tal+ionic) was found to be ranging between approximately 25–33% of the total coarse
particle mass and 35–42% of the total fine particle mass.
1 Introduction
The concentration levels, chemical composition and physical properties of urban
5
aerosols depend on the nature of their emission sources, on their dispersion and on their subsequent chemical reactions that may take place in the atmosphere.
Throughout the last decades, a number of epidemiological studies have clearly demonstrated that aerosol pollution constitutes a potential hazard to citizens (Dockery and Pope, 1994; Touloumi et al., 1994; Katsouyanni et al., 1997; Katsouyanni et al.,
10
2001; Pope III et al., 2002; Peng et al., 2005). In relation to this, special attention has been drawn on the atmospheric pollution from particles in the “inhalable” size range,
PM10 and their finer, “respirable” fraction, PM2.5. The issue is of greater importance
when it refers to largely populated urban environments, where often, high particulate pollution phenomena are observed. An integral part of improving air quality in the EU
15
is the identification of the chemical composition and the principal sources of particulate
pollutants, so as to permit the most effective, source-targeting, control strategies.
Athens, Greece, has an estimated population of 4 million inhabitants. The city is built
in a 400 km2shallow valley, surrounded by moderate height hills to the north, west and
east and the Saronikos Gulf to the south and south west. The hills surrounding the area
20
are considered largely responsible for the poor dispersion conditions often observed in the city.
Traffic is considered as the major source of atmospheric pollution in the area. The
total number of vehicles circulating over the Greater Athens Area (GAA) exceeds 2 million. Of these, approximately 800 000 Light Duty Vehicles (LDV’s) are non-catalytic,
25
while ca. 100 000 Heavy Duty Vehicles (HDV’s) and taxies are diesel-powered. Other important causes of atmospheric pollution are considered to be industrial activity and
ACPD
6, 12389–12431, 2006Chemical characterization of inorganic aerosols in
Athens
E. T. Karageorgos et al.
Title Page
Abstract Introduction
Conclusions References
Tables Figures
◭ ◮
◭ ◮
Back Close
Full Screen / Esc
Printer-friendly Version
Interactive Discussion
winter-heating. Major heavy industries are located West and North West of the city, outside the valley.
Particulate matter pollution in Athens and the GAA has been the subject of sev-eral studies carried out during the past 20 years. Among the studied parameters is the fractionation and spatio-temporal variation of PM mass concentrations in GAA
5
(Chaloulakou et al., 2003; Grivas et al., 2004), the concentrations of some toxic metals
in the PM (Scheff and Valiozis, 1990; Koliadima et al., 1998; Thomaidis et al., 2003;
Manalis et al., 2005) and of some ionic species in PM2.5 (Scheffand Valiozis, 1990;
Siskos et al., 2001) and in TSP (Eleftheriadis et al., 1998). In addition to the above, the monitoring network of the Ministry of Environment, Planning and Public Works, has
10
been modernized and since 2000 it is determining the mass concentration of PM10 as
well as the concentrations of a series of gaseous pollutants, on a daily basis.
While the aforementioned studies have aided in an understanding of the aerosol pol-lution in Athens, to a significant level, thorough knowledge of the chemical composition of the PM is still not existent. In addition to this, the governmental monitoring network
15
and the aforementioned studies, in their entirety, have entailed aerosol sampling car-ried out at heights ranging from 7 to 25 m from the ground. The present study aims to determine the concentrations and a more detailed inorganic chemical composition of the PM, not only at the aforementioned height levels, but also near the ground, in the “breathing zone” (Commission, 1999/30/EC), as this is indicative of the levels of
20
pollution to which thousands of citizens, moving in the centre of the city, are exposed on a daily basis.
The detailed objectives of the present study are, firstly, the determination of the in-organic chemical composition “fingerprint” of fine and coarse particles in the centre of Athens. Secondly, the comparison between the mass concentrations and
chemi-25
ACPD
6, 12389–12431, 2006Chemical characterization of inorganic aerosols in
Athens
E. T. Karageorgos et al.
Title Page
Abstract Introduction
Conclusions References
Tables Figures
◭ ◮
◭ ◮
Back Close
Full Screen / Esc
Printer-friendly Version
Interactive Discussion
variation of mass concentration and chemical composition of the PM in the centre of Athens. Lastly, the determination of the mechanisms through which the neutralization of atmospheric acidity takes place.
2 Experimental
2.1 Sampling
5
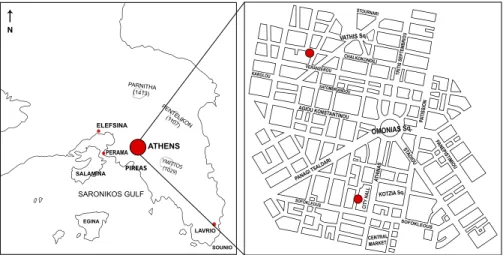
Aerosol sampling took place during two periods, the first between 7 and 27 August 2003 and the second between 8 and 28 March 2004. In both periods, sampling was
carried out at a site located behind the Athens City Hall, in Athinas Street (≈12 000
ve-hicles/day) (38◦02′N, 23◦44′E). Athinas St. normally has a constant traffic load, largely
due to the nearby Athens central market. At the time of the sampling periods, both in
10
August 2003 and especially in March 2004, a series of construction activities were tak-ing place at several points across Athinas St., due to the preparations for the Olympic
Games of 2004. This resulted in a significant reduction of the traffic load. The sampling
equipment on the first site consisted of a pair of Dichotomous Stack Filter Units (DSFU) (Luhana et al., 2001) for the collection of filter samples and a Particle Analyzer
measur-15
ing mass concentration by use of Beta-Attenuation (FH62I-R, ESM–Thermo Andersen; hereafter referred to as BAPA), also equipped with a reflectometer for the
determina-tion of Black Carbon. In March 2004, a Differential Mobility Particle Sizer (DMPS,
Neri Institute, Denmark) for the determination of ultra-fine particles concentrations and an Optical Particle Counter (OPC, LASAIR II 525, Particle Measuring Systems, USA)
20
were added to the sampling equipment. Additional sampling during March took place on the roof of a governmental building (AEDA) also in downtown Athens. Blocks of 4 to 6-storey buildings dominate the location. The distance between the two sampling sites is approximately 700 m and their exact locations are shown in Fig. 1. Sampling at AEDA took place by means of 2 DSFUs and a DMPS. The DSFU samplers’ inlets in
25
Athinas St. were set at a height of 1.5 m from the ground level and the OPC and DMPS
ACPD
6, 12389–12431, 2006Chemical characterization of inorganic aerosols in
Athens
E. T. Karageorgos et al.
Title Page
Abstract Introduction
Conclusions References
Tables Figures
◭ ◮
◭ ◮
Back Close
Full Screen / Esc
Printer-friendly Version
Interactive Discussion
inlets were set very near them. The Beta Attenuation Particle Analyzer inlet was set at a height of approximately 5 m from the ground level. In AEDA, the DSFU and DMPS sampling took place at a height of approximately 25 m above the street level.
Particles collected with the DSFUs were divided into two fractions; coarse, with an
aerodynamic diameter between 2.5µm and 10µm (hereafter referred to as CPM), and
5
fine, with an aerodynamic diameter smaller than 2.5µm (hereafter referred to as FPM).
Particles with an aerodynamic diameter greater than 10µm, were trapped on a lightly
greased pre-impactor surface, in the front part of the stack. Polycarbonate Membrane
filters (Whatman) with a pore-diameter of 12µm and 0.4µm were used for the
collec-tion of CPM and FPM respectively. In order to avoid bounce-offphenomena, 12-µm
10
filters were coated with a thin layer of Apiezon-L grease (Apiezon products, London, UK) (Harrison et al., 1996). All filters were weighed on a micro balance with an
accu-racy of 10µg (Scaltec SBC22), before and after sampling, thus allowing the calculation
of gravimetrical CPM and FPM concentrations. Prior to being weighed, filters were kept
under stable environmental conditions (RH:∼20%, T=18◦C) in vacuum desiccators for
15
24 h. Every sampling day was divided into two periods; a morning period from 07:00 to 19:00 and an evening period from 19:00 to 07:00, to record the within-a-day variability of the contributing sources emissions throughout the campaign. Field blanks were col-lected at the beginning and the end of the sampling periods by placement of filters in the DSFU samplers for a complete sampling session (12 h) without air being sampled.
20
For an estimation of the precision of the flow control/measurement in the pairs of DSFUs, the volumes of air sampled with each sampler were regressed to one another
and the relationship between them was found to be y=0.988·x-0.018 (R2=0.97). The
relationship between the respective sampled masses of particulate matter, with the two
samplers was found to be described by the equation: y=0.965·x+1.03 (R2=0.96).
25
ACPD
6, 12389–12431, 2006Chemical characterization of inorganic aerosols in
Athens
E. T. Karageorgos et al.
Title Page
Abstract Introduction
Conclusions References
Tables Figures
◭ ◮
◭ ◮
Back Close
Full Screen / Esc
Printer-friendly Version
Interactive Discussion
cases, as the change of filters in the evening was not possible, the sampling sessions in AEDA were necessarily 24-h long, which again resulted in the breaking of some FPM filters.
Meteorological data including wind speed and direction, relative humidity,
temper-ature and solar radiation, as well as major urban gas-pollutants concentrations (O3,
5
NO+NO2, CO, SO2), were obtained from the Hellenic Ministry of Environment. The
meteorological stations were located in central parts of Athens, close to Athinas St. and AEDA.
2.2 Extraction and analysis
The use of two DSFUs in each of the sites, made it possible to obtain pairs of virtually
10
equally loaded (“twin”) filters for every sampling session. One of the “twin” filters was analyzed by Proton Induced X-Ray Emission (PIXE) in Denmark (NERI) for
identifica-tion and quantificaidentifica-tion of 24 metal species with an atomic number>12. The second
of the “twin” filters was analyzed for quantification of major anions (NO−3, PO34−, SO24−,
Cl−) and cations (Na+, NH+4, K+, Mg2+, Ca2+) in the water soluble fraction, by Ion
15
Chromatography (IC), in the Laboratory of Atmospheric Pollution and Pollution Con-trol Engineering (Department of Environmental Engineering, Democritus University of Thrace). In August 2003 ionic concentrations were not measured.
2.2.1 Elemental analysis
Elemental analysis was carried out by PIXE in accordance to the ISO 17025 standard
20
(DANAK, Danish Accreditation no. 411). A calculation of the absolute standard devi-ation for each PIXE-analysed element is incorporated in the fit of the x-ray spectrum. The uncertainties and detection limits depend on the number of x-ray counts, the thick-ness of the filter material (due to the continuous spectral background), its purity and the matrix (interferences from neighbour spectral peaks). Table 1 shows detection limits
25
for typical ambient air samples on mixed cellulose ester filters, using a proton radiation
ACPD
6, 12389–12431, 2006Chemical characterization of inorganic aerosols in
Athens
E. T. Karageorgos et al.
Title Page
Abstract Introduction
Conclusions References
Tables Figures
◭ ◮
◭ ◮
Back Close
Full Screen / Esc
Printer-friendly Version
Interactive Discussion
time of approximately 20 min per sample. The detection limit value is either the average standard deviation of the values in a series of blanks, or the standard deviation of the blank values, depending on which is the largest. PIXE detection limits are estimated as mass per area. The uncertainty of the integrated proton charge and fluctuations of the detector solid angle give rise to an additional standard deviation of 5%, which is
5
geometrically added to the spectral uncertainty. The calibration is permanent and is regularly controlled. The calibration uncertainty for all elements is 7% on average and, as a result of the above, far from the detection limit the average accuracy is on average 9% for all elements (the geometric sum of 5% and 7%). For semi-thick samples, which need correction for x-ray self-absorption, a non-stratified (homogeneous) mixture of
el-10
ements is assumed in the mass-per-area calculation. An extra uncertainty is included due to the possible stratification of the sample. Individual uncertainties have been cal-culated for every compound and every sample of the campaign. The quantification of Cl is not considered very reliable, because a percentage of HCl is lost, during the PIXE analysis. The maximum possible loss of Cl is the equivalent quantity of sampled acidic
15
compounds (organic acids, H2SO4, HSO
−
4 and NH
+
4).
2.2.2 Ions analysis
A Dionex Chromatograph (DX-500) with an AS-9HC column for anions and a CS12 col-umn for cations were used for the ions analysis. An ASRS-Ultra II and a CSRS-Ultra suppressors, working in Auto-Recycle mode, were employed for the eluent
suppres-20
sion. All solid filter samples to be analyzed by IC were kept in a closet, under controlled
room temperature (18◦C) until the day of extraction. Extraction in Deionized Water
(18.2·MΩ·cm−1) was done by 10-min vigorous shaking and 30-min ultrasonication and
in batches of 20 filters. Three “laboratory blanks” were also prepared with every batch and analyzed together with field samples to check for potential in-laboratory
contam-25
ination. All filter extracts were kept in freezer (–18◦C) until analysis, when they were
ACPD
6, 12389–12431, 2006Chemical characterization of inorganic aerosols in
Athens
E. T. Karageorgos et al.
Title Page
Abstract Introduction
Conclusions References
Tables Figures
◭ ◮
◭ ◮
Back Close
Full Screen / Esc
Printer-friendly Version
Interactive Discussion
3 standard deviations (3σ) of the blank (Miller and Miller, 1993). Calibration accuracy
was continuously monitored by analyses of calibration-verification standards; the un-certainty was at maximum 5%. The calibration verification standards were obtained
from a commercial source (Alltech) different to the one of the calibration standards
(Dionex). Reproducibility (precision) was calculated by 7 injections of a standard with
5
concentrations approximately in the middle of the calibration range; the Relative Stan-dard Deviation (RSD) was within 3% for all compounds of interest. To check for matrix
effects, the standard additions method was carried out on every 10th sample and the
discrepancy between measured and calculated value was≤3%.
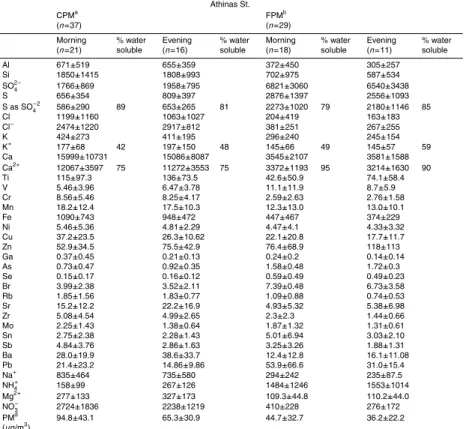
3 Results and discussion 10
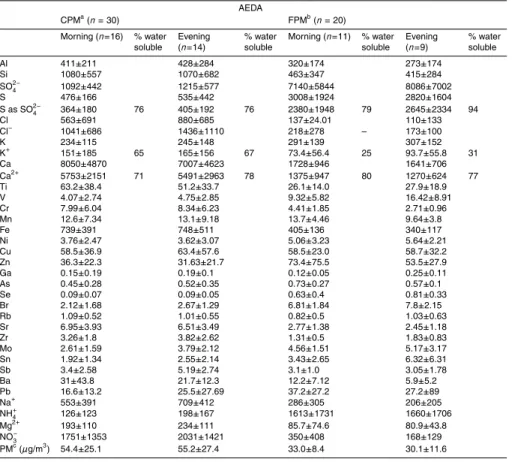
Table 2 presents arithmetic means and standard deviations of the concentrations of elements measured in August 2003. Morning and evening values are presented sep-arately as this may demonstrate, on a preliminary level, trends in the “within-a-day” variation of concentrations. Ionic species and gravimetrically determined PM were not measured during this campaign due to a technical problem. In Tables 3 and 4, the
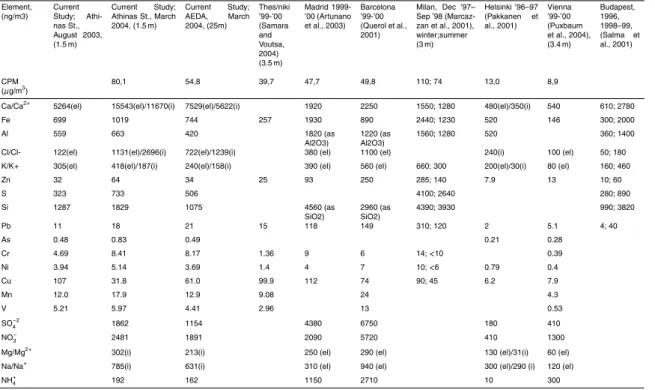
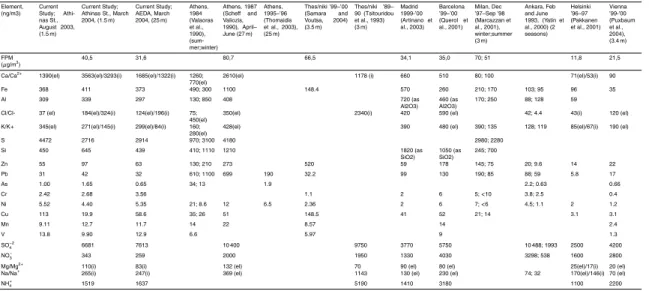
15
March 2004 results are presented in a similar manner. The water soluble percentage column, represents the ratio of the water soluble, ionic concentration to the respective elemental. Tables 5a and b present our campaigns total arithmetic means for elements and ions of major interest, next to respective results of previous studies carried out in Athens, in other cities of Greece and other urban centres of the world.
20
3.1 August 2003
3.1.1 Identification of major elements, distribution in the two fractions and comparison
of concentrations with air quality limits
During the August 2003 traffic in downtown Athens was reduced due to the summer
vacations. In relation to that, an increase in the measured BAPA-PM10 concentrations
25
ACPD
6, 12389–12431, 2006Chemical characterization of inorganic aerosols in
Athens
E. T. Karageorgos et al.
Title Page
Abstract Introduction
Conclusions References
Tables Figures
◭ ◮
◭ ◮
Back Close
Full Screen / Esc
Printer-friendly Version
Interactive Discussion
was observed towards the end of the month, after the end of the DSFU sampling, when the greatest percent of the population returned from vacations. On the other hand, dur-ing the campaign and throughout the year until the summer of 2004, construction work was taking place in the centre of the city. The meteorological conditions were typical of Athens in the middle of summer and were characterized by low relative humidity (daily
5
mean: 42.7%; min: 24.0%), high temperatures (daily mean: 30.8◦C; min: 24.1◦C; max:
38.1◦C) and low wind speed (daily mean: 2.7 km/h; min: 0.4 km/h).
Measured BAPM10concentrations shown in Table 2 (min: 38µg/m
3
; max: 90µg/m3)
signify the aerosol pollution problem in GAA, which has already been identified in other studies (Chaloulakou et al., 2003; Grivas et al., 2004; Manalis et al., 2005). Mean
10
daily PM10values on the site exceeded on 16 occasions the E.U. imposed 24-h limit of
50µg/m3, which is not to be exceeded more than 35 times a year (limit to be met by
January 2005). The predominant element of the CPM is Ca. Other major elements in the fraction include Al, Si and Fe. Oxides of these compounds are found in crustal rock, hence a part of their concentrations is probably related to dust/particle re-suspension.
15
It is worth noting that their evening concentrations do not appear significantly lower compared to the morning ones. Other important components of this fraction are also S, K, Cu and Zn. The aforementioned elements are the most important components of the FPM fraction as well, with S being, in this case, predominant. The biggest part of Ca, Al, Si and Fe is found in the CPM, which is in agreement with other studies
20
for the eastern Mediterranean (Graham et al., 2004; Kouyoumdjian and Saliba, 2006). S and Zn are higher in the FPM, and Cu is found on similar levels in both fractions. A “trend” of the prevalence of evening over morning values for FPM S, and Cu in both fractions is worth mentioning, as well as the fact that the concentration of the
latter has demonstrated an increase compared to older studies (Scheff and Valiozis,
25
1990). Both the above elements are traffic related. Pb is mainly found in FPM and
its concentration in Athens has been greatly reduced in the last 20 years. Automotive fuel in Greece does no longer contain lead compounds. In this study, as well as in
ACPD
6, 12389–12431, 2006Chemical characterization of inorganic aerosols in
Athens
E. T. Karageorgos et al.
Title Page
Abstract Introduction
Conclusions References
Tables Figures
◭ ◮
◭ ◮
Back Close
Full Screen / Esc
Printer-friendly Version
Interactive Discussion
Pb is found to be significantly lower than the EU imposed annual limit of 500 ng/m3,
and lower by an order of magnitude or more, compared to measurements dating a decade back (Thomaidis et al., 2003). Arsenic concentration is almost double and Nickel slightly higher in the FPM, compared to the CPM, and their concentrations on the site were also found to be significantly lower than the EU proposed mean annual limits
5
of 6 ng/m3 and 20 ng/m3 respectively. Mn is found on similar levels in both fractions
and its concentrations are lower by an order of magnitude compared to the
WHO-annual tolerance concentration of 150 ng/m3. V is found mostly in the FPM with a
trend for higher values in the evening and its concentrations have in all cases been by
two orders of magnitude, or more, lower than the proposed 24-h threshold of 1µg/m3
10
(WHO, 2000). Ba and Cr are found at significantly higher levels in the CPM with the concentrations of the later to have increased significantly in the last decade.
3.2 March 2004
3.2.1 The difference between 1.5 m and 25 m above ground for PM-mass and
com-pound concentrations
15
For the March 2004 campaign, gravimetrically measured CPM and FPM mass con-centrations, are shown in Tables 3 and 4, for Athinas St. and AEDA respectively. For
Athinas St. BAPM10mass concentrations are also shown in Table 3. In this site at 1.5 m
from the ground, the PM10(CPM+FPM) daily mean concentration was 121µg/m
3 (daily
max: 242µg/m3), with individual PM10−2.5 and PM2.5 concentrations being 80 and
20
40.5µg/m3 respectively. In the second site (AEDA), at 25 m from the ground, the
re-spective daily mean concentration for the PM10 was 86µg/m3 (daily max: 158µg/m3),
with individual PM10−2.5and PM2.5concentrations being 55 and 32µg/m
3
respectively.
In Athinas St., at 5 m from the ground, the BAPM10 daily mean concentration was
92µg/m3 (daily max: 133µg/m3). The meteorological conditions were again typical
25
of the season for the city, with moderate relative humidity (daily mean: 63.4%; min:
ACPD
6, 12389–12431, 2006Chemical characterization of inorganic aerosols in
Athens
E. T. Karageorgos et al.
Title Page
Abstract Introduction
Conclusions References
Tables Figures
◭ ◮
◭ ◮
Back Close
Full Screen / Esc
Printer-friendly Version
Interactive Discussion
49.2%; max: 79.1%), temperatures (daily mean: 14.6◦C; min: 10.8◦C; max: 17.9◦C)
and low wind speed (daily mean: 3.0 km/h; min: 1.6 km/h; max: 5.2 km/h).
The PM10concentrations measured by BAPA (BAPM10) at 5 m from the ground level,
in Athinas St., are significantly lower than the gravimetrical DSFU-PM10(calculated as
the sum: CPM+FPM) concentrations measured at a height of 1.5 m from the ground
5
level, in the same site. Comparative results are shown in Table 6a and Fig. 4a.
Ex-amination of the morning and evening values in Table 3, for BAPM10 and DSFU-PM10
shows that the morning mass concentrations are generally significantly higher than the evening ones. It is also shown that morning CPM mass concentrations are ap-proximately 30% higher than the evening CPM concentrations, while the respective
10
difference for the FPM fraction is approximately 22%. Roughly 35% of the particulate
mass is found in FPM and 65% in CPM in Athinas St.
The DSFU-PM10daily mean mass concentration in Athinas St. is significantly higher
than the gravimetrical DSFU-PM10 daily mean measured in AEDA, at a height of
ap-proximately 25 m from the ground level. A comparison between the DSFU-PM10 in
15
Athinas and the DSFU-PM10 in AEDA is shown in Table 6b and Fig. 4b. This
compar-ison of the concentrations shows that the PM mass concentrations obtained at 25 m from the ground are significantly lower than the ones at 1.5 m from the ground. More specifically, the morning Athinas St. CPM mass concentrations are approximately 43%
higher than the respective in AEDA. The difference for the morning FPM
concentra-20
tions is approximately 28%. Respective evening differences are 26% and 17% for the
CPM and FPM respectively. There is a significant increase in the CPM mass concen-trations during the morning (07:00–19:00) in Athinas St., which could be attributed to
the extensive contribution by construction, traffic and overall human activity. One may
argue that this “morning-contribution”, which, as discussed below, consists mainly of
25
ACPD
6, 12389–12431, 2006Chemical characterization of inorganic aerosols in
Athens
E. T. Karageorgos et al.
Title Page
Abstract Introduction
Conclusions References
Tables Figures
◭ ◮
◭ ◮
Back Close
Full Screen / Esc
Printer-friendly Version
Interactive Discussion
FPM concentrations, c) the discrepancy between the PM10 at 1.5 m and at 5 m from
the ground in Athinas St., and d) the discrepancy of the maximum concentrations for
the three sampling points (Tables 6a and b), shows that PM10 concentrations
signifi-cantly increase the closer one gets to the ground, near the “breathing zone”. This is in agreement with the findings of another study for Beijing (Chan et al., 2005).
5
AEDA DSFU-PM10 mass concentrations are very close to the respective PM10
val-ues of other studies for the same period (Valavanidis et al., 2006), which also entailed measurements at a height of 25 m from the ground level, in a nearby to AEDA loca-tion. Daily CPM and FPM mass concentrations as well as the distribution of PM mass
between the two fractions in AEDA (∼63% in the CPM and∼37% in the FPM) are also
10
very close to the ones of the aforementioned study. In addition to the above, the AEDA
DSFU-PM10 are reasonably close to the results of other recent studies (Chaloulakou
et al., 2005; Manalis et al., 2005), for the years 2001–2003 where measurements were again taken at storey levels, at approximately 7 m from the ground, or
building-roof levels, approximately 25 m from the ground. The above support that PM10
con-15
centrations appear significantly higher close to the ground, near the “breathing zone”, compared to the ones measured at higher elevations, which have been presented for
the centre of the city to-date. The differences in mass concentrations between these
elevations (5, 7 and 25 m) appear to be significantly higher for the heavier CPM and for daytime hours when activity in the centre reaches its peak.
20
3.2.2 Identification of major elements and ions, distribution in the two fractions and
comparison of concentrations with air quality limits
Following the above findings, individual element and ions concentrations have been ex-amined for similar discrepancies between sampling sites and heights. For both sites, and both fractions, major components of the PM are the same as in the previous
cam-25
paign, with Ca being predominant in the CPM and aluminosilicates being predomi-nant. In the FPM, in AEDA S is the most abundant element, while near the ground, in Athinas St. site, Ca dominates this fraction also, with concentrations significantly
ACPD
6, 12389–12431, 2006Chemical characterization of inorganic aerosols in
Athens
E. T. Karageorgos et al.
Title Page
Abstract Introduction
Conclusions References
Tables Figures
◭ ◮
◭ ◮
Back Close
Full Screen / Esc
Printer-friendly Version
Interactive Discussion
higher than the ones of AEDA. Previous publications have mentioned the existence of great amounts of Ca in the atmosphere of locations in Greece (Danalatos and Glavas,
1995), and in Athens, in particular (Scheffand Valiozis, 1990), as well as other eastern
Mediterranean sites (Graham et al., 2004; Kouyoumdjian and Saliba, 2006). The CPM concentrations of Ca, Al, Si, Fe and Ti are higher in Athinas St. A similar phenomenon
5
is observed for the respective FPM concentrations of these compounds, with the
ex-ception of Fe and Al for which FPM Athinas St. concentrations do not differ much from
the ones in AEDA. It is worth mentioning that, during this campaign, Cu was almost equally distributed in the two fractions, while its concentrations are lower than in the
previous campaign, especially in Athinas St. site. Traffic in Athinas St. might have not
10
been further reduced during the March 2004 campaign, compared to August 2003, hence the Cu seasonal variation has raised questions on the extend to which Cu in
downtown Athens is solely related to traffic and whether significant parts of it have
been connected with other emission sources as well. As expected, the greater part of Pb is found in the FPM fraction and its concentration remains very low compared to
15
the air quality limit and results of older studies. Moreover, in both fractions the Pb
con-centration between the two sites does not differ significantly. Nickel concentrations do
not differ much between the two sites and are generally equally distributed in the CPM
and FPM in Athinas St., while its concentrations appear slightly higher in FPM than in CPM in the AEDA site. Arsenic concentrations, on the other hand, appear higher in
20
Athinas St., while in both sites FPM values prevail over CPM. However, both As and Ni are found in concentrations much lower than the air quality limits, mentioned earlier in the text. Mn is another compound found in higher concentrations in Athinas St.. Its CPM values are higher than in the respective FPM in Athinas St., while in AEDA it is equally distributed in both fractions. Its levels remain at low levels compared to the
25
pre-mentioned air quality threshold. FPM V is again prevalent over CPM; AEDA values are higher than Athinas in the first fraction, while the reverse happens for the latter fraction. Ba and Cr concentrations are higher in the CPM than in the FPM with their
ACPD
6, 12389–12431, 2006Chemical characterization of inorganic aerosols in
Athens
E. T. Karageorgos et al.
Title Page
Abstract Introduction
Conclusions References
Tables Figures
◭ ◮
◭ ◮
Back Close
Full Screen / Esc
Printer-friendly Version
Interactive Discussion
in Athinas St., a trend for their morning values to be higher than their evening values is observed, while in AEDA the reverse is true, with the exception of CPM Cr for which morning and evening values are almost equal.
3.2.3 March 2004 – ionic concentrations
A known issue when sampling particulate matter for latter analysis of ionic species
5
is the sampling artefacts which may occur, particularly for ammonium, sulfate, nitrate and chloride. As will be further discussed below, the ambient molar particulate ratio of
NH+4/SO−42 has been found to be less than 1.5 (NH+4/SO−42≤1.35), which is indicative
of an ammonium poor atmosphere, where formation and consequent evaporation of
NH4NO3 is not favoured (Seinfeld and Pandis, 1998; Pathak et al., 2004; Trebs et al.,
10
2005). The absorption of SO2 on particles collected on filters, which could lead to
sulfate artefacts, has been found to be negligible for ammonium poor environments
(Pathak et al., 2004). In addition to that, the reactions of CaCO3, which in the Athenian
atmosphere is existent in great excess, with HNO3 and H2SO4 predominate over the
reactions of NaCl with HNO3 and H2SO4, as the first are significantly more rapid than
15
the latter. As a result of this, chloride depletion, via formation of HCl and evaporation to the gaseous phase, has not occurred but to a very limited extend. The mean ratios
of Cl−/Na+, which has been found to be 1.0≤Cl−/Na+≤1.1 (neq/m3) for the FPM and
1.6≤Cl−/Na+≤2.2 (neq/m3) for the CPM for the two sites, support the above conclusion.
Like with its elemental form, Ca2+ is predominantly found in the CPM, in which it
20
is by far the most abundant compound. A relatively big percentage of it is probably
found as CaCO3 due to the calcitic nature of the crustal rock in Greece. Similar with
Ca2+bimodal distribution is observed for NO−3 and Na+, as they are mainly found in the
CPM. For all of these ions, Athinas St. concentrations are higher than AEDA, for both
fractions with the exception of FPM Na+ for which concentrations in the two sites are
25
relatively close. The dominant compound in FPM is SO−42, which in this fraction is found
in slightly higher concentrations in AEDA. At the same time Athinas St. CPM SO−42is
ACPD
6, 12389–12431, 2006Chemical characterization of inorganic aerosols in
Athens
E. T. Karageorgos et al.
Title Page
Abstract Introduction
Conclusions References
Tables Figures
◭ ◮
◭ ◮
Back Close
Full Screen / Esc
Printer-friendly Version
Interactive Discussion
more than the respective in AEDA. The most of NH+4 is found in the FPM fraction
with AEDA values being slightly higher than the ones of Athinas St. A tendency for slightly higher concentrations of the compound in the evening for both fractions is also
observed. Lastly, Athinas St. Cl−is in both fractions higher than the respective in AEDA
with CPM values being more than double in the first site compared to the second.
5
The ratio of water soluble (ionic) concentration over the total elemental concentration has been calculated. Slightly higher than 70% of the CPM Ca appears to be water-soluble in both sites. In the FPM, this percentage for Athinas St. is somewhere near 90% while in AEDA it appears lower, around 80%. The greatest percentage of S is also water-soluble in both sites and both fractions, with the CPM ratios ranging from 75%
10
to 85% and the FPM ones from 79% to 94%. Similar findings have been reported for other locations in the eastern Mediterranean (Graham et al., 2004). In Athinas St., for
both fractions, on average 50% of K+ appears to be water soluble, while in AEDA the
respective percentages are 60% in the CPM and 30% in the FPM.
3.3 Seasonal variation; comparison between August 2003 and March 2004;
compar-15
ison with other studies in Athens and in other cities
A direct comparison of Athinas St. mean concentrations in the two campaigns is shown in Tables 5a and b. For most major elements and ions, the March 2004 concentrations in Athinas St. appear in both fractions significantly elevated compared to the respective ones of August 2003. Ca concentrations in both fractions, in March are more than
20
double compared to August. Two exceptions to the above are observed. The first is Al for which only a small increase is observed in March, for both fractions. The second is S, which appears higher in the CPM in March but significantly lower in the FPM compared to August. CPM S, Si, Mn, Cr, Pb and Zn are also higher in March, while, as mentioned above, the reverse is true for Cu. On the other hand, in March,
25
ACPD
6, 12389–12431, 2006Chemical characterization of inorganic aerosols in
Athens
E. T. Karageorgos et al.
Title Page
Abstract Introduction
Conclusions References
Tables Figures
◭ ◮
◭ ◮
Back Close
Full Screen / Esc
Printer-friendly Version
Interactive Discussion
connected to fossil fuel burning, is significantly higher in August 2003 in Athinas. In a similar manner, FPM Cu and V have also been found at higher concentrations during the August 2003 campaign.
In addition to the seasonal variation in the concentrations, in Tables 5a and b a com-parison of values measured during the current study with the ones of previous studies
5
in Athens and other cities is shown. The CPM Ca concentrations appear significantly higher than the values presented for Madrid, Barcelona and Milan which also have el-evated calcium concentrations. For other metals of crustal origin such as Fe, Al and Si, as well as some of the toxic metals such as Cr, Pb, Zn and Mn, values are on the same levels or lower to the values for the abovementioned cities. Similar is the case
10
for most ionic species in most fractions, with the exception of Na+, which appears in
higher concentrations than Madrid but lower than Barcelona. Concentrations in the CPM fraction are generally significantly higher than the ones reported for other cities to the North of Europe, like Vienna, Helsinki and Budapest.
In the FPM, the calcium concentrations are generally close to the ones measured in
15
Athens in the 80’s. The August ’03 S concentrations appear very close to the ones
pre-sented in an older study (Scheffand Valiozis, 1990), which entailed measurements in
the late spring and early summer. In this fraction, most other metals of crustal origin ap-pear in lower concentrations than the ones of the previous studies, and generally close
to the ones for the aforementioned Mediterranean cities. FPM SO−42 appears slightly
20
lower and NO−3 significantly lower than in past studies in Athens (Scheffand Valiozis,
1990), and Thessaloniki, Greece (Tsitouridou and Samara, 1993). The FPM SO−42, on
the other hand, is slightly higher than the values reported for Madrid, Barcelona and
Ankara while the FPM NO−3 appears significantly lower than the respective
concentra-tions for these cities.
25
ACPD
6, 12389–12431, 2006Chemical characterization of inorganic aerosols in
Athens
E. T. Karageorgos et al.
Title Page
Abstract Introduction
Conclusions References
Tables Figures
◭ ◮
◭ ◮
Back Close
Full Screen / Esc
Printer-friendly Version
Interactive Discussion
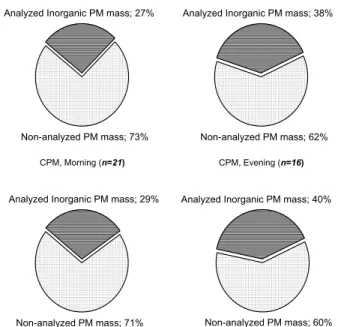
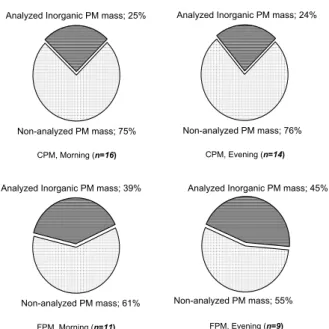
3.4 Analyzed inorganic versus total particulate mass
In Figs. 2 and 3 the analyzed inorganic mass against the total sampled particulate mass is presented separately for morning and evening, for both sites and both frac-tions. For the above calculations the mean individual masses of all compounds have been summed up. For the compounds that have been measured both in their
elemen-5
tal and ionic form though (e.g. Ca and Ca2+), only the elemental has been used, with
the exception of Cl/Cl− for which the ionic has been used, due to the aforementioned
issue of losses of Cl in the PIXE analysis. Moreover, sulphur has been determined in
its elemental form and as SO−42. Due to its higher molecular weight, SO−42constitutes
higher mass concentrations than sulphur. As a result of this, the ionic SO−42 mass
10
concentrations have been used in the pie calculations instead of the elemental S. This slightly underestimates the sulphur “contribution” to the slice of known chemical com-position in the pies, as it takes into account only the part of sulphur that is found as
SO−42. However, as the ratio [S as SO−42]/[S] has been found to range from 75% to 95%
and given the approximative character of this calculation, this underestimation is not
15
considered very important.
Analyzed CPM mass ranges from 24% to 27% of the total CPM mass, with the ex-ception of Athinas St. in the evening where the respective percent appears significantly higher (38%). While further examination of the contributing sources is needed, on a preliminary level this elevated values in the evening CPM in Athinas St. may be related
20
to the fact that, while CPM mass is significantly lower than in the morning CPM, the calcium concentrations, both elemental and ionic, remain at very high levels. The an-alyzed FPM mass ranges from 39% to 45% of the total FPM mass, with the exception of Athinas St. in the morning where this percentage appears lower at approximately
29%. Ions such as CO−3 and OH−, lighter elements that PIXE can not successfully
25
ACPD
6, 12389–12431, 2006Chemical characterization of inorganic aerosols in
Athens
E. T. Karageorgos et al.
Title Page
Abstract Introduction
Conclusions References
Tables Figures
◭ ◮
◭ ◮
Back Close
Full Screen / Esc
Printer-friendly Version
Interactive Discussion
these compounds usually constitute more than 50% of the urban aerosol mass.
3.5 Ionic balances and neutralization of atmospheric acidity
Strong correlations between the sum of nano-equivalent cations (Na+, NH+4, K+, Mg2+,
Ca2+) and the sum of nano-equivalent anions (Cl−, NO−3, SO24−) have been found for
both sites and both fractions (Fig. 5). However, as can be seen in the ionic balance
5
plots, a clear deficit of anions is observed in the CPM while in the FPM the anion/cation ratio is close to 1. The anionic deficit in the CPM is probably largely due to the hy-droxides, carbonates as well as carboxylic acids which are probably bound with the
excessive amounts of Ca2+ and are not analyzable by our method.
Atmospheric ammonia, in its NH+4 form, is found predominantly in FPM with its CPM
10
concentrations of NH+4 being very low. As a result of this, the quantities of NH+4 are
insufficient to completely neutralize the atmospheric acidity, which is in agreement
with older studies for Athens (Eleftheriadis et al., 1998), for other locations in Greece (Danalatos and Glavas, 1995), for other locations with similar crustal composition, in the eastern Mediterranean (Graham et al., 2004; Shaka and Saliba, 2004;
Kouyoumd-15
jian and Saliba, 2006), as well as for other parts of the world (Davis and Jixian, 2000; Pathak et al., 2004; Shaka and Saliba, 2004). Moreover, as stated above, the
ambi-ent molar particulate NH+4/SO−42 ratio has been found to be constantly less than 1.5.
This indicates an ammonium–poor ambient air, where the existing NH+4, is insufficient
to completely neutralize the available sulfate, existent as sulphuric acid, and the
for-20
mation of NH4NO3does not occur to a significant extend, since it would normally start
only after sulfate was consumed (Seinfeld and Pandis, 1998; Pathak and Chan, 2005; Trebs et al., 2005).
Water soluble calcium, on the other hand, predominates the CPM and is a major component of the FPM. The above, as well as the good correlation between CPM
25
Ca2+ and CPM NO−3 and SO−42 (Tables 7a and b), indicate that calcium containing
aerosols, originating from the calcium-rich soils in the region and the quick-lime exten-sively used in painting facades in Greece, are probably the most important neutralizing
ACPD
6, 12389–12431, 2006Chemical characterization of inorganic aerosols in
Athens
E. T. Karageorgos et al.
Title Page
Abstract Introduction
Conclusions References
Tables Figures
◭ ◮
◭ ◮
Back Close
Full Screen / Esc
Printer-friendly Version
Interactive Discussion
species in this fraction, on the surface of which acids like H2SO4 and HNO3 react to
form Ca(NO3)2and CaSO4. In the FPM fraction both Ca
2+ and NH+
4 appear to be
im-portant neutralizing agents of acidity. NH+4, which in this fraction is found in significant
concentrations, correlates very well with SO−42 and is probably its major neutralizing
agent, forming (NH4)2SO4 and NH4HSO4. The respective correlations between FPM
5
NO−3 (Tables 7a and b), which in FPM is found in low concentrations, and FPM NH+4
are low, which, as has already been stated, is reasonable as the formation of NH4NO3
is not expected to occur to a significant extend. The FPM NO−3, on the other hand
correlates well with Mg2+ and relatively well with Ca2+ which indicates that these two
ions are its neutralizing species, forming Mg(NO3)2and Ca(NO3)2. Strong correlations
10
have been observed between Na+ and Mg2+, Na+ and Cl− and Mg2+ and Cl−, which
indicates the existence of NaCl and MgCl2 salts. The above are in agreement with
the aforementioned studies for Greece (Tsitouridou and Samara, 1993; Danalatos and Glavas, 1995; Eleftheriadis et al., 1998), for the eastern Mediterranean (Graham et al., 2004; Kouyoumdjian and Saliba, 2006), as well as for cities in Asia (Davis and Jixian,
15
2000; Pathak et al., 2004; Xie et al., 2005).
3.6 An attempt to establish the fingerprint of inorganic aerosol pollution
In an attempt to graphically establish the fingerprint of the elemental composition of
PM10 aerosol in Athens, we compare our findings with globally averaged crustal
com-position (Fyfe, 1974), in Figs. 6a and b and in Figs. 7a and b. Although quantitative
20
comparisons are not possible since there exist no data on the pristine Athenian PM10
composition, this qualitative comparison indicates characteristic elemental and ionic peaks that are attributed to the geochemical characteristics of the area. For example, one could note Ca enrichment and Ga, Sr and Zr deficit. It could also be argued that S, Zn, Cu, Pb, Sn, Mo, As and Sb peaks can be attributed to fossil fuel burning and to
25
traffic related emissions (tyres, catalysts and brakes). In addition to this, it is shown that
ACPD
6, 12389–12431, 2006Chemical characterization of inorganic aerosols in
Athens
E. T. Karageorgos et al.
Title Page
Abstract Introduction
Conclusions References
Tables Figures
◭ ◮
◭ ◮
Back Close
Full Screen / Esc
Printer-friendly Version
Interactive Discussion
AEDA, indicating slightly stronger influence of traffic for this site. From the respective
ionic ratios (Figs. 7a and b) it can be derived that a big part of Cl− is found as NaCl
coming from the sea and that, especially in the CPM, an influence by some additional
non-marine source of Cl− is probably also present. The Mg2+/Na+ ratio appears very
close to the crustal average for the FPM fraction, which might be indicative of dust
5
contributions in this fraction. The same ratio appears close to the sea-water average for the CPM fraction which is in accordance to the aforementioned finding that a big
part of CPM Mg2+ is found as MgCl2originating from the sea. The SO−42/Na+ ratio for
both CPM and FPM appears significantly higher than the one of the sea-water which, given the fact that the earth’s crust is a negligible source of sulfates (Yaaqub et al.,
10
1991), suggests the existence of anthropogenic sources contributing to SO−42
conn-centrations. Lastly, the calcium enrichment is again obvious as the ratio Ca2+/Na+ is
much higher than the one of the crustal average.
4 Conclusions
Aerosol sampling took place, on a 12-h time-resolution basis, in the centre of Athens,
15
Greece, during two 20-day periods, in August 2003 and March 2004. In August 2003,
when a large portion of the population was absent and the traffic in the city was
signif-icantly reduced, the PM10 mass concentration (obtained by Beta Attenuation) was, on
average, 56µg/m3at a height of 5 m from the ground, in Athinas St. In the second
sea-son, in March 2004, aerosol sampling took place at two sites. The first was the same
20
with the August 2003 campaign in Athinas St., where aerosol sampling took place both at 5 m from the ground and at 1.5 m from the ground, near the “breathing zone”, as de-fined by the EU (Commission, 1999/30/EC). Additional sampling, during this campaign, took place in a second site on the roof of a governmental building (AEDA), at a height
of 25 m from the ground, also in the centre of the city. The PM10 (PM10−2.5+PM2.5)
25
mass concentrations at 1.5 m from the ground in Athinas were found to be
approxi-mately 20% higher compared to respective PM10 measured at 5 m from the ground in
ACPD
6, 12389–12431, 2006Chemical characterization of inorganic aerosols in
Athens
E. T. Karageorgos et al.
Title Page
Abstract Introduction
Conclusions References
Tables Figures
◭ ◮
◭ ◮
Back Close
Full Screen / Esc
Printer-friendly Version
Interactive Discussion
the same site. In addition to this, the PM2.5 mass concentrations at 1.5 m from the
ground in Athinas St. were found to be approximately 22% higher than the respective
concentrations at 25 m from the ground in AEDA. For the heavier PM10−2.5this
discrep-ancy was even higher, as the mass concentrations at 1.5 from the ground were found to be approximately 30% higher than the respective concentrations at 25 m. There
5
is an obvious significant contribution to the CPM mass concentrations during the day
in Athinas St., which can be attributed to construction, traffic and overall human
ac-tivity. This “morning-contribution”, which consists mainly of crust-related calcium and
aluminosilicate compounds, may lead to an overestimation of the difference between
the morning values in the two sites and elevations, raising it to a 43% for the CPM.
10
However, examination of the evening CPM and the morning and evening FPM
concen-trations, as well as the PM≤10 at 1.5 and at 5 m from the ground in Athinas St., shows
that PM concentrations significantly increase the closer one gets to the ground, near the “breathing zone”. As a result of the above it becomes evident that for a realistic estimation of the exposure of citizens to particulate matter, in the centre of Athens on
15
a daily basis, PM≤10 at a height of 1.5–3 m from ground, in the “breathing zone”, are
necessary.
The simultaneous sampling with a pair of DSFUs allowed for the determination of ionic and elemental concentrations. Calcium has been found to be the predominant compound in the coarse fraction, appearing in very high concentrations. Its elevated
20
concentrations have been probably connected with the extensive construction works that were taking place in the centre of the city for the Olympic Games of 2004. Crust-related aluminosilicates and iron have also been found to be major components of the coarse fraction, while the above elements constitute the most important components of the fine fraction, together with the predominant, in this fraction, S. Toxic metals
25
ACPD
6, 12389–12431, 2006Chemical characterization of inorganic aerosols in
Athens
E. T. Karageorgos et al.
Title Page
Abstract Introduction
Conclusions References
Tables Figures
◭ ◮
◭ ◮
Back Close
Full Screen / Esc
Printer-friendly Version
Interactive Discussion
In the coarse fraction, major ions have been found to be Ca2+ and NO−3, while SO−42,
Ca2+and NH+4 were the major ionic components of the fine fraction. The low molar ratio
of NH+4/SO−42has indicated an ammonium-poor ambient air, where atmospheric
ammo-nia is not sufficient to neutralize all acidity and the formation of NH4NO3does not occur
to a significant extend. Calcium, on the other hand, predominates the coarse fraction
5
and its good correlations with coarse NO−3 and SO−42 indicate that calcium-containing
aerosols are probably major neutralizing species in this fraction, on the surface of which
acids like HNO3 and H2SO4 react to form Ca(NO3)2 and CaSO4. In the fine fraction
both Ca2+ and NH+4 play the role of the neutralizing agents. The very good correlation
between NH+4 and SO−42 indicate that the first is the major neutralizing agent of the
10
latter. The respective correlations between NH+4 and NO−3 are low which agrees with
the fact that the formation of NH4NO3is not favoured. Strong correlations have been
observed between Na+and Mg2+, Na+and Cl−and Mg2+and Cl−, which indicates the
existence of NaCl and MgCl2 salts. These findings are in agreement with studies for
other locations in Greece, in eastern Mediterranean as well as for some locations in
15
Asia.
Morning and evening means have been calculated and presented separately, as this may demonstrate, trends in the “within-a-day” variation of elements and ionic species concentrations. For many of them, morning concentrations prevailed only slightly over
the evening concentrations, when most traffic and construction activity in the city was
20
reduced. At the same time for some other species like Cl−, NO−3 and NH+4, as well as
some elements originating from human activities, evening values appear slightly higher over morning ones. The above might be indicative of the trapping of near-surface aerosols under a shallow atmospheric boundary layer during the night.
Total analyzed inorganic mass (elemental+ionic) has been found to be ranging
be-25
tween approximately 25–33% of the total coarse particle mass and 35–42% of the total
fine particle mass. The unknown part is believed to include major ions (CO−3, OH−),
lighter elements and other mineral compounds (with bound oxygen and nitrogen), as
ACPD
6, 12389–12431, 2006Chemical characterization of inorganic aerosols in
Athens
E. T. Karageorgos et al.
Title Page
Abstract Introduction
Conclusions References
Tables Figures
◭ ◮
◭ ◮
Back Close
Full Screen / Esc
Printer-friendly Version
Interactive Discussion
well as carbon, organics and polymers, which usually constitute more than 50% of the urban aerosol mass.
References
Artunano, B., Salvador, P., Alonso, D. G., Querol, X., and Alastuey, A.: Anthropogenic and natural influence on the PM10 and PM2.5 aerosol in Madrid (Spain). Analysis of high con-5
centration episodes, Environ. Pollut., 125, 453–465, 2003.
Chaloulakou, A., Kassomenos, P., Spyrellis, N., Demokritou, P., and Koutrakis, P.: Measure-ments of PM10 and PM2.5 particle concentrations in Athens, Greece, Atmos. Environ., 37, 649–660, 2003.
Chaloulakou, A., Kassomenos, P., Grivas, G., and Spyrellis, N.: Particulate matter and black 10
smoke concentration levels in central Athens, Greece, Environ. Int., 31, 651–659, 2005. Chan, C. Y., Xu, X. D., Li, Y. S., Wong, K. H., Ding, G. A., Chan, L. Y., and Cheng, X. H.:
Characteristics of vertical profiles and sources of PM2.5, PM10and carbonaceous species in Bejing, Atmos. Environ., 39, 5113–5124, 2005.
Commission, E.: 1999/30/EC. Relating to limit values for sulphur dioxide, nitrogen dioxide and 15
oxides of nitrogen, particulate matter and lead in ambient air.
D’ Alessandro, A., Lucarelli, F., Mando, P. A., Marcazzan, G., Nava, S., Prati, P., Valli, G., Vecchi, R., and Zucchiatti, A.: Hourly elemental composition and sources identification of fine and coarse particulate matter in four italian towns, Aerosol Sci., 34, 243–259, 2003. Danalatos, D. and Glavas, S.: Atmospheric nitric acid concenrtations in a mediterranean site, 20
Patras, Greece, Atmos. Environ., 29, 1849–1852, 1995.
Davis, B. L. and Jixian, G.: Airborne particulate study in five cities of China, Atmos. Environ., 34, 2703–2711, 2000.
Dockery, D. W and Pope, C. A.: Acute respiratory effects of particulate air pollution, Ann. Rev. Publ. Health, 15, 107–132, 1994.
25
Eleftheriadis, K., Balis, D., Ziomas, I. C., Colbeck, I., and Manalis, N.: Atmospheric aerosol and gaseous species in Athens, Greece, Atmos. Environ., 32, 2183–2191, 1998.
Fyfe, W. S.: Geochemistry, Oxford University Press, 1974.
ACPD
6, 12389–12431, 2006Chemical characterization of inorganic aerosols in
Athens
E. T. Karageorgos et al.
Title Page
Abstract Introduction
Conclusions References
Tables Figures
◭ ◮
◭ ◮
Back Close
Full Screen / Esc
Printer-friendly Version
Interactive Discussion and regional contributions to the atmospheric aerosol over Tel Aviv, Israel: a case study
using elemental, ionic and organic tracers, Atmos. Environ., 38, 1593–1604, 2004.
Grivas, G., Chaloulakou, A., Samara, C., and Spyrellis, N.: Spatial and temporal variation of PM10 mass concentrations within the Greater Area of Athens, Greece, Water, Air Soil Pollut., 158, 357–371, 2004.
5
Harrison, R. M., Smith, D. J. T., and Luhana, L.: Source Apportionment of Atmospheric Poly-cyclic Aromatic Hydrocarbons Collected from an urban location in Birmingham, UK, Environ. Sci. Technol., 30, 825–832, 1996.
Katsouyanni, K., Touloumi, G., Spix, C., Schwartz, J., Balducci, F., Medina, S., Rossi, G., Wojtyniak, B., Sunyer, J., Bacharova, L., Schouten, P., Ponka, A., and Andersen, H. R.: 10
Short term effects on ambient air sulphur dioxide and particulate matter on mortality in 12 European cities: results from time series data from the APHEA project., British Medical Journal, 314 (7095), 1658–1663, 1997.
Katsouyanni, K., Touloumi, G., Samoli, E., Gryparis, A., Le Tertre, A., Monopolis, Y. Y., and Tossi, G.: Confounding and effect modification in the short-term effects of ambient particles 15
on total mortality: results from 29 European cities within the APHEA2 project, Epidemiology, 12, 521–531, 2001.
Koliadima, A., Athanasopoulou, A., and Karaiskakis, G.: Particulate matter in the air of the cities of Athens and Patras (Greece): particle size distributions and elemental concentrations, Aerosol Sci. Technol., 28, 292–300, 1998.
20
Kouyoumdjian, H. and Saliba, N. A.: Mass concentration and ion composition of coarse and fine particles in an urban area in Beirut:effect of calcium carbonate on the absorption of nitric and sulfuric acids and the depletion of chloride, Atmos. Chem. Phys., 6, 1865–1877, 2006,
http://www.atmos-chem-phys.net/6/1865/2006/.
Luhana L., H. Mao, and Sokhi, R. S.: Laboratory and field evaluation of UH Dichotomous 25
Stacked Filter Units (DSFU), University of Hertfordshire. SAPPHIRE Report (EVK4-2001-00192), 2001.
Manalis, N., Grivas, G., Protonotarios, V., Moutsatsou, A., Samara, C., and Chaloulakou, A.: Toxic metal content of particulate matter (PM10), within the Greater Area of Athens, Chemo-sphere, 60, 557–566, 2005.
30
Marcazzan, G. M., Vaccaro, S., Valli, G., and Vecchi, R.: Characterisation of PM10 and PM2.5 particulate matter in the ambient air of Milan (Italy), Atmos. Envi., 35, 4639–4650, 2001. Miller, J. C. and Miller, J. N.: Statistics for Analytical Chemistry. Ellis Horwood PTR Prentice
ACPD
6, 12389–12431, 2006Chemical characterization of inorganic aerosols in
Athens
E. T. Karageorgos et al.
Title Page
Abstract Introduction
Conclusions References
Tables Figures
◭ ◮
◭ ◮
Back Close
Full Screen / Esc
Printer-friendly Version
Interactive Discussion Hall, England, 1993.
Pakkanen, T. A., Loukkola, K., Korhonen, C. H., Aurela, M., M ¨akel ¨a, T., Hillamo, R. E., Aarnio, P., Koskentalo, T., Kousa, A., and Maenhaut, W.: Sources and chemical composition of atmospheric fine and coarse particles in the Helsinki area, Atmos. Environ., 35, 5381–5391, 2001.
5
Pathak, R. K., Louie, P. K. K., and Chan, C. K.: Characteristics of aerosol acidity in Hong Kong, Atmos. Environ., 38, 2965–2974, 2004.
Pathak, R. K. and Chan, C. K.: Inter-particle and gas-particle interactions in sampling artifacts of PM2.5in filter-based samplers, Atmos. Environ., 39, 1597–1607, 2005.
Peng, R. D., Dominici, F., Pastor-Barriuso, R., Zeger, S. L., and Samet, J. M.: Seasonal analy-10
ses of air pollution and mortality in 100 US, Am. J. Epidemiol., 161, 585–594, 2005.
Pope III, C. A., Burnett, R. T., Thun, M. J., Cale, E. E., Krewski, D., Ito, K., and Thurston, G. D.: Lung cancer, cartiopulmonary mortality and long-term exposure to fine particulate air pollution, J. Am. Medical Assoc., 287, 1132–1141, 2002.
Puxbaum, H., Gomiscek, B., Kalina, M., Bauer, H., Salam, A., Stopper, S., Preining, O., and 15
Hauck, H.: A dual site study of PM2.5 and PM10 aerosol chemistry in the larger region of Vienna, Austria, Atmos. Environ., 38, 3949–3958, 2004.
Querol, X., Alastuey, A., Rodriguez, S., Plana, F., Ruiz, C. R., Cots, N., Massague, G., and Puig, O.: PM10 and PM2.5 source apportionment in the Barcelona Metropolitan area, Catalonia, Spain, Atmos. Environ., 35, 6407–6419, 2001.
20
Salma, I., Maenhaut, W., Zemplen-Papp, E., and Zaray, G.: Comprehensive characterization of atmospheric aerosols in Budapest, Hungary: physicochemical properties of inorganic species, Atmos. Environ., 35, 4367–4378, 2001.
Scheff, P. A. and Valiozis, C.: Characterization and source identification of respirable particulate matter in Athens, Atmos. Environ., 24A, 203–211, 1990.
25
Seinfeld, J. H. and Pandis, S. N.: Atmospheric Chemistry and Physics: From air pollution to climate change. John Wiley & Sons, 1998.
Shaka, H. and Saliba, N. A.: Concentration measurements and chemical composition of PM10-2.5 and PMPM10-2.5 at a coastal site in Beirut, Lebanon, Atmos. Environ., 38, 523–531, 2004. Siskos, P., Bakeas, E., Lioli, I., Smirnioudi, V. N., and Koutrakis, P.: Chemical characterization 30
of PM2.5 aerosols in Athens – Greece, Environ. Technol., 22, 687–695, 2001.
ACPD
6, 12389–12431, 2006Chemical characterization of inorganic aerosols in
Athens
E. T. Karageorgos et al.
Title Page
Abstract Introduction
Conclusions References
Tables Figures
◭ ◮
◭ ◮
Back Close
Full Screen / Esc
Printer-friendly Version
Interactive Discussion 2003.
Touloumi, G., Pocock, S. J., Katsouyanni, K., and Trichopoulos, D.: Short term effects of air pollution on daily mortality in Athens. A time series analysis, Int. J. Epidemiol., 23, 957–967, 1994.
Trebs, I., Metzger, S., Meixner, F. X., Helas, G., Hoffer, A., Rudich, Y., Falkovich, A. H., Moura, 5
M. A. L., Da Silva Jr., R. S., Artaxo, P., Slanina, J., and Andreae, M.: The NH+4-NO−
3-Cl
−
-SO−42-H2O aerosol system and its gas phase precursors at a pasture site in the Amazon Basin: How relevant are mineral cations and soluble organic acids?, J. Geophys. Res., 110, 1–18, 2005.
Tsitouridou, R. and Samara, C.: First results of acidic and alkaline constituents determination 10
in air particulates of Thessaloniki, Greece, Atmos. Environ., 27B, 313–319, 1993.
Valavanidis, A., Fiotakis, K., Vlahogianni, T., Bakeas, E. B., Triantafyllaki, S., Paraskevopoulou, V., and Dassenakis, M.: Characterization of atmospheric particulates, particle-bound tran-sition metals and polycyclic aromatic hydrocarbons of urban air in the centre of Athens (Greece), Chemosphere, 2006.
15
WHO: Air Quality Guidelines, second ed., WHO Regional Office for Europe, Copenhagen, Denmark, 2000.
Xie, R. K., Seip, H. M., Leinum, J. R., Winje, T., and Xiao, J. S.: Chemical characterization of individual particles (PM10) from ambient air in Guiyang City, China, Sci. Total Environ., 343, 261–272, 2005.
20
Yaaqub, R. R., Davis, T. D., Jickells, T. D., and Miller, J. M.: Trace elements in daily collected aerosols at a site in southeast England, Atmos. Environ., 25A, 985–996, 1991.
Yatin, M., Tuncel, S., Aras, N. K., Olmez, I., Aygun, S., and Tuncel, G.: Atmospheric trace ele-ments in Ankara, Turkey: 1. factors affecting chemical composition of fine particles, Atmos. Environ., 34, 1305–1318, 2000.
25
ACPD
6, 12389–12431, 2006Chemical characterization of inorganic aerosols in
Athens
E. T. Karageorgos et al.
Title Page
Abstract Introduction
Conclusions References
Tables Figures
◭ ◮
◭ ◮
Back Close
Full Screen / Esc
Printer-friendly Version
Interactive Discussion
Table 1. PIXE detection limits for ambient air samples on membrane filters of mixed cellulose
esters (a.d.: area of deposit=13 cm2).
µg/a.d. µg/a.d. µg/a.d. µg/a.d.
Al 1.9 Ti 0.02 Zn 0.05 Zr 0.005
Si 2,3 V 0.017 Ga 0.007 Mo 0.006
P 1.8 Cr 0.017 As 0.006 Cd 0.03
S 0.8 Mn 0.012 Se 0.002 Sn 0.04
Cl 0.6 Fe 0.14 Br 0.007 Sb 0.06
K 0.3 Ni 0.012 Rb 0.004 Ba 0.2