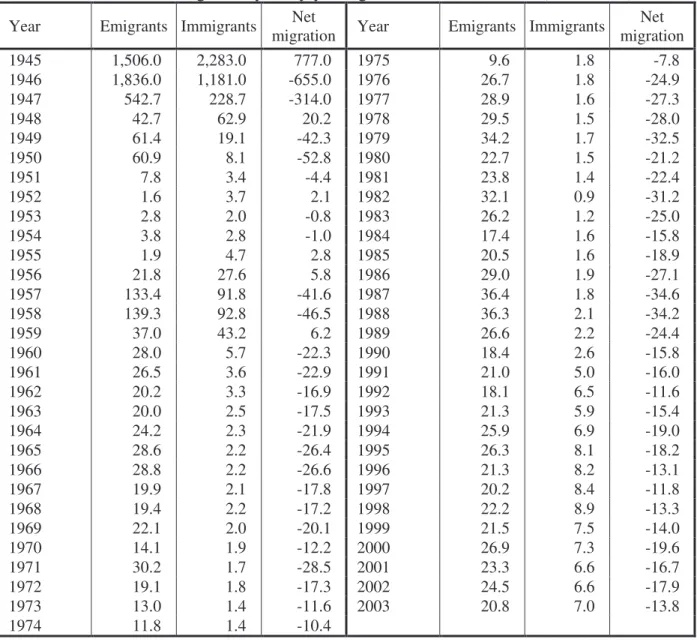
Monitoring the legality of employment and the cases of illegal employment of foreigners by provinces. Emigration from Poland therefore reached its lowest level in the six-year period and is expected to further decrease in 2004. After a continuous decrease in the five-year period, immigration to Poland increased compared to the previous year, although it did not correspond to the levels from 1995-1998.
In addition, in the wake of Poland's accession to the EU, and the increasing numbers of EU/EEA citizens coming to Poland to work, set up businesses, study, etc., the number of foreign citizens living in Poland, expect. to stand up
Economy
Migration and integration policy
On June 1, 2004, the Act on Promotion of Employment and Labor Market Institutions entered into force5. Among other things, the law regulates the access of EU citizens and other foreigners to the Polish labor market. Therefore, other groups of foreigners were also placed in the focus of the integration policy.
Payment is mandatory for citizens of the Russian Federation 'mainland' and for citizens of Belarus.
Trans-border mobility (international movements of passengers)
However, it should be emphasized that the latter were mainly intended for one-day tourist trips to the border area of Poland. According to the cyclical survey of the Institute of Tourism, one-day trips dominated the total volume of foreign arrivals to Poland, which accounted for 74% in 2003 (78% in 2002). This means that the arrivals of tourists who stayed overnight in Poland accounted for about one quarter of all arrivals.
One-day trips prevailed among those coming from the Slovak Republic and the Czech Republic (97%), as well as from Germany (82%).
Documented flows of people
- Introductory remarks
- General trends
- Destination of emigrants and origins of immigrants
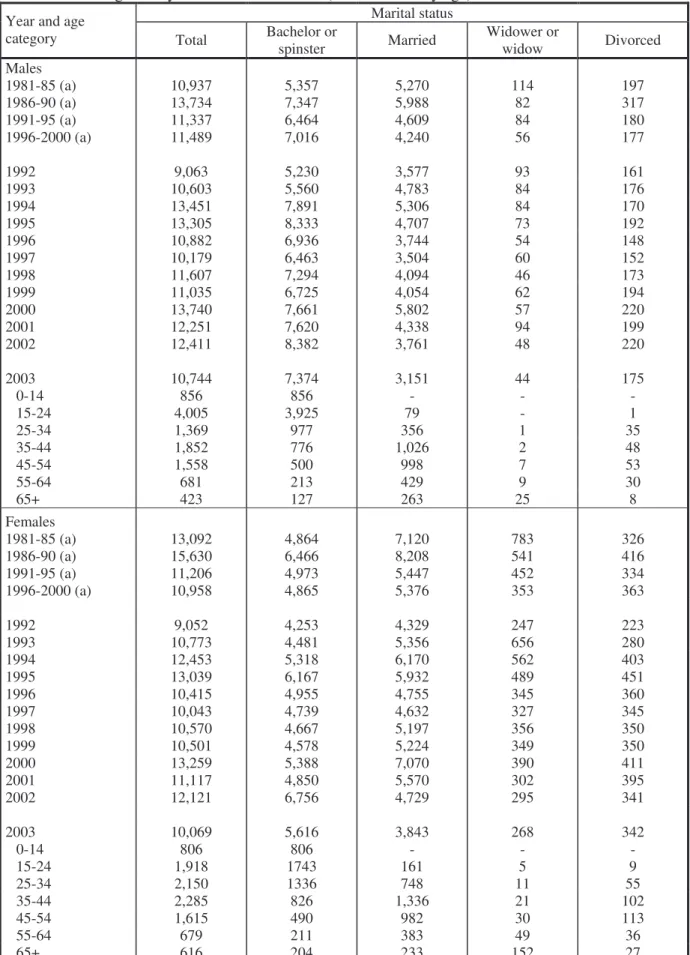
- Migrants by age, marital status and educational attainment
Decreases were also reported in Estonia, Latvia and Lithuania (by 12%, 4% and 2% respectively). These three countries accounted for 87.8% of the total in 2003, as in previous years. In 2003, as in previous years, there were more men than women in the total population of immigrants.
The age distribution of women was different for emigrants and immigrants, with the predominance of 'the youngest' and 'the oldest' among immigrants and the prevalence of 'the middle-aged' among emigrants.
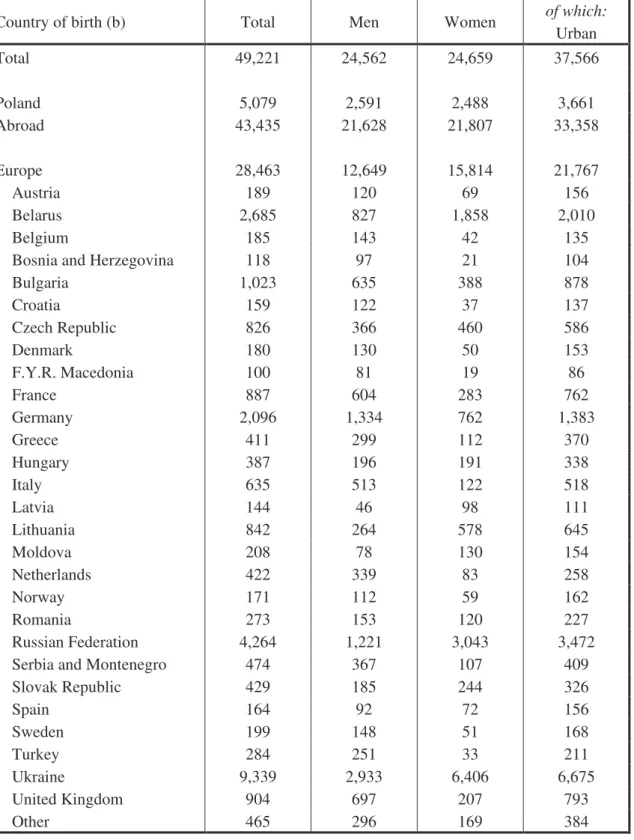
The stock of foreigners in Poland according to the 2002 population census
In the case of Ukraine (69% of women), the Russian Federation (71%), Belarus (69%), Lithuania (69%) and the Czech Republic (56%), women far outnumbered men, while foreigners born in Germany, Vietnam, Armenia, Bulgaria, the United States and France were predominantly men (women accounted for about 32-38%, and 23% in the case of Bulgaria). Men began to outnumber women in the case of Ukraine (48% of women), Belarus (49%) and the Czech Republic (39%), while the share of women decreased (but still dominated) in the case of the Russian Federation (58% of women) and Lithuania (52%) (Table 15). The share of women was the largest in the case of three provinces in eastern Poland (Podlaskie, Lubelskie and Podkarpackie).
In fact, Poland reported the largest share of permanent residents in the total population of non-Polish residents (77%), followed by Opolskie (75%) and Kujawsko-pomorskie (70%).
Migrants in Poland
- Inflow of temporary and permanent residents (foreign citizens)
- Stock of temporary immigrants
- Foreigners married to Polish citizens
- Foreign students
- Stock of emigrants (permanent residents of Poland)
The biggest increases were shown in the case of provinces with a relatively small number of temporary permit holders, namely (in order of increasing numbers of foreigners): wi tokrzyskie (with 30%), Lubuskie (with 19%), Kujawsko-pomorskie (with 10 %), Warmi sko-mazurskie (with 22%), Podlaskie (with 16%) and Podkarpackie (with 10%). Women made up 48.7% of all applicants, the vast majority of which, as in the case of temporary permits, were citizens of former Soviet Union countries (77%). Last but not least, the predominance of women in the inflow from the former Soviet Union (especially its European part) and the predominance of migrants coming from this particular region in the total inflow had a major impact on the gender distribution of all applicants for residence permits (both temporary and permanent).
The increase in the number of men from the countries of the former Soviet Union was contributed by a 43% increase in the case of Ukraine, as well as from the Russian Federation and Armenia.
Migration for work
Foreign migration of Polish workers
In the second quarter of 2002, VET data reveal a low level of education (and skills) of Polish migrant workers - 52% of them have completed at most one level of vocational education. In general, due to the total increase in the number of migrant workers, almost all destination countries recorded an increase in the second quarter of 2004 over the corresponding period in 2003. In addition, virtually non-existent destinations were opened for Polish migrant workers. in the second quarter of 2004, namely Ireland and Sweden.
In the second quarter of 2004, only the USA and France reported a higher share of long-term migrants.
Foreign labour in Poland
In the wake of Poland's accession to the European Union, both countries fully opened their labor markets to Poles. It should be emphasized that allowing free movement of workers through Ireland, the United Kingdom and Sweden on 1 May 2004 was only partially responsible for the overall growth in the number of migrant workers from Poland in the second quarter of 2004. As a matter of fact , despite the above-mentioned increases, Poles who took jobs in these three countries comprised only 16% of the total population of migrant workers in the second quarter of 2004.
Typically, short-term migrants dominated the outflow of Polish migrant workers and their share in the total increased in the case of all receiving countries except France. However, the share of short-term migrants among those going to the United States has been increasing in recent years, and in the second quarter of 2004 they accounted for 47% (39% in the corresponding period of 2003). The opposite is true for all other countries, with 60-67% of short-term migrants in Ireland, Italy and Spain, and 70-77% in the case of Belgium, Germany and the United Kingdom.
Thus, data on foreigners in the Polish labor market and their main characteristics are expected to be available in 2005. In addition, in the first six months of work permits were issued compared to 9,043 permits in the respective period of 2003, indicating a decrease in the overall volume of work permits in Poland in 2004. In the case of large countries of origin the respective figures were 31% for Germany, 39% for France, 23% for the United Kingdom and 34% for Italy.
Despite the overall decrease in the total number of foreign workers from Ukraine, their representation in education has increased slightly (by 3%, 568 permits). Furthermore, Lubelskie showed the largest share of undocumented employment in the number of inspections conducted in a given province: 44%.
Repatriation to Poland
Labor authorities in cooperation with the Police and Border Guard monitor the legality of employment in companies operating in Poland. In total, approximately 8,000 cases of undocumented employment were identified, of which 2,711 were foreigners, representing 10% of the total. More than 70% of recognized cases of undocumented employment of foreigners were detected in only four provinces, namely Lubelskie (36%), Mazowieckie (14%), Wi tokrzyskie (13%) and Dolno l skie (9%).
Inflow of refugees/asylum seekers
As for other nationalities, the number of asylum seekers from Afghanistan, as well as from Armenia, Moldova, Mongolia and Iraq - countries that were present on the asylum scene in Poland in 2002 - continued to decline in 2003 and in 2004 (January-October ). At the same time, in 2004 (January-October) the number of asylum applications from Pakistan has already exceeded the level of 2003, and Pakistan was the second most important country of origin of asylum seekers in 2004. Despite the expected decrease in the number of asylum seekers in 2004 (January-October), India still followed.
Asylum seekers who do not have sufficient funds to cover the costs of their stay in Poland are offered basic assistance at reception centres, including accommodation, food, medical care, education and pocket money. However, the authorities are considering opening new centers for asylum seekers as the scale of the phenomenon increases. In connection with asylum seekers, decisions were made by the chairman of the Office for Repatriation and Aliens and the Refugee Board (which acts as the appeals authority in the second instance).
According to the Office for Repatriation and Aliens, in 2003 approximately 7,000 asylum seekers from Chechnya left Poland simply by withdrawing their travel documents from the Office (thus halting the refugee procedure). The number of asylum seekers who decided to end the asylum procedure in Poland has decreased since May 2004. 90% of them were issued to asylum seekers (who received a negative decision in the asylum procedure but could not be expelled from Poland), and the remaining 10% go to foreigners who, for various reasons, could not be granted a temporary residence permit in Poland.
The introduction of the patient status in the Polish legislation in 2003 was of utmost importance, especially in relation to rejected asylum seekers who cannot return to their country of origin. Therefore, despite the fact that their stay in Poland is legal, which was considered a solution for a large number of rejected asylum seekers from Chechnya, their employment situation is highly irregular.
Illegal movements of foreign citizens
Between January and September 2004, over persons) of all cases that were not recognized were applications from citizens of the Russian Federation. Over 90% of all foreigners caught at the German part of the Polish border were heading west (from Poland). Similarly, foreigners apprehended on their way to Poland accounted for over 90% of the total Polish-Ukrainian border.
There were also illegal movements at the Polish-Czech border, accounting for 13% of the total (17% in 2002). Foreigners returned from Germany made up 95% of the total and their numbers grew by 16% compared to 2002. Readmitted migrants who crossed the border illegally in organized groups made up 44% of the total (47% in 2002) (Table 49).
Tourists crossing the border unintentionally outside border checkpoints and small-time smugglers from the Czech Republic accounted for 10% of the total. According to BG, approximately 75% of citizens of the Russian Federation involved in the phenomenon of illegal movements to Poland were Chechen citizens (tables 50 and 51). Overall, in 2003, half of the migrants intercepted came from the former Soviet Union, almost a third from Asia (excluding the Asian countries of the former Soviet Union) and 16% from European countries (excluding the European part of the former Soviet Union).
European countries made up a decreasing share of the total, mainly due to the disappearance of citizens of Serbia and Montenegro from the statistics. A growth in the number of intercepted organized groups was also reported in the case of the Polish-Ukrainian border (from 32 in 2002 to 43 in 2003). Migrants from (in order of importance) Vietnam, India, China, Afghanistan and Pakistan accounted for 56% of the total in 2003.
However, citizens of the Russian Federation formed the largest single share, accounting for 22% of the total. 12 months Total of which: duration of stay less than. a) Since the second quarter of 2003, data from the LFS has been adjusted based on the 2002 population census. Duration of stay abroad (in month). b) Since the second quarter of 2003, data from the LFS has been adjusted based on the 2002 population census.