The work has taken an important position in the industry in that it contributes to the formation of a common understanding of the level of risk. Therefore, we depend on the parties having a common understanding of the reasonableness of the methodology used and the value created by the results.
Objective and limitations
Objective
Purpose
Key limitations
Conclusions
None of the collisions in the past four years fell into the serious category. There has been a negative trend in the number of chemicals used in both production and mobile facilities.
Execution
- Execution of the work
- Use of risk indicators
- Developments in the activity level
- Documentation
All incident data is quality assured by, for example, comparing it with the incident register and other databases of the Petroleum Safety Authority. Report on acute discharges into the sea for the Norwegian continental shelf 2015, to be published in autumn 2016.
Survey questionnaire
- HSE climate
- Perceived accident risk
- Working environment
- Leisure
- Health and sickness absence
- Comparison of HSE assessments offshore and onshore
Despite the negative changes in HSE conditions, the perceived risk does not appear to have increased particularly since 2013. Employees are generally satisfied with most circumstances related to offshore leisure and recreation.
Status and trends - DFU12, helicopter incidents
Activity indicators
Incident indicators
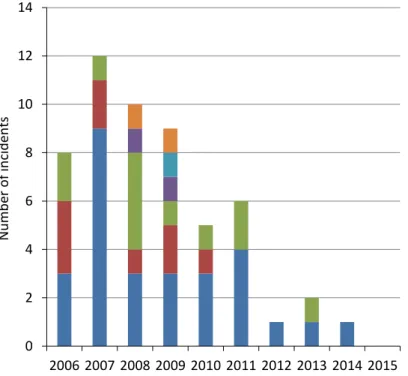
In the years 2006 and 2007, there was one incident in each year without remaining barriers, while two such incidents in 2008. There were no incidents without remaining barriers to the fatal accident in the years 2009-2013, while in 2014 one incident has been rated as in this category. In the period 2010-2014, there was a significant decrease in the number of incidents related to helicopters.
The number of incidents included in the indicator in 2015 rose sharply, almost doubling, compared to 2014. After a low number of recorded incidents with a security impact related to bird strikes in the years from 2010 to 2013, there were ' an increase after 7 incidents in 2014. The increase in the number of recorded incidents with a safety impact in 2014 and 2015 may weigh against this.
The proposals from the RNNP of previous years are being followed, including the following year.
Status and trends – indicators for major accidents on facilities
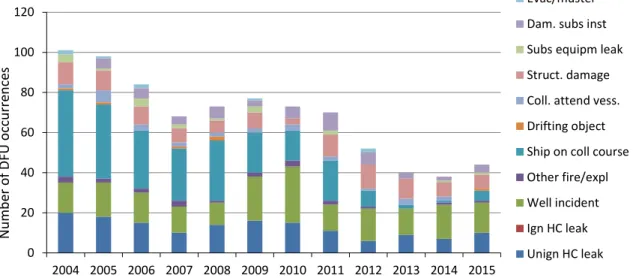
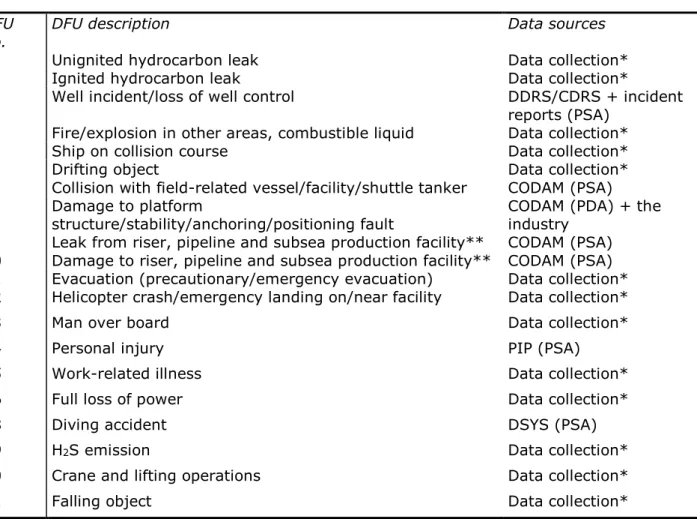
DFUs associated with major accident risk
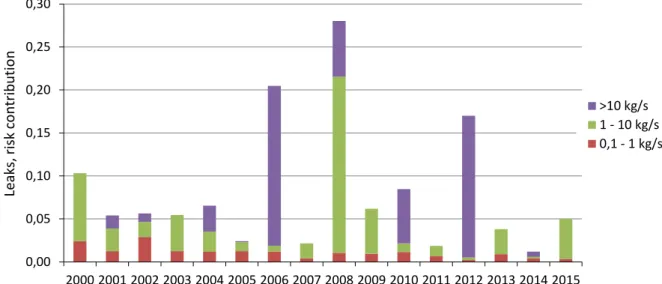
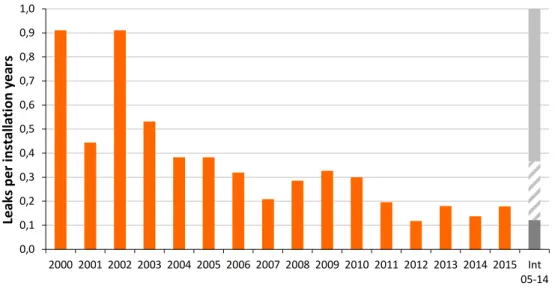
Risk indicators for major accidents
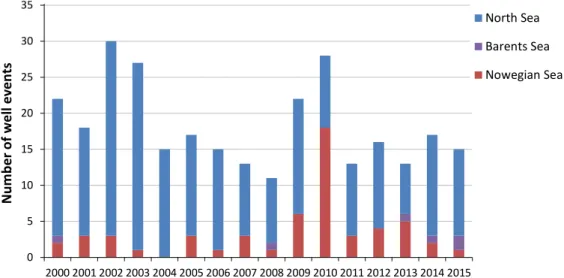
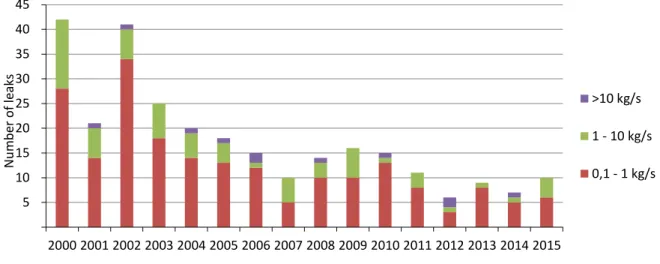
The number of leaks is normalized based on both operating hours and number of facilities in the main report. There has been a clear decrease in the number of incidents during exploration drilling in 2015 compared to the three previous years. An indicator has existed for twelve years for DFU5, where the number of ships reported on a potential collision course is normalized by the number of facilities monitored from the traffic center at Sandsli, expressed as the total number of monitoring days for all facilities monitored by Statoil Marine in Sandsli.
The number of recorded cases of ships on a collision course has fallen significantly in recent years. It is also hypothesized that there is a relationship between the number of minor and more serious incidents; see the methodology report. A clear relationship between the age of the object and the number of cracks has not been demonstrated.
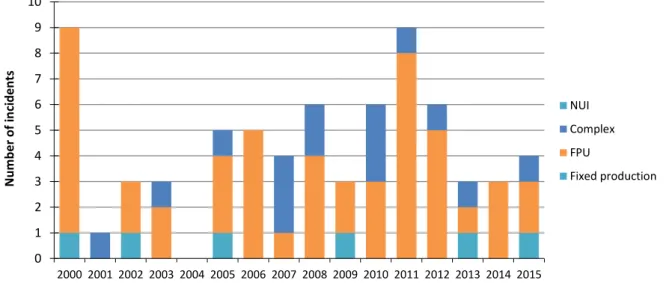
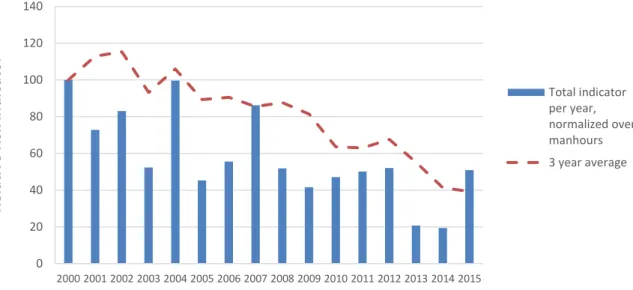
The high number of incidents in 2011-2012 appears to represent a break in the positive trend observed in 2004-2010.
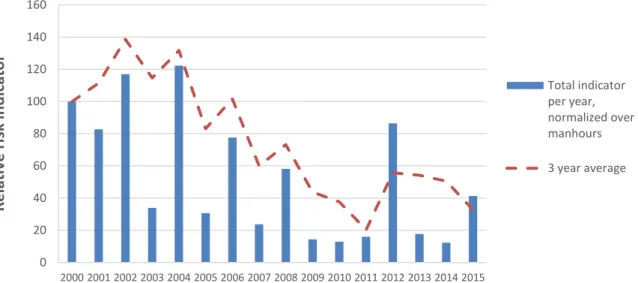
Total indicator for major accidents
Structural damage and incidents included in the RNNP are mostly classified as fatigue damage, but some are storm damage. A serious incident on COSL Innovator with waves in the deck box, which stove in the window in an accommodation section. For manufacturing facilities, looking at the three-year average, the main impression is of a relatively constant level until 2004.
There were no very serious incidents in 2013 and 2014, and the total number of incidents is relatively low. In 2015, a number of serious incidents contributed to raising the level of the overall indicator. After higher values in 2012, the value of the moving average in 2015 is well below the level of despite the obvious increase of the risk indicator from 2014 to 2015.
The contribution from structural damage and incidents involving marine systems has been high in mobile facilities for many years.
Status and trends – barriers against major accidents
Barriers in the production and process facilities
The figure shows that in 2015, few failures were recorded in the ESDV closure test. The industry standard for the ESDV closure test is 0.01, and the figure above shows that eight facilities exceed the industry standard for percent failure. in 2015 and 19 facilities for the average value. Overall, many facilities performed below or well below the industry standard for several barrier elements, both in 2015 and on average over the entire period.
Taking into account the industry's recent focus on the prevention of major accidents, one would expect that it would be possible to achieve greater improvements in this area than is evident from data from recent years. The table shows that, overall, most barrier elements are below or approximately at the level of the industry standard for accessibility. As in the previous year's RNNP report, the 2015 average percentage of failure and the 2002-2015 average percentage of failure for riser ESDVs and blowdown valves (BDVs) are above the industry standard.

Barriers associated with maritime systems
The failure frequencies for these systems in 2015 were 0.005 for tests on watertight doors and 0.001 for tests on ballast valves. The failure rate for testing watertight doors is higher than for manufacturing facilities, where there were zero reported failures in 2015. The failure rate for testing valves in the ballast system is also higher for mobile facilities compared to this failure rate for production facilities.
Indicators for maintenance management
We see that corrective maintenance hours performed were lower in 2015 than in the years 2011-2014. At the same time, we see that hours of preventive maintenance carried out increased in the period 2011-2015.

Status and trends – work accidents involving fatalities and serious personal
Serious personal injuries, production facilities
Serious personal injuries, mobile facilities
Comparison of accident statistics between the UK and Norwegian shelves
A calculation of the average injury rate for fatalities and serious injuries for the period from 2009 to the second half of 2014 shows that there have been 0.6 injuries per million working hours on the Norwegian continental shelf and 0.8 on the British continental shelf. The average frequency of fatal accidents on the British continental shelf is 1.4 per 100 million working hours compared to 0.4 on the Norwegian continental shelf. On the British continental shelf there were four fatalities in the period in question compared to one on the Norwegian continental shelf.
Risk indicators – noise, chemical working environment and ergonomics
Noise exposure harmful to hearing
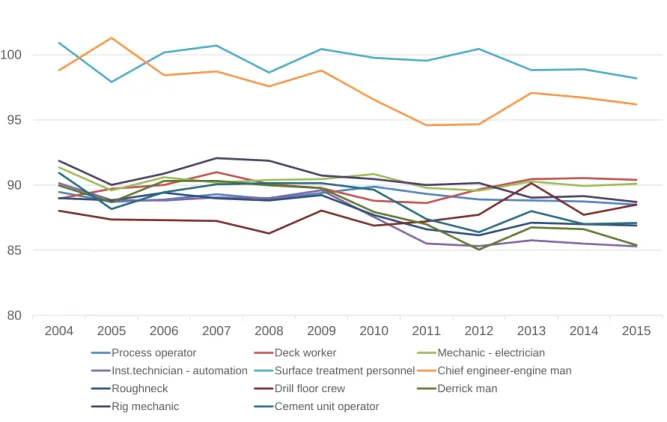
The average value of the noise indicator for all NCS activities has been relatively stable in recent years. Assuming that the noise indicator reflects actual noise exposure, most position categories covered in this survey are exposed to noise above the 83 dBA threshold. Considering the estimated effect of hearing protection as reported by companies, it appears that the vast majority of job categories are exposed to noise within the requirements.
Such arrangements may have operational disadvantages and may inherently be a driver for more robust technical measures. Despite the indicator pointing towards high exposure, several institutions still do not have action plans for risk reduction, see Figure 30. For 2015, the figures show an increase in the number of new and worsening cases of hearing loss.
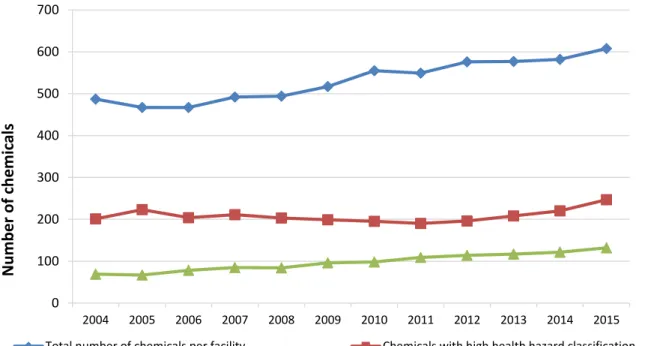
Chemical working environment
For manufacturing facilities, 36% report that they have established a binding plan to reduce exposure to chemicals in the facility. 34% report that they have a plan based on reducing the exposure of vulnerable groups, and 34% report that they have implemented measures in line with the plans for the reporting period. Total number of chemicals per facility Chemicals with high health hazard classification Chemicals with high hazard potential.
In 2015, 49 new cases of occupational skin complaints caused mainly by chemical exposure were reported, compared to 50 cases in 2014.
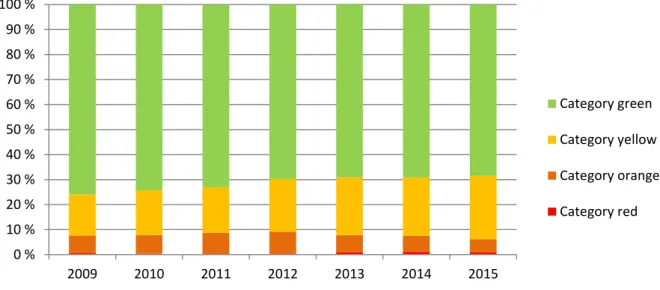
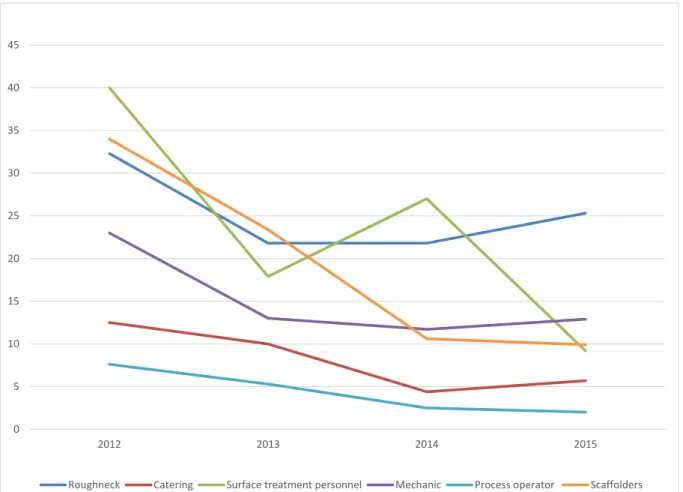
Ergonomics
In the green area, there is a low risk of repetitive stress injuries for most employees. However, there were also individual cases in 2015 of the old form being used and of changes to predetermined work tasks. Overall, the results show that the positive trend seen last year for most of the groups on production facilities has leveled off, and reversed to some extent.
For manufacturing facilities, it is only surface treatment personnel that show a clear reduction in the proportion of work tasks rated as red. The figures above show that necks are the group with the reddest overall job task ratings for both manufacturing and mobile facilities.
RNNP data in a late life perspective
- Introduction
- Methodology
- Analysis of RNNP data
- Discussion
- Conclusion
Overall, the analyzes of the two DFUs do not support the general assumption that the HSE level at late-life facilities has deteriorated. It is not self-evident that it is profitable to keep old equipment, even in late life. Overall, the analyzes of injuries and serious personal injuries do not support the general assumption that the HSE level at late-life facilities has deteriorated.
Overall, analyzes of the numbers and volumes of acute crude oil spills do not support the general assumption that the HSE level at end-of-life facilities has weakened. Regarding the perceived physical, chemical and ergonomic work environment, the analyzes provide only very limited support for the general assumption that the HSE level in end-of-life facilities has weakened. A key feature of the results is that the hypotheses regarding the weakened level of HSE in end-of-life facilities are mostly.
By way of introduction, a number of factors were cited to support the general assumption of a weakened HSE level in end-of-life facilities.
Other indicators
DFU20 Crane and lifting operations
Incidents related to crane and lifting operations have a greater potential to cause personal injury than incidents related to falling objects. Consequently, there is a greater proportion of personal injury incidents under DFU20 crane and lifting operations than with DFU21 falling objects. Out of a total of 220 incidents reported for the period 2013-2015 under the crane and lifting operations DFU20, 33 of the incidents caused personal injuries, accounting for 15% of the incidents.
After normalizing personal injuries according to the number of working hours at NCS (excluding administration and catering), it turns out that during the period, as shown in Figure 37, there was a slight decrease in the proportion of accidents involving physical injuries.

DFU21 Falling objects
Other DFUs
Definitions and abbreviations
Definitions
Abbreviations