Master's thesis title Residual profits and book value in stock valuation in the Chinese stock market. In conclusion, the residual earnings and book value of stocks are significant in the fundamental valuation model used and applied to the Chinese stock market data. The fundamental valuation model tested and estimated with Chinese stock market data can easily calculate the fundamental value of a large number of companies.
This basic valuation model is a regression model proposed by Bukhvalov and Volkov (2005) and has not been tested on the Chinese stock market. It describes the background of the Chinese stock market and the phenomenon of market price discrepancy of listed companies.
China Stock Market Overview
China Stock Market
8 majority of listings on Hong Kong Stock Exchange are from Hong Kong and mainland China. Shanghai-Hong Kong Stock Connect and Shenzhen-Hong Kong Stock Connect are the most recent trading mechanisms established to channel China's mainland stock market and international stock market. Shanghai-Hong Kong Stock Connect was launched on November 17, 2014 and Shenzhen-Hong Kong Stock Connect was launched on December 5, 2016.
Under these two programs, Chinese investors can trade most companies, especially blue chips, listed on Hong Kong Stock Exchange without establishing account in Hong Kong Stock Exchange. For international investors who have opened an account with Hong Kong Stock Exchange, they can trade many companies listed on Shanghai Stock Exchange and Shenzhen Stock Exchange without opening accounts in these two stock exchanges.
Dual Listed Share Phenomenon
Nevertheless, we still observe a significant price difference between A-share and H-share in a dual-listed company. HKDCNY, exchange rate, is the amount of Chinese yuan needed to buy one Hong Kong dollar. For some reason, the A share only circulates in mainland China, and the H share only circulates in the Hong Kong market.
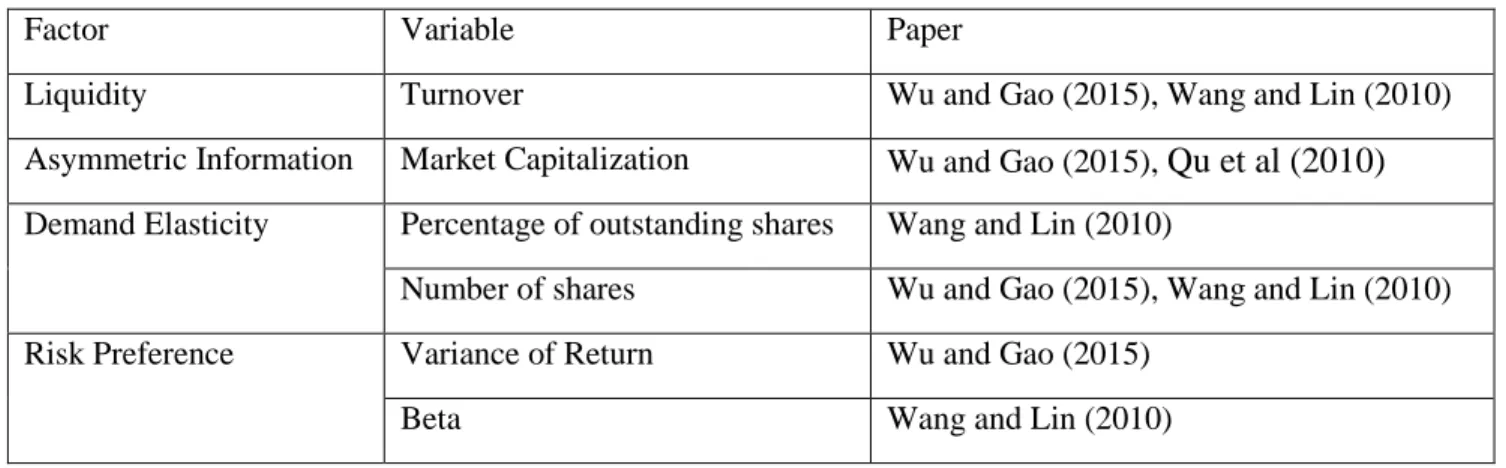
To explain the stock price difference for dual listed companies in the Mainland China stock market and the Hong Kong stock market, researchers have already identified several factors. However, there is no paper evidence of the price change in the fundamental value difference perspective.
Theory
Fundamental Value and Models
In addition to linear information dynamics, pure profit accounting relationship is another prerequisite required to derive the Ohlson (1995) model. Many other regression models, for example a simple regression of stock price on book value of equity and earnings, are compared to the Ohlson (1995) model. In conclusion, the paper pointed out that Ohlson's (1995) model is generally similar to previous applications of traditional earnings capitalization models.
One server disadvantage of Ohlson model and its variants is that the model sometimes generates negative value. Burgstahler (1997) called the value obtained by Ohlson Model recursion value and developed the concept of adjustment value, which is the real option value of a company to change operation.
Research Model
15 Ohlson's (1995) paper does not emphasize the linear information dynamics and the coefficients are directly from regression results. Feltham and Ohlson (1995) improved the original linear information dynamics by separating operating assets and financial assets in a firm. However, the relationship between fundamental value and accounting figures may not be as simple as linear (Burgstahler et al, 1997).
Still, even though earrings and book value are all negative, for shareholders, the company cannot be valued at a negative number. Fundamental value should be the summation of recursion value and adaptation value (Burgstahler et al, 1997). The coefficients can be estimated on a per-share basis as Model 1 and Model 2 or on a company-wide basis as Model 3 and Model 4.
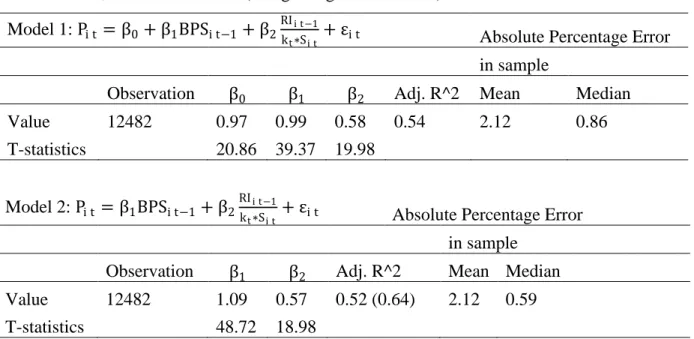
In addition, we can impose additional restrictions on β0 and the command β0=0 as Model 2 and Model 4, for the lack of economic sense of the break in the model (Bukhvalov, Akulaeva, 2014). We want to understand how the book value of equity and the perpetual value of retained earnings affect the underlying value of equity. 17 To compare the quality of different models, this paper uses the mean and the mean absolute percentage error for the sample test.
Absolute error rate is a more intuitive and straightforward measure of the suitability of the model for valuation. Casella (1983) points out that R squared from regression through the origin is not comparable to the usual regression. Moreover, the OLS regression result is more favorable for large firms when the dependent variable is market capitalization.
Discounting Rate
18 premium cross companies, cost of equity of CAPM for each company, a constant rate for all companies over the period. In this article, the discount rate is calculated as the sum of a constant equity risk premium plus the risk-free rate. The author concludes that the real equity risk premium for the mainland Chinese market is 11% and for Hong Kong it is 10.3%.
For risk-free rate, three-month deposit rate is used as risk-free rate for China and the three-month HIBOR (Hong Kong Interbank Offer Rate) is used as risk-free rate for Hong Kong. These two choices correspond to the risk-free rate used in the paper (Zhu and Jie, 2008) for calculating the equity risk premium. In China market the currency is RMB and in Hong Kong the currency is HKD.
Empirical Analysis
- Data Collection
- Mainland China Market Results
- Result Analysis and Discussion
- Hong Kong Market Results
- Pre-Listing Valuation in Hong Kong Market
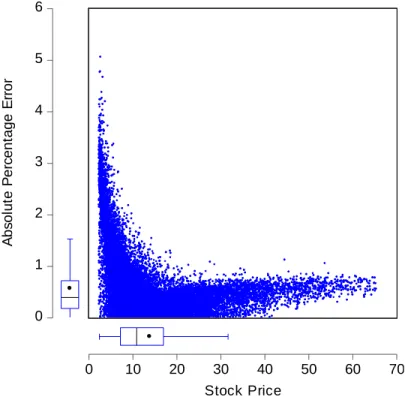
Absolute percentage error distributions and descriptive in-sample and out-of-sample test statistics are presented in Appendix 2, Absolute Percentage Error. We first perform the Welch F test to test whether the mean is equal between all six pairs of absolute percentage error. Distributions of absolute percentage errors of the sample test that have long tails indicate the existence of outliers that affect the mean.
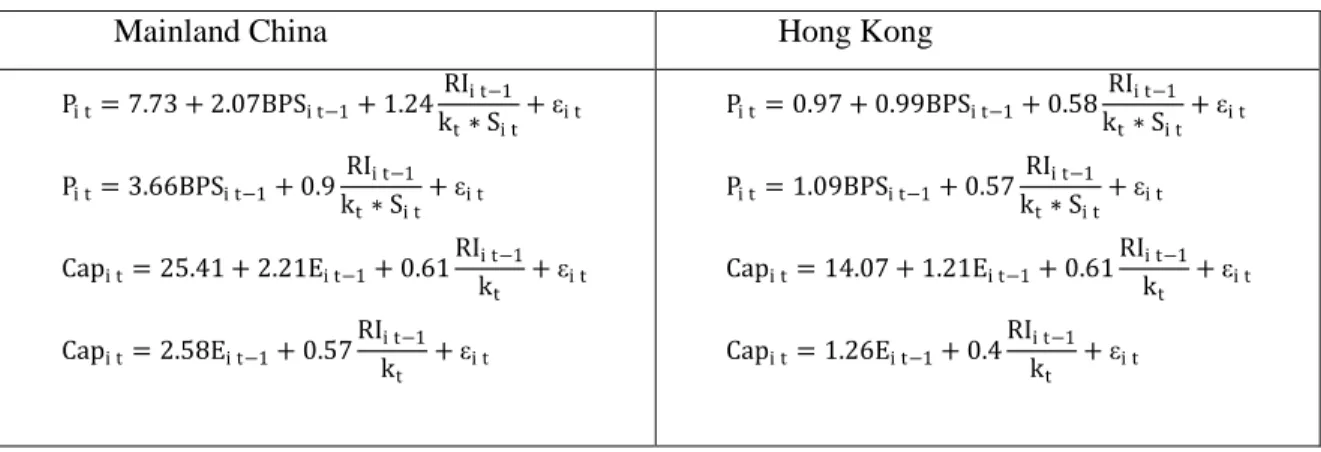
We will compare the sector-level coefficients and preferences with Hong Kong market results in Table 3.4. 23 Absolute percentage errors of both the in- and out-sample tests, models with market capitalization as the dependent variable are even worse. The second model is the absolute percentage error of the sample estimate of market capitalization from Model 4 relative to market capitalization.
For Model 1 and Model 4, most estimates are below the absolute percentage error of 1.5, as the upper inner bound of the boxplot is below 1.5. We perform Welch's F-test to test whether the mean is the same across all 6 pairs of absolute percent error. With the Hong Kong market data, the value of both coefficients is not much different from the empirical result from the Russian data.
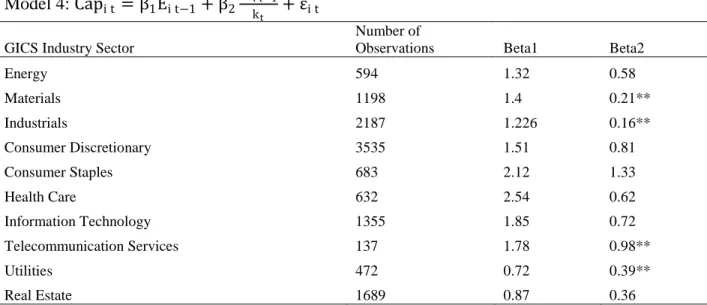
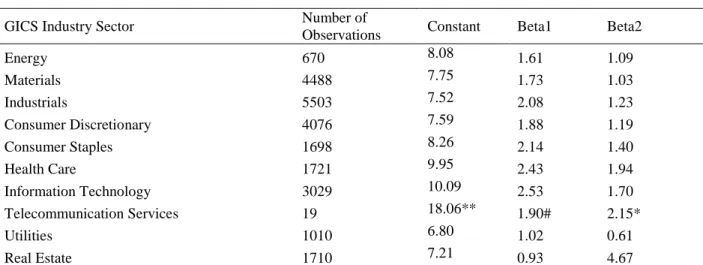
27 Having chosen model 4 as the most appropriate for the Hong Kong market, we can further evaluate the model on an industry basis using model 4 as we have a large sample. There are different methods for listing on the Hong Kong stock exchange: offer for listing, offer for sale, placement, introduction, etc. The model we estimated can be used to evaluate a company before listing on the Hong Kong Stock Exchange.
As shown in Table 5 Pre-Listing of Company Valuation below, we select 22 companies listed on the Hong Kong Stock Exchange in 2016 and applied Model 4 estimated at the whole market level and at the GISC sector level. This finding is consistent with the graphical analysis of absolute percent error for the Chinese mainland sample in Figure 1.
Fundamental Value and A/H Premium
A/H Premium with single factor
The reason is that we need to derive the linear relationship between price discrepancy and fundamental value discrepancy using OLS. In case the share price difference is described as a coefficient, we must also take the division for the underlying value. We can see the distribution of Fundamental Stock Value/Fundamental Value of share A in Appendix 1 Variable Distributions.
For this reason, discrepancy is modeled as the difference in stock price, and the following model is constructed. Empirically, by running the Hausman Test whose null hypothesis is random effect, we choose between fixed and random effects. The Breusch-Pagan Lagrange Multiplier Test is used to choose between pooled regression and random effects.
For H-share, the fundamental value for the whole company is first calculated using Model 4 because Model 4 is the best model for the Hong Kong market. The fundamental value of the H share is equal to the fundamental value of the entire company, divided by the number of shares outstanding. 33 The unit root test for both price difference and fundamental value change are rejected, which means they are stationary.
Based on the results of the Breusch-Pagan LM test, F test and Hausman test, random effects should be assumed. If A share's fundamental value is higher, A share price should be higher than its H share counterpart. Finally, fundamental value difference is a factor that leads to share price difference for dual listed companies on China mainland stock market and Hong Kong Stock Exchange.
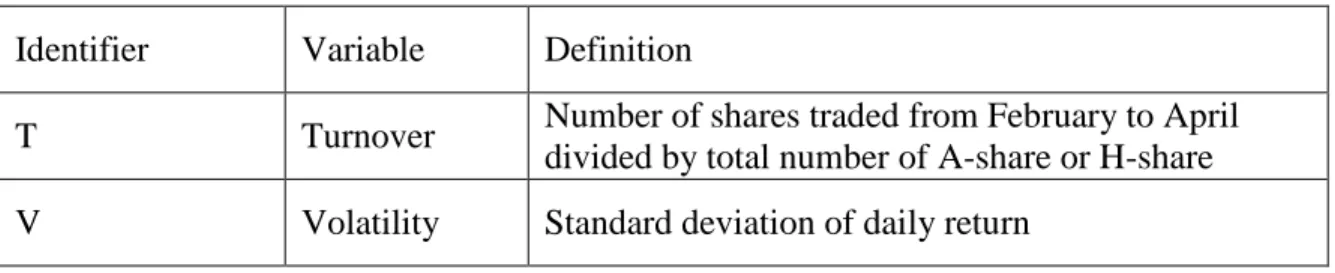
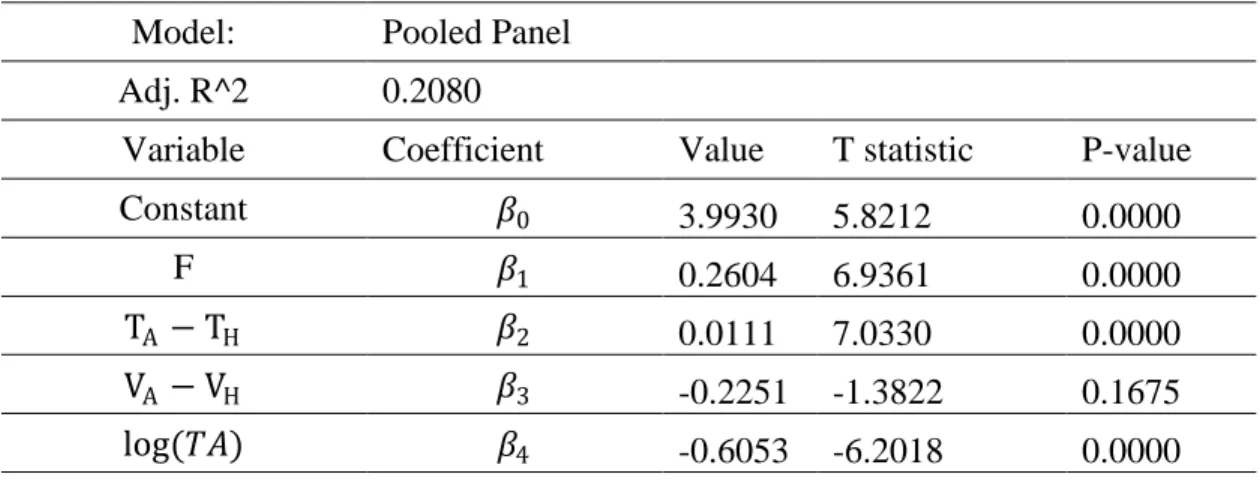
A/H Premium and multi-factors regression
For valuation purposes, this paper selects the best variants to obtain company's fundamental value on each market. In addition, this paper explains the market price difference of dual listed Chinese companies in mainland China market and Hong Kong Stock Exchange with fundamental value difference. This model can be applied to quickly evaluate a large number of companies with a few input parameters as shown in the calculation of fundamental value of dual listed Chinese companies.
34; An Exploratory Study of Valuation Properties of Cross-Listed Firms' IAS and U.S. GAAP Earnings and Book Values." Beaver, John RM Hand and Wayne R. 34; Accruals, Accounting-Based Valuation Models, and the Prediction of Equity Values." Journal of Accounting, Auditing & Economics 20, No. 2014), “Empirical Fundamental Valuation of Russian Companies: Searching For Strategic Value”, Russian Management Journal. 34;An Empirical Assessment of the Residual Income Valuation Model.” Journal of Accounting and Economics 26, no.
34;Financial Liberalization and Interdependence of International Markets: Evidence from China's Stock Market in the Post-WTO Accession Period.". 34;A Comparison of Dividend, Cash Flow, and Earnings Approaches to Stock Valuation." Contemporary Accounting Research 15, no. 34; Accounting information, value relevance and investor behavior in the Egyptian stock market." Review of Accounting and Finance 5, no.
34; A Study on Price Discounting of A Shares by H Shares and Its Influencing Factors." Journal of Financial Researc. 34; Empirical Analysis on A Shares and H Shares of Chinese Listed Companies." Research on Economics and Management, ser. 7636, no. 34; An Empirical Study on the Correlation and Price Difference of A-share and H-share." Journal of Southwest Agricultural University (Social Science Publication no.
Dual Listed Company A/H Premium
Absolute Percentage Error
Variable Distributions
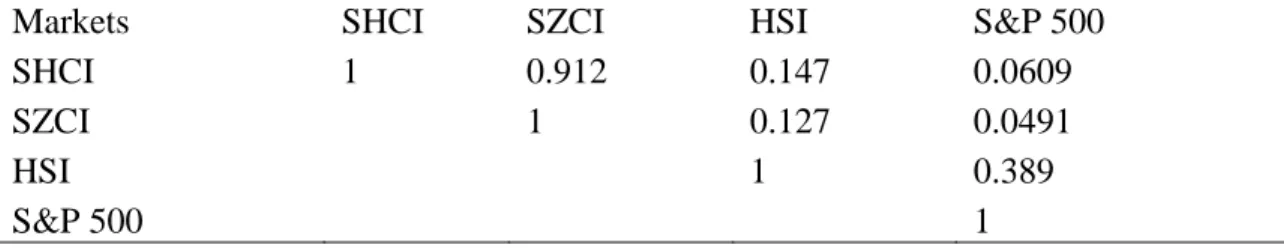
Correlations between Variables