How does corruption hurt growth?
Evidences about the effects of corruption
on factors productivity and per capita income
*Marcos Fernandes Gonçalves da Silva, Fernando Garcia, Andrea Camara Bandeira**
Abstract
Corruption is a phenomenon that plagues many countries and, mostly, walks hand in hand with in-efficient institutional structures, which reduce the effectiveness of public and private investment. In countries with widespread corruption, for each monetary unit invested, a sizable share is wasted, imply-ing less investment. Corruption can also be a burden on a nation’s wealth and economic growth, by driving away new investment and creating uncertainties regarding private and social rights. Thus, cor-ruption can affect not only factors productivity, but also their accumulation, with detrimental conse-quences on a society’s social development.
This article aims to analyze and measure the influence of corruption on a country’s wealth. It is im-plicitly admitted that the degree of institutional development has an adverse effect on the productivity of production factors, which implies in reduced per capita income. It is assumed that the level of wealth and economic growth depends on domestic savings, foster technological progress and a proper educational system. Corruption, within this framework, is not unlike an additional cost, which stifles the “effective-ness” of the investment. This article first discusses the key theories evaluating corruption’s economic consequences. Later, it analyzes the relation between institutional development, factor productivity and per capita income, based on the neoclassical approach to economic growth. Finally, it brings some em-pirical evidence regarding the effects of corruption on factor productivity, in a sample of 81 countries studied in 1998. The chief conclusion is that corruption negatively affects the wealth of a nation by re-ducing capital productivity, or its effectiveness.
Key words: Corruption, economic growth, factor productivity, Institutional Economics, capital accumulation.
JEL Classification: A19, O40, Z00.
* This article was prepared based on research financed by EAESP/FGV-SP’s NPP.
** Marcos F.G. da Silva and Fernando Garcia are associate professors at EAESP/FGV and Andrea C. Bandeira has a
Master’s Degree in Economics by EAESP/FGV and is currently in the Ph.D. program at IPE/USP. Mailing address: Av. 9 de Julho, 2029, 11o. andar, São Paulo, Brasil, CEP:01313-900. E-mails: [email protected], [email protected]
1 Introduction
Corruption is a phenomenon that plagues many countries and, mostly, walks hand in
hand with inefficient institutional structures, which choke the effectiveness of public and
pri-vate investment. In countries with widespread corruption, for each monetary unit invested, a
sizable share is wasted, implying that less investment are made, in fact. Corruption can also be
a burden on a nation’s wealth and economic growth, by driving away new investment and
cre-ating uncertainties regarding private and social rights. Political and institutional risks are always
considered by domestic and international investors. When such risks are high, investment
proj-ects are postponed or even cancelled. In extreme cases, chronic corruption leads countries to a
state of permanent political crises, resulting in overthrown governments and civil wars.1
Thus, corruption can affect not only the productivity of the productive factors but
also their accumulation. These two aspects provide a good idea how damaging endemic and
chronic corruption can be to a society’s wealth, economic growth, and social and human
development. The graph below is a quite naive illustration of the impact brought by
cor-ruption on a nation’s wealth. Using a sample of 81 countries, it shows (a) PPP-adjusted per
capita income, in US$, compared to the index of perceived corruption in 1998; and (b) this
same index compared to average savings rates between 1960 and 1998. The smaller the
perceived corruption in a society, the higher its position in this index, measured from 0 to 1,
and also the greater its per capita income. There is also a positive relation between
invest-ment rate in fixed capital (average during the 90s) and the absence of corruption, showing
how investors react to potential risks in such society.
The aim of this article is to analyze and measure the influence of corruption on the
per capita GDP of an economy. It is implicitly admitted that the degree of institutional
de-velopment impacts negatively on the productivity of the productive factors, implying in
1 This last aspect, linking corruption, political instability and growth, is not discussed in this article. Another
pov-shrinking per capita income of a country2. Intuitively, the argument presented here is as follows. The starting point is the belief that the level of wealth and economic growth, i.e.,
wealth accumulation along time, depend on domestic savings to finance new investments
and technical progress, which in turn allow greater labor effectiveness, and on investments
in education, that also expands labor productivity. Within this framework corruption is not
unlike a cost that reduces the investment “effectiveness”. Everything happens as if the
creation of new wealth for the future necessarily incurs in waste of scarce economic
re-sources. Thus, corruption renders investments and the cost of capital more expensive,
de-manding that the population give up more of its present consumption to achieve economic
growth.
Graph Perceived corruption, per capita income and
average savings rate, selected countries, 1998
Índice de corrupção
1,2 1,0 ,8 ,6 ,4 ,2 0,0
Renda por habitante em idade ativa (US$, PPC)
50.000 40.000 30.000 20.000 10.000 0 ZWE USA SWE PRT MOZ MEX JPN HTI ESP BRA
Índice de corrupção
1,2 1,0 ,8 ,6 ,4 ,2 0,0
Taxa média de poupança (1960
-98) 40 30 20 10 0 ZWE USA SWE ESP PRT MEX JPN HTI BRA
Índice de corrupção
1,2 1,0 ,8 ,6 ,4 ,2 0,0
Renda por habitante em idade ativa (US$, PPC)
50.000 40.000 30.000 20.000 10.000 0 ZWE USA SWE PRT MOZ MEX JPN HTI ESP BRA
Índice de corrupção
1,2 1,0 ,8 ,6 ,4 ,2 0,0
Renda por habitante em idade ativa (US$, PPC)
50.000 40.000 30.000 20.000 10.000 0 ZWE USA SWE PRT MOZ MEX JPN HTI ESP BRA
Índice de corrupção
1,2 1,0 ,8 ,6 ,4 ,2 0,0
Taxa média de poupança (1960
-98) 40 30 20 10 0 ZWE USA SWE ESP PRT MEX JPN HTI BRA
Índice de corrupção
1,2 1,0 ,8 ,6 ,4 ,2 0,0
Taxa média de poupança (1960
-98) 40 30 20 10 0 ZWE USA SWE ESP PRT MEX JPN HTI BRA (a) (b)
Source: World Bank (2000) and Kaufmann, Kraay and Zoido-Lobatón (1999).
2
This article is part of a new trend in social science research, one that studies
corrup-tion using analytical tools provided by economics. There are clear advantages in studying
this phenomenon with this methodology. Corruption involves the search for pecuniary
gains, and it benefits from skewed information and problems in rationality and cooperation.
Political Economy supply a set of tools to analyze institutional evolution and supplement
(or criticize) sociological and anthropological approaches on the issue. To study concepts
such as wealth searching and clientage under the light of economics can be easily achieved
by redefining the agents’ objective function. They can be considered rent-seekers. Ho
w-ever, economic analysis of corruption must be complemented with positive Political
Econ-omy, since the study of social rules and institutions is essential to define the payoffs that
drive the agents’ decision process, in special regarding productive allocation and capital
accumulation.
The second part of this article discusses the main theoretical approaches that
evalu-ate economic consequences of corruption within modern Political Economy. Levalu-ater, in the
third part, the relation among institutional changes, factor productivity and per capita
in-come is analyzed, based on the neoclassical approach to economic growth. Based on this
theoretical model, the fourth part estimates the economic effects of corruption, using a
sample of 81 countries surveyed in 1998. Final remarks on the effects of corruption close
the article.
2 Economic consequences of corruption: three theoretical approaches
Within modern Political Economy three main views try to shed some light on the
economic consequences of corruption. They are complementary among themselves and
form, as discussed below, a theoretical framework for the analysis of the relation among
rules, institutions, motivations of economic agents, corrupt behavior and all their economic
and social consequences3. The first is associated to the theory of rent-seekers; the second, to the economic theory of bribe; and the third, to the relation between economic performance
(efficiency and growth) and corruption.
3
The theory of rent-seekers was developed by Krueger (1974), Tullock (1967, 1990)
and Bhagwati (1982, 1983)4. According to this view, economic agents have a basic motiva-tion: rent-seeking. They try to obtain the highest rent, or income, possible within or without
the rules of economic and social conduct. However, the search for income can imply in
transfers within society, through monopolies or other forms of privileges. The activity
asso-ciated to this search for income is called rent-seeking.
Consider the case of agents who seek rent within the rules of the game, without
violating the law. Imagine the following situation: in a given country, there is a
constitu-tional monopoly that endows a company with the exclusive right to extract and refine
pe-troleum. Traditional theory of imperfect market structures argues that the monopolist has its
excess increased at the expense of a reduction of the consumers’ welfare. Society as a
whole (and that includes managers, workers and shareholders of the monopolist company)
forfeits part of its welfare, since in a monopoly a given part of the installed capacity will
not be used. In theory, except for this dead-weight loss, any transfers between the producer
and consumers should result in zero net losses.
Yet, according to the rent-seekers theory, there is a net loss for this society. The
monopolist company, in order to assure its right to monopoly, must channel productive
resources into advertising and lobbying activities. Or it can also invest human and physical
capital in unproductive work related to political pressure and company image, with the sole
purpose of maintaining the monopoly.
Another example of rent-seeking activity is found in protectionism. In this case,
tra-ditional economic theory considers social costs, in terms of lost welfare, owed to the dead
weight created by a tariff and finds existing transfers from consumers to domestic
produc-ers. Other than the dead-weight, there should be no net losses for society. But, not unlike
the case of monopolies, companies enjoying closed markets employ human and financial
resources in unproductive activities, mainly lobbying.
Rent-seeking activity comprises a competitive market. Several agents try, as much
as possible, to obtain privileges or obtain rent from other groups. However, only some
agents or groups of agents will achieve their goal: the end result implies necessarily in a
4
waste of economic resources. This cost associated to rent-seeking activity has an important
qualitative dimension. Much highly talented human capital is allocated to these
unproduc-tive, yet very profitable, activities. Consequently, rent transfers within a society tend to
penalize talent allocated to productive activities. The result is that this income transfer is
matched by considerable waste of assets and talent: there is a steep cost of opportunity
as-sociated to the rent-seeking activity.
Another additional cost associated to rent-seeking activity is related to rent transfers.
In a competitive society, individuals are remunerated based on their productivity (except
when market imperfections exist). In this society, rent can only be transferred through
pub-lic popub-licies based on technical criteria. However, in a society where rent-seeking activities
prevail, labor remuneration can be reallocated according to the relative power of certain
groups within society. From the standpoint of economic equity, income redistribution
spon-sored by rent-seeking activity may reward the power of influence, rather than merit and
capacity.
Consequently, in a society split among competitive factions, which seek to transfer
rent, the outcome of the social game can have negative results: the costs of rent-seeking
activity are greater than the benefits obtained by some agents or groups. The reason why
agents prefer rent-seeking activities in lieu of productive activities resides in the fact that it
can be more profitable for a skilled and educated technician to work as a lobbyist than as a
scientist or technologist. The rules of the economic, political and social game (institutions,
laws, governmental regulations and moral values, i.e., self-imposed rules) generate the
pay-off system that steers decisions regarding economic resources – both financial and human.
These rules can even force agents to perform rent-seeking activities. One example of this is
overregulation: in many developing countries, the bureaucracy involved in opening a bus
i-ness presents such formidable hurdle that agents are forced to invest resources, in the form
of time and talent, in unproductive activities.
The relation between the theory of rent-seeking and corruption can be found in the
very definition of the objective function of public and private agents and in the incentive
structure prevailing within the society. Theoretically speaking, if allowed, all agents will
that penalize the initiative in some respect. Corrupt and corruptive agents can be modeled
as rent-seeking agents. The difference between them and de facto rent-seekers is that the
corrupt disregard the law.
Evidently, just like in a lottery, much talent and resource will be allocated in
unpro-ductive activities by the rent-seekers. Some will win, many will lose and society as a whole
will be wasting economic resources. Thus, from the economic standpoint, corrupt
competi-tion among interest groups (organized groups of corrupt rent-seekers) creates cost and ine
f-ficiency5.
In developing countries this Political Economy view of corruption tied to the
rent-seeking theory is especially common. Social and development programs are overseen by
public agents facing overwhelming demand for scarce resources. There are generous
incen-tives to receive bribes and to participate, as a rent-seeking agent, in groups of mana
gers-clients. Such a state of affairs brings ominous consequences mainly in poor countries.
This view of corruption, the result of the outlaw rent-seeker, can be complemented
by Political Economy of Bribe (Rose-Ackerman, 1978). The economic study of
bureau-cratic and legal institutions cannot forgo graft and bribery, mainly because of their ties with
the inherent conflict between public goods and the market.
In an economy of perfect competition, exchange relations between private agents
are impersonal and seek to maximize each one’s utility function. A service provider will
sell its work to any other agent as long as the sale is satisfactory from the private
stand-point. Likewise, the buyer of a service will demand it from any agent, provided that the
exchange will bring the most welfare. In a perfect State, comprised of professional
bureau-crats, whose behavior is strictly public, decisions will also not involve any personal criteria.
Public agents simply maximize the social welfare function and provide society with public
goods, in the most efficient way possible.
The world of corruption and graft drifts away from the pure model exactly in an
as-pect relevant to this analysis: the establishment, one way or another, of personal relations
between public and private agents. Bribery can be defined, in spite of generalities, as a
fi-nancial means to transform impersonal relations into personal ones. This is usually done
5
with the intent to illegally transfer rent within a society, misappropriate third-party assets,
or simply try to obtain preferred treatment, as happens in most corruption cases in the lower
administrative levels.
Political corruption, from this perspective, can be described as follows. Public
agents in general and politicians in special take rational decisions. Their key objective is to
be elected, reelected and obtain a flow of income, i.e., the buildup of personal wealth
through the buildup of power. The political market is not perfect and voters do not have full
control over the work of their elected officers. Moreover, much asymmetric information
and the process of political negotiation (log-rolling) creates opportunities for the payment
of lobby services.
When there is some type of control on the behavior of politicians, there is an
im-plicit exchange between the procurement of bribes and the possibility of reelection. If, for
instance, the voters of a representative believe that he is more keen on defending the
inter-ests of some pressure group than in championing those of his voters, chances that he will
not be reelected will grow considerably. However, the graft inherent to the lobby
represen-tation can make up for his loss in the upcoming elections. This control over graft depends
largely on the moral rectitude of each individual politician and of the public interest
re-garding political behavior. While social control cannot fully do away with such ways, it can
restrict them.
In final analysis, under this aspect, corruption is associated to market imperfections.
As a rule, governments are large buyers of capital goods and infrastructure works, whose
prices at times are set not following market logic. Public works involve vast sums of
money, which are handled by a small number of public and private agents. They can create
technical arguments, factual or not, justifying their overcharging, which will provision the
bribe fund to be shared by all parts involved in the misdeed. It is difficult to oversee the
behavior of public agents that take these financial and economic decisions, since
informa-tion is imperfect and at times skewed. This opens the way for corrupinforma-tion.
The third and most recent intervention of economics in the realm of corruption is
credited to Shleifer & Vishny (1993), among others. The key concern is the relation
sprouts with more vigor when (i) institutions create excessive regulation and centralization
of government, and (ii) political institutions are not overseen by a large share of society.
The greatest impact of corruption is its costs in terms of lower growth. Bribes,
un-like taxes, involve distortion in the use of the government structure and, being crime, must
be kept secret. This results in additional costs to obtain bribes necessary for the co-optation
and maintenance of networks of corrupt workers of public organizations, for the
manipula-tion of budget informamanipula-tion, and so on. The result of this corrupmanipula-tion is diminished economic
growth, due to resources allocation to unproductive activities, and the distortion of social
policies aimed at economic development.
There is yet another mechanism by which corruption reduces investment. Foreign
investments in a given country can be jeopardized when public agencies of this country,
controlled by politicians and bureaucrats, demand bribes from private agents in charge of
implementing such projects. Considering that such “informal costs” diminish the
profit-ability of these ventures, foreign investors may prefer to place their money in countries less
plagued with corruption.
The three aspects analyzed in this section lead us to conclude that corruption
cor-rodes a country’s wealth and economic growth through economic inefficiency – by
misallocation of talent and maintenance of power schemes, for instance – and by
discour-aging accumulation of human and physical capital. Moreover, the literature focusing this
issue seems to hold a certain consensus on the notion that corruption affects productivity in
an economy, and therefore the productive factors returns. The following section attempts to
analyze how variables measuring a society’s institutional development can be treated
within the neoclassical framework of economic growth, in order to ascertain the basic
rela-tions between corruption and factor productivity.
3 Institutions, factor productivity and per capita income
The impact of institutional variables on economic growth, particularly regarding
product level and growth, has recently been the subject a much research. The mainstream of
this line of thinking include the concepts developed by the New Institutional Economy.
and institutions6. The main conclusions of these studies can be summarized as follows: (i) institutions that guarantee the property rights are crucial to economic growth; (ii) the degree
of perceived corruption has a negative effect on economic performance; (iii) the trust
be-tween economic agents and civic cooperation has important effects on economic growth
and factor productivity; and (iv) institutional development fosters economic growth and the
convergence of developing nations to the standards of living of developed nations. In the
words of Burki and Perry (1998), “institutions matter”.
The set of studies that discusses the role of institutions in explaining economic
growth is particularly useful in order to help evaluate the impact of corruption on the
wealth of nations and their economic growth. This set is comprised of two groups of
arti-cles: (i) Hall and Jones (1996, 1999) and Jones (2000); and (ii) and Garcia et al (1999,
2001) and Bandeira (2000). These studies differ from the vast majority of work conducted
in this area in two crucial aspects: first, they attempt to develop a simple theoretical
frame-work to evaluate the impact of institutional development indicators on per capita income,
where the causal link between the two phenomena is factor productivity. Second, empirical
analysis is performed based on theoretical propositions, i.e., it is not an ad hoc procedure7. Regarding the second group, an additional aspect can be included: these authors work with
theoretical formulation that allows identification of which productive factors have their
productivity impacted by institutional changes.
This section presents a theoretical analysis of the possible effect of corruption on
product level, considering the impacts of the first variable on factor productivity. From the
perspective of this approach, that would be the main mechanism through which institutional
variables affect a society’s income level. By influencing factor productivity, institutions
would also have indirect impact on accumulation decisions. This article is limited to
ex-ploring the direct mechanism.
6
In addition to the above-mentioned work of Burki and Perry (1998) a study prepared by Barro (1996) investigates the effects of a range of economic and institutional variables on economic growth.
7
In order to develop this analysis, the framework suggested by Garcia et al (2001)
was employed. The basic analysis reference is the aggregated production function, which
defines the relation between aggregated product – by definition identical to rent – and the
stocks of productive factors. This production function, known in the literature as the basis
of the Solow model with human capital – equation (1) – has the following arguments: the
stock of physical capital (K); knowledge (A), which reflects the degree of technological
development of a given economy; and the endowment of human capital (H). This last
vari-able is defined as the stock of workers (L) adjusted to their skill, which is estimated through
average level of education of the labor force (u).
( ) (
α)
−α= 1
. . AH K
Y , where H =eφ.u.L (1)
The starting point is the broad idea that the degree of institutional development can
affect factor productivity in different ways. This produces three theoretical possibilities: (i)
corruption affects only the productivity of capital; (ii) it affects only the productivity of
effective-human capital; and (iii) it affects the productivity of all productive factors, i.e., it
affects the total factor productivity (TFP).
Based on the first hypothesis, called “effective-capital”, it is possible to re-specify
the production function of the Solow model with human capital – equation (1) –
substitut-ing the physical capital for a variable that expresses this factor adjusted to its productivity,
which is determined by the degree of institutional development (I) – equation (2).
Alterna-tively to the effective-capital hypothesis, it is possible to relate the institutional variable
with the productivity of the human capital factor, in relation to the influence of the
knowl-edge on this variable. This hypothesis is called “effective-human capital”. In this case,
hu-man capital is replaced by a variable that expresses this factor adjusted to its productivity,
as shown in equation (3). The last hypothesis considers the effect of the institutional
vari-able on the total factor productivity, which implies that all factors have their productivity
influenced by the institutional structure, as equation (4) shows.
( ) ( )
α −α= 1
AH IK
Y , 0<α<1 (2)
(
)
−α α= 1
IAH K
Y , 0<α <1 (3)
( )
[
α −α]
= 1
AH K I
Considering how the institutional variable is introduced in the production function,
it is easy to understand the role this variable plays in product and income creation. In the
case of equation (2), for instance, the fact that the institutional variable is multiplying the
physical capital means that institutions change the productivity of this productive factor.
Two economies with the same amount of all productive factors may, in this particular
situation, have different production volumes simply because they have dissimilar levels of
institutional development. The more developed economy, under this aspect, will have
greater production, since its capital is more productive.
In the manner suggested by Garcia et al (2001) it is possible to empirically verify
which of the hypotheses below equations (2) and (4) can be refuted, or not. This will allow
to verify if corruption affects productivity of capital, of human capital, or of both. In order
to do so, we can specify an empirical equation that represents the production function, such
as (5)8, which is used to estimate the α, (1 – α), γ and φ coefficients.
(
φ)
−α µα γ
= I K ALe e
Y . . . . .u 1 . (5)
It should be noted that in the empirical equation the most probable specification is
not determined; institutions are attributed a γ coefficient. It is the comparison of this
esti-mated coefficient with the other coefficients which allows us to determine the role of
insti-tutions. If it is not possible to refute the premise that γ is equal to α, then it can be said that
corruption affects capital productivity. It it is not possible to refute the hypothesis that
γ = (1 – α), then it can be said that corruption affects effective-human capital. Finally, if it
is not possible to refute the premise that γ is equal to 1, it can be said that the third
hypothe-sis is valid: corruption affects equally both productive factors, i.e., it affects total factor
productivity.
Before going on to the empirical analysis of equation (5) and the tests of the
subja-cent hypotheses, it is worth mentioning the possibility to evaluate the same properties by
way of a theoretical model that considers the equilibrium of the steady state of the
econ-omy9. Considering the traditional hypotheses of the economic growth models – Mankiw, Romer and Weil (1992), for instance – it is possible to derive from equation (2), where
stitutions are capital effective, a specification which defines the product according to
effec-tive-human capital. The equation is thus rewritten in reduced form, as follows:
( )
α= Ik
y .~
~ (2’)
where ~y =Y A.H, k~ =K A.H and H =eφ.u.L. The capital accumulation equation for this
economy10 can be written, in reduced form, as illustrated below, where sk is the savings rate, n, the population growth rate, g, that of technological innovation and d, the
deprecia-tion rate. k d g n y s
k~& = k.~−( + + ).~
In steady state, variations in the stock of capital per unit of effective-human capital
is zero. Thus we have sk.y~=(n+g+d).k~. By substituting expression (2’) in this equation,
we arrive at the value of k of steady state, given by:
α − α α + + = 1 . * ~ d g n s I k k
This gives us the equation of the product per unit of effective-human capital in
steady state: α − α α − α + + = 1 1 . * ~ d g n s I y k
By defining y* as the product per worker in steady state, we have the following
ex-pression: u k e A d g n s I y φ α − α α − α + + = . . . * 1 1
By linearizing the above equation using the natural logarithm, we have a new
ex-pression for the product per worker:
( )
Y L I sk .ln(
n g d)
lnA .u1 ln . 1 ln . 1
ln + + + +φ
α − α − α − α + α − α =
Assuming, similarly to Mankiw, Romer and Weil (1992), that the accumulation of
knowledge is given by gt t A e
A = 0. and that ln A(0) = a + ε – where a is a technological
10
stant, and that ε is a specific random shock in the economy, and by simplification, t = 0 –
we have the final specification, which includes a variable associated to the institutions,
given by expression (6). An important aspect of this expression is the fact that the
coeffi-cient associated to the degree of institutional development, at least in theoretical term, is
identical to that of the savings effort. Similarly to the tests announced above, if these
coef-ficients are different, there is evidence that the degree of institutional development will not
affect only capital productivity. In this particular case, it is expected that one of the
previ-ous premises will hold sway, whose empirical formulations follow the same construction
logic of equation (6), and are expressed by equations (7) and (8).
( )
(
+ +)
+φ +εα − α − α − α + α − α +
=a I s n g d u
L
Y k .ln .
1 ln . 1 ln . 1 ln (6)
( )
(
+ +)
+φ +εα − α − α − α + +
=a I s n g d u
L
Y k .ln .
1 ln . 1 ln . 1 ln (7)
( )
(
+ +)
+φ +εα − α − α − α + α − +
=a I s n g d u
L
Y k .ln .
1 ln . 1 ln . 1 1 ln (8)
Econometric estimation of these equations was based on expression (9), which
con-siders the three possibilities above, as in the case of equation (5). Empirical evaluation of
the coefficient associated to institutional development variable defines, according to the
theoretical values anticipated by specifications (6), (7) and (8), the hypothesis whose
asso-ciated probability is the highest: in this particular case, whether corruption affects only
pro-ductivity of the physical capital factor, whether it affects exclusively the propro-ductivity of
human capital or whether it has an overall impact on the productivity of the economy.
( )
Y L =β +β .lnI+β .lnsk −β .ln(
n+g+d)
+β .u+εln 0 1 2 3 4 (9)
4 Evidence regarding the effects of corruption on factor productivity
Econometric estimation performed in this section was based on data of a sample of
81 economies for 1998. The set of countries was defined by the availability of data
re-garding the variables specified in the previous section. Only nations that had quality
infor-mation for both sets of regression – production functions and steady state equations – were
included. Indicators of the degree of perceived corruption are presented in Kaufmann,
The remaining variables of the theoretical models were built on information from World
Development Indicators 2000 – World Bank (2000).
As a hypothesis, a constant and equal depreciation rate was considered for all
coun-tries (3% per year). In addition, a technological innovation rate of 2% per year was also
assumed, constant and identical for all economies. Regarding the index measuring the
de-gree of perceived corruption, a change in the original variable was applied, in order to
re-strict these indicators to the interval between 0 and 1 – zero meaning the country with the
highest level of corruption. This procedure allowed an estimate of factor productivity net of
corruption, which is the case where the institutional variable takes on the highest value of
the scale (1). Therefore, countries with higher corruption would have less productivity,
which holds percentage relations with the factor productivity of the country with the
small-est corruption, as shown in the scale 11.
To evaluate the effects of corruption on factor productivity, two alternative
estima-tion methods were employed, which are associated to the very characteristics of the
equa-tions in question. Estimation of equation (5) applied the Levenberg-Marquardt non-linear
regression model and that of equation (9) the Ordinary Least Squares model. Both estimates
considered the reduced forms of the equation, wherein the dependent variable is the product
per working age inhabitant (population between 15 and 65 years of age).12
In the case of the econometric model represented by expression (5), it was necessary
to build a series of capital stock for the sample countries. To achieve this, the method
sug-gested by Nehru and Dhareshwar (1993) was used. It employs series of gross investment
and aggregated product growth to estimate the capital stock in a given moment in time,
which corresponds to the average point of the period considered. This article used data
from 1990 to 1998, which imply estimates of capital stock for 1994. This stock was
up-dated until 1998 using the perpetual inventory method.
Regarding the estimation using the non-linear regression method, a set of three
re-gressions was estimated. First, expression (1) was estimated, not considering human
11
Hall and Jones (1999) have adopted this procedure to compare degrees of technological development in a sample of countries.
12
tal, i.e., the production function of the Solow model. Next, the human capital variable was
incorporated and equation (1), strictly speaking, was estimated. These two estimates are
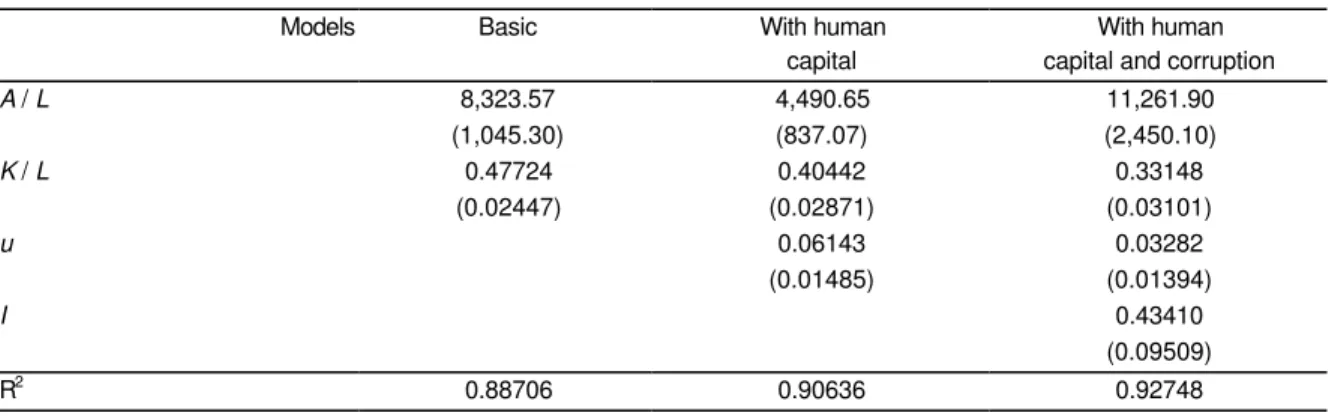
useful as references to the model in question, expressed by equation (5). Table 1 shows the
main results of the estimations.
Table 1 Estimation of the production function in intensive form
Non-linear regressions using the Levenberg-Marquardt* method
Models Basic With human With human
capital capital and corruption
A / L 8,323.57 4,490.65 11,261.90
(1,045.30) (837.07) (2,450.10)
K / L 0.47724 0.40442 0.33148
(0.02447) (0.02871) (0.03101)
u 0.06143 0.03282
(0.01485) (0.01394)
I 0.43410
(0.09509)
R2 0.88706 0.90636 0.92748
Note: (*) the numbers in parentheses are standard errors of the estimates.
The models shown in table 1 are quite important for our discussion. First, it can be seen
that the introduction of a variable that adjusts labor productivity to the average education of
the labor force significantly improves the R2 of the production function estimated. The
al-ready high R2 rises further and, most important of all, the estimated value of the α
parame-ter drops. According to some authors, an α estimate near 1/3 can be expected – Mankiw,
Romer and Weil (1992), for instance – which reveals that this coefficient is overestimated
in the basic model. The same happens when the degree of perceived corruption is
intro-duced in the model: R2 rises to almost 93% and the α coefficient is reduced to a value close to that expected (0.33148).
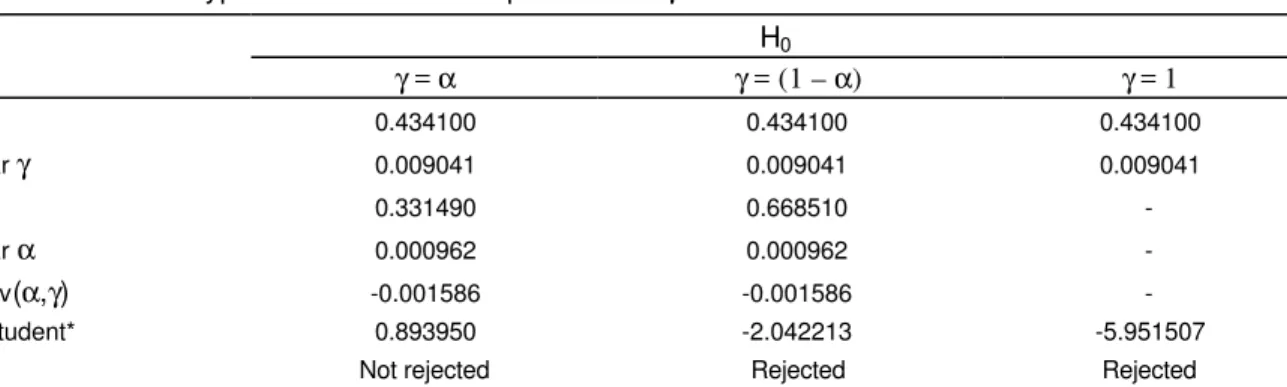
The estimated value of α comes close to the value of γ, suggesting that corruption is a
phenomenon that affects only the productivity of capital. From the statistical perspective,
tests can be performed to verify which hypotheses can be refuted: (i) γ = α; (ii) γ = (1 – α);
and (iii) γ = 1. In fact, the hypothesis tests presented in table 2 give evidence that the only
hypothesis not rejected is the one which states that corruption affects only the capital
Table 2 Hypothesis tests for the parameters γ and α
H0
γ = α γ = (1 – α) γ = 1
γ 0.434100 0.434100 0.434100
Varγ 0.009041 0.009041 0.009041
α 0.331490 0.668510
-Varα 0.000962 0.000962
-Cov(α,γ) -0.001586 -0.001586
-t-student* 0.893950 -2.042213 -5.951507
H0 Not rejected Rejected Rejected
Note: (*) for comparison purposes, the t-table is 2.000, to a significance level of 5%.
Table 3 shows the result of the estimation of the steady state equation using the OLS
regression model. A set of three regressions was also estimated: expression (9),
disregard-ing human capital and institutions, i.e., the basic equation of Solow model’s; the previous
regression with the human capital variable; and equation (9), strictly speaking. Similarly to
the previous case, these estimates serve only as references for the model under study.
In spite of a relatively high adjusted R2, the first model appearing in table 3, similarly
to the non-linear regression, overestimates the α coefficient, which in that particular case
reached a value near 0.45. The introduction of average years of schooling, adjusting labor
productivity, expanded the value of the adjusted R2 and improved statistics associated to
residuals as well as the α estimate. The introduction of the index that measures the degree
of perceived corruption also had positive effects: the adjusted R2 rises, reaching a value of
α closer to the expected (near 1/3).
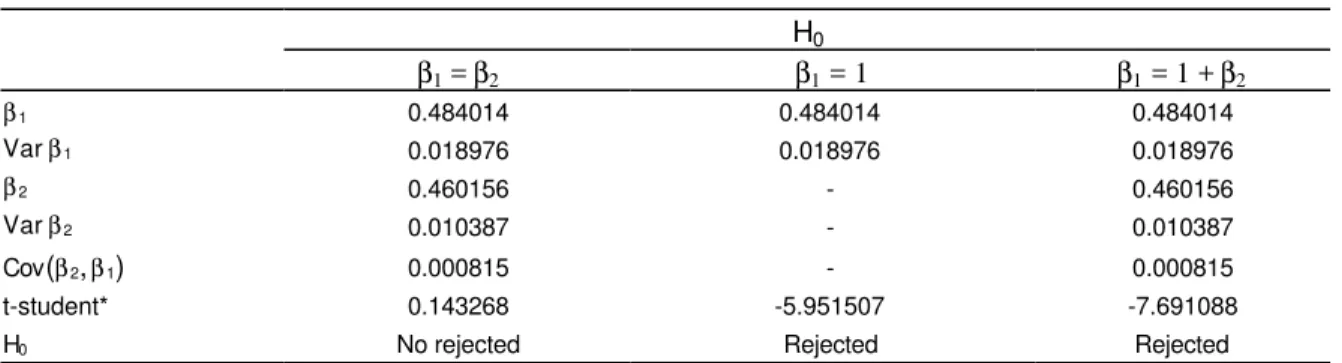
The estimate value of the coefficient associated to corruption (0.484) is also close to
the value of the coefficient associated to savings rate (0.460), a result consistent with the
premise that corruption affects capital productivity. The hypotheses that must be verified, in
this case, are the following: (i) β1 = β2; (ii) β1 = 1; and (iii) β1 = 1 + β2. These hypotheses tests are presented in table 4. Again, the tests show that the only non-rejected hypothesis is
the effective-capital premise. This result confirms the previous one and clearly identifies
Table 3 Estimation of product per worker of steady state Regressions by Ordinary Least Squares*
Models Basic With human With human
capital capital and corruption
Constant 14.043 10.650 9.731
(1.034) (1.010) (0.978)
lnsk 0.814 0.439 0.460
(0.110) (0.109) (0.102)
ln(n+g+d) -3.761 -2.057 -1.239
(0.449) (0.459) (0.488)
u 0.186 0.139
(0.030) (0.031)
I 0.484
(0.138)
implicit α 0.449 0.305 0.315
adjusted R2 0.723 0.813 0.837
DW 1.790 1.914 2.029
Note: (*) the numbers in parentheses are the standard errors of the estimates.
Table 4 Hypotheses tests on the parameters β1 and β2
H0
β1 = β2 β1 = 1 β1 = 1 + β2
β1 0.484014 0.484014 0.484014
Varβ1 0.018976 0.018976 0.018976
β2 0.460156 - 0.460156
Varβ2 0.010387 - 0.010387
Cov(β2, β1) 0.000815 - 0.000815
t-student* 0.143268 -5.951507 -7.691088
H0 No rejected Rejected Rejected
Note: (*) for comparison purposes, the t-table is 2.000, to a significance level of 5%.
5 Final remarks
The theoretical discussion and econometric estimates described in the previous sections
allow us to make some comments on the impact of corruption on a nation’s wealth. The
first issue is that corruption seems to be a phenomenon that reduces capital productivity.
This would be, according to the analysis developed, the chief mechanism by which
corrup-tion reduces the product per worker (or per capita) in an economy. It is interesting to point
out that tests performed by Garcia et al (2001), for another set of institutional development
indicators – such as an regulatory framework or political stability – identify groups of
in-stitutions that fit the effective-human capital and total factor productivity hypotheses. This
enables us to state that not all institutions are capital effective, i.e., it is possible to
Two other aspects related to loss of economic efficiency are important: (i) the reduction
in potential income; and (ii) the effects on the long-term interest rate (the cost of capital).
First, a loss in income is evident, arising from diminishing capital productivity, caused by
corruption. For the average of the 81 countries comprising the sample, the statistical model
provides income per worker close to US$14,601.74 in 1998. If all countries in the sample
had the same index of perceived corruption seen in Denmark – the top ranking country in
our scale – average income per worker in the sample would jump to US$18,328.15, or
about 26% more income. This implies in an average waste of income of US$3,780.41 per
worker, for the sample countries.
In the Brazilian case, in particular, waste is even more blatant, since the country is
be-low the average rate of corruption in the sample of countries. For Brazil, the same statistical
model provides income per worker close to US$12,145.34 in 1998. If, however, the country
had a index of perceived corruption close to that of Denmark, income per worker would be
US$17,353.55, implying in 43% economic growth. This means a waste of income of
US$5,208.21 per Brazilian worker, or alternatively, a US$2,840.81 drop in per capita
in-come.
In addition to this direct effect on the availability of goods and services in the
econo-mies, corruption also has direct impact on the long-term interest rate, since graft affects
capital productivity. Considering that economies equal the returns of productive factors to
their respective productivity, the statistical model infers an interest rate net of corruption
costs close to 25.4% per annum, for the average of these 81 nations. When the effects of
corruption are taken into consideration, this rate leaps to 78.7% for the average of these
economies. In the case of developed nations – the case of Sweden, Switzerland and New
Zealand, for instance – the difference between the interest rates is reduced to less than 2%.
On the other hand, in poor or developing nations, this gap is considerably wider, since
in-dexes of perceived corruption are also higher. Brazil is a good example of this. The
econometric model shows a long-term interest rate close to 28.8% per annum, for 1998,
whereas if the index of perceived corruption were higher, say that of Denmark, the interest
Statistical appendix
Table Data on economic and institutional variables
Country GDP per
worker, 1998 (US$, PPP)
Capital per worker, 1998 (US$, PPP)
Saving rate
(1960-98) PopulationGroutw (1960-98)
Mean years of scholling, labor force (1995)
Perceived Corruption Index
Algeria 8.136,06 18.256,50 30,79 2,72 4,83 0,1864
Argentina 19.284,95 32.934,69 22,44 1,49 8,46 0,3497
Australia 33.433,75 91.107,63 23,88 1,60 10,67 0,8572
Austria 34.077,64 176.806,93 26,30 0,36 8,05 0,8182
Bangladesh 2.400,58 1.351,22 10,61 2,38 2,41 0,3457
Belgium 35.059,20 143.255,27 21,15 0,30 9,10 0,6057
Benin 1.715,42 1.789,87 3,57 2,84 2,14 0,2127
Bolivia 4.044,78 3.684,32 16,30 2,30 5,31 0,3055
Botswana 11.136,49 19.142,73 26,22 3,15 5,86 0,5688
Brazil 10.190,01 26.712,76 21,10 2,19 4,45 0,4395
Cameroon 2.812,48 6.985,57 19,16 2,65 3,37 0,1251
Canada 34.591,65 103.042,51 23,05 1,39 11,39 0,9801
Chile 13.662,58 12.757,69 19,59 1,77 7,25 0,7024
China 4.594,33 2.364,82 31,57 1,64 6,11 0,3458
Colombia 9.677,14 8.620,47 19,51 2,35 4,96 0,2913
Costa Rica 9.691,51 13.006,13 18,89 2,94 5,77 0,5800
Denmark 36.011,05 141.718,63 24,28 0,38 9,39 1,0000
Dominican Rep. 7.454,57 8.049,33 14,35 2,50 4,66 0,2148
Ecuador 4.945,60 7.520,51 19,21 2,69 6,15 0,2023
Egypt, Arab Rep. 5.095,19 4.047,86 13,05 2,30 4,99 0,3516
El Salvador 6.836,18 5.446,67 9,83 2,27 4,70 0,3283
Fiji 6.695,09 9.150,41 16,86 1,85 8,08 0,6422
Finland 31.166,99 136.677,39 25,79 0,40 9,65 0,9880
France 32.304,62 146.596,12 23,50 0,67 7,42 0,7709
Gambia, The 2.654,38 1.648,28 4,39 3,32 1,95 0,4189
Ghana 3.254,91 1.905,80 8,78 2,67 3,75 0,3424
Greece 20.749,27 64.420,33 17,62 0,62 8,32 0,6471
Guatemala 6.617,50 5.232,03 10,85 2,67 3,25 0,2022
Guyana 5.235,70 5.435,46 19,82 1,06 6,00 0,4189
Haiti 2.516,86 2.244,40 3,21 1,85 2,83 0,2793
Honduras 4.482,23 4.950,08 16,73 3,15 4,50 0,1701
Hong Kong, China 29.038,56 125.224,15 29,76 2,08 9,29 0,7793
Hungary 15.001,51 54.607,05 27,58 0,03 8,83 0,5901
Iceland 38.828,42 136.144,85 23,41 1,17 8,48 0,9192
India 3.416,44 1.565,57 18,47 2,16 4,52 0,3412
Indonesia 4.152,17 4.360,83 23,41 2,06 4,55 0,2078
Iran, Islamic Rep. 8.735,99 7.339,53 27,03 2,82 4,73 0,1945
Ireland 32.480,34 39.092,02 19,61 0,71 9,08 0,8480
Italy 30.113,85 115.127,10 24,21 0,36 6,85 0,6410
Jamaica 5.496,84 18.629,02 21,29 1,21 5,02 0,3925
Table Data on economic and institutional variables
Country GDP per
worker, 1998 (US$, PPP)
Capital per worker, 1998 (US$, PPP)
Saving rate
(1960-98) PopulationGroutw (1960-98)
Mean years of scholling, labor force (1995)
Perceived Corruption Index Kenya 1.860,09 1.771,54 16,99 3,36 4,01 0,2477 Korea, Rep. 18.853,13 48.697,64 23,73 1,64 10,56 0,4670 Malawi 1.021,24 927,48 7,49 2,92 2,70 0,3713 Malaysia 13.296,68 21.903,91 31,31 2,67 6,49 0,5953 Mali 1.370,14 1.698,14 3,39 2,37 0,76 0,2952 Mauritius 12.221,40 17.032,02 19,29 1,49 5,79 0,5150 Mexico 12.534,79 20.590,76 21,26 2,54 6,96 0,3490 Netherlands 32.528,36 118.642,72 25,49 0,83 9,12 0,9722 New Zealand 26.332,12 93.504,09 23,17 1,24 11,49 0,9854 Nicaragua 3.963,58 3.456,63 8,57 3,03 4,09 0,1977 Norway 40.608,33 182.193,84 31,01 0,56 11,71 0,8803 Pakistan 3.150,84 1.715,01 9,75 2,81 3,92 0,2159 Panama 8.410,10 13.072,77 23,71 2,39 8,36 0,2999 Papua N.Guinea 4.070,23 7.381,59 13,92 2,33 2,58 0,1930 Paraguay 7.598,68 10.771,86 17,33 2,78 6,10 0,1646 Peru 7.054,53 14.713,13 23,64 2,44 7,31 0,3700 Philippines 6.016,31 6.073,02 20,25 2,68 7,88 0,3622 Poland 11.268,35 17.109,02 25,13 0,71 9,64 0,5570 Portugal 22.121,42 63.206,45 19,27 0,29 5,47 0,7535 Senegal 2.496,14 3.121,18 5,73 2,78 2,39 0,3602 Singapore 34.103,35 108.435,08 28,14 2,04 6,72 0,9509 South Africa 13.725,83 20.050,61 21,44 2,31 6,03 0,5048 Spain 23.676,84 80.017,21 22,63 0,68 6,83 0,7525 Sri Lanka 4.498,57 3.198,11 13,95 1,70 6,45 0,3904 Swaziland 6.969,51 10.432,24 23,60 2,96 5,63 0,4259 Sweden 32.300,27 146.757,52 21,85 0,44 11,23 0,9882 Switzerland 37.559,91 321.232,83 27,85 0,74 10,31 0,9845 Syrian Arab Rep. 5.301,30 6.390,03 11,61 3,23 5,48 0,2105 Tanzania 926,66 1.069,61 1,50 3,06 2,68 0,1740 Thailand 7.977,43 15.076,05 25,57 2,24 6,08 0,3794 Togo 2.680,16 1.774,29 17,16 2,88 3,15 0,3584 Trinidad&Tobago 11.298,65 21.239,23 27,74 1,12 7,44 0,5621 Tunisia 8.694,71 10.753,70 25,14 2,11 4,53 0,4294 Turkey 9.879,67 13.579,56 15,92 2,22 5,12 0,3295 Uganda 2.191,10 787,94 7,76 3,10 3,37 0,2979 United Kingdom 31.218,16 95.673,00 17,71 0,32 9,09 0,8857 United States 44.951,37 109.192,62 18,26 1,07 11,89 0,8046 Uruguay 13.777,60 15.919,08 16,92 0,68 7,31 0,5402 Venezuela, RB 9.544,99 18.555,83 30,61 2,99 6,69 0,2278 Zimbabwe 4.810,24 4.413,09 17,36 2,99 5,19 0,3377 Total 14.103,04 45.351,25 19,41 1,92 6,34 0,4899
Bibliography
Ades, A. & Di Tella, R. The causes and con-sequences of corruption: A review of re-cent empirical contributions. in Liberali-zation and the New Corruption (Harriss-White, B. & (Harriss-White, G. , eds.). IDS
Work-ing Papers, 27, April, 1996.
Alatas, S. H. Corruption: Its nature, causes
and functions. Gower Publishing Group.
1990.
Bandeira, A.C. Reformas econômicas, mu-danças institucionais e crescimento na
América Latina. Dissertação de Mestrado.
EAESP/FGV-SP. São Paulo. Dezembro. Mimeo. 2000.
Barro, R. & Lee, J. International Measures of Schooling Years and Schooling Quality.
American Economic Review, 86, 218-223.
1996.
Barro, R., Lee, J. (2000). International data on educational attainment updates and im-plications. NBER Working Paper, No. 7911.
Bhagwati, J. Directly-unproductive profit-seeking activities. Journal of Political
Economy, October. 1982.
Bhagwati, J. DUP activities and rent-seeking. In Kyklos, 36, 1983.
Boycko, M., Shleifer, A. & Vishny, R.
Pri-vatizing Russia. MIT Press. 1995.
Buchanan, J. M. & Tullock, G. The calculus
of the consent. Michigan University Press,
1965.
Burki, S. & Perry, G. Beyond the Washington
Consensus: Institutions Matter.
Wash-ington, D.C.: World Bank. 1998.
Cartier-Bresson, J. The economics of corrup-tion. in Porta, D. D. & Meny, Y. (eds.).
Democracy and corruption in Europe.
Pinter. 1997.
Fiorentini, G. & Peltzman, S. (eds.). The
eco-nomics of organised crime. Cambridge
University Press. 1995.
Garcia, F., Goldbaum, S. e Bandeira, A.C.
Como as instituições importam? A avalia-ção dos impactos de variáveis
institucio-nais sobre a eficiência econômica.
Mi-meo. 2001.
Garcia, F., Goldbaum, S., Vasconcellos, L. & Rebelo, A. Instituições e Crescimento: a hipótese do capital-efetivo. Textos para
Discussão, No. 81. EAESP/FGV-SP. São
Paulo. Novembro. 1999.
Hall, R. & Jones, C. The Productivity of Na-tions. NBER Working Paper, No. 5812. 1996.
Hall, R. & Jones, C. Why do some countries produce so much more output per worker than others? Quarterly Journal of Ec
o-nomics, 114 (1), 83-116. 1999.
Hampton, M. P. Where currents meet: The offshore interface between corruption, of-shore finance centers and economic de-velopment. in Liberalization and the New Corruption (Harriss-White, B. & White, G. , eds.). IDS Working Papers, 27, April, 1996.
Harriss-Withe, B. & White, G. Liberalization and corruption: Resolving the paradox. in Liberalization and the New Corruption (Harriss-White, B. &. , eds.). IDS Working
Papers, 27, April, 1996.
Jones, C. Introdução à Teoria do
Cresci-mento Econômico. Rio de Janeiro: Editora
Campus. 2000.
Jones, C. The Argentine debate. in Liberali-zation and the New Corruption (Harriss-White, B. & (Harriss-White, G. , eds.). IDS
Work-ing Papers, 27, April, 1996.
Kaufmann, D., Kraay, A. e Zoido-Lobatón, P. Aggregating Governance Indicators.
Pol-icy Research Working Paper n.2195.
Khan, M. A typology of corrupt transactions in developing countries. in Liberalization and the New Corruption (Harriss-White, B. & White, G. , eds.). IDS Working Pa-pers, 27, April, 1996.
Klitgaard, R. Controlling corruption. Univer-sity of California Press. 1991.
Kong, T.Y. Corruption and Its institutional foundations: The experience of South Corea. in Liberalization and the New Cor-ruption (Harriss-White, B. & White, G. , eds.). IDS Working Papers, 27, April, 1996.
Krueger, A.O. The political economy of rent-seeking. in American Economic Review., 64. 1974.
Kurer, O. Clentelism, corruption and the allo-cation of resources. in Public Choice. 77, 1993.
Mankiw, N., Romer, D. & Weil, D. A contri-bution to the empirics of economic growth. Quarterly Journal of Economics, 107 (May), 407-438. 1992.
Mbaku, J.M. Bureacratic corruption as a rent-seeking behaviour.in Konjunkturpolitik, 1992.
Nehru, V. & Dhareshwar, A. A new data base on physical capital stock: sources, meth-odology and results. Revista de Análisis
Económico, Vol. 8, No. 1 (Junio), 37-59.
1993.
North, D. Institutions, Institutional Change
and Economic Performance. UK:
Cam-bridge University Press. 1990.
North, D. Structure and Change in Economic
History. New York: W.W.Norton &
Company. 1981.
Porta, D. D. & Meny, Y. (eds.). Democracy
and corruption in Europe. Pinter. 1997.
Porta, D. D. The vicious circles of corruption in Italy. in Porta, D. D. & Meny, Y. (eds.)
Democracy and corruption in Europe.
Pinter. 1997.
Rose-Ackerman, S. Corruption: a study in
political economy. Academic Press. 1978.
Shleifer, A. & Vishny, R.W. Corruption.
Quarterly Journal of Economics, August,
1993.
Shleifer, A. & Vishny, R.W. Politicians and firms. Harvard Institute of Economic Re-search (Discussion Paper 1686). June, 1994.
Sidel, J.T. Siam and Its twin? Democratiza-tion and Bossism in contemporary Thai-land and the Philipines. in Liberalization and the New Corruption (Harriss-White, B. & White, G., eds.). IDS Working Pa-pers, 27, April, 1996.
Silva, M.F.G. Instituições e desempenho
eco-nômico. Instituto Fernand Braudel de
Economia Mundial. 1994.
Silva, M.F.G. A economia política da corrup-ção. Relatório de Pesquisa número
03/1995, Núcleo de Pesquisas e Public
a-ções da Fundação Getúlio Vargas. 1995. Silva, M.F.G. Economia política da
corrup-ção. Estudos Econômicos da Construção, n. 2, 1996.
Silva, M. F. G.. Economia política da corrup-ção. Estudos Econômicos da Construção, n. 3, 1996.
Silva, M.F.G. O livro negro da corrupção (resenha). in Revista de Economia Políti-ca, vol.6, Abril/Junho, 1996.
Silva, M.F.G. Políticas e governo e planeja-mento estratégico como problemas de es-colha pública – Parte I. Revista de
Admi-nistração de Empresas. EAESP/FGVSP.
Vol. 36, 3, 1996.
Silva, M. F. G. Políticas e governo e plane-jamento estratégico como problemas de escolha pública – Parte II. Revista de
Ad-ministração de Empresas.
EAESP/FGVSP. Vol. 36, 4, 1996.
Solow, R. A Contribution to the Theory of Economic Growth. Quarterly Journal of
Economics, 70 (Feb), 65-94. Reimpresso
in Stiglitz e Uzawa (1969). 1956.
Solow, R. Technical Change and the Aggre-gate Production Function. Review of Ec
o-nomics and Statistics, 39 (Aug), 312-320.
Temple, J. The New Growth Evidence.
Jour-nal of Economic Literature, Vol. XXXVII
(Mar), 112-156. 1999.
Theobald, R. Corruption, development and
underdevelopment. MacMillan. 1990.
Tollison, R. D. Rent seeking: a survey. in
Kyklos, 35, 1982.
Tullock, G. Rent-seeking. Edward Elgar. 1993.
Tullock, G. The economics of special priv
i-lege and rent-seeking. Kluwer Academic
Press. 1990.
Tullock, G. The welfare costs of tariffs, mo-nopolies, and theft. Western Economic
Journal, 5. 1967.
White, G. Corruption and market reform in China. in Liberalization and the New Cor-ruption (Harriss-White, B. & White, G. , eds.). “IDS Working Papers”, 27, April de 1996.