Title: Teaching Crossroads: 12th IPB Erasmus Week
Editors: Elisabete Silva, Clarisse Pais, Luís S. Pais
Publisher: Instituto Politécnico de Bragança · 2017 5300-253 Bragança · Portugal
Tel. (+351) 273 303 200 · Fax (+351) 273 325 405 www.ipb.pt
Development: Serviços de Imagem do Instituto Politécnico de Bragança
Cover design: Soraia Maduro
Number of copies: 50
ISBN: 978-972-745-225-5
Índice
Elisabete Silva, Clarisse Pais, Luís S. Pais
Preface ... 7 Economy and Management ... 11 Marcin Bogdański
Regional development in Poland ... 13 Małgorzata Okręglicka
Management of current assets in the Polish corporate sector – selected aspects ... 31 Elzbieta Broniewicz
Comparison of environmental protection costs and revenues in Portugal and Poland ... 47 Juan Antonio Torrents Arévalo
Strategy management ... 59 Health ... 79 Robert Florkowski
Person-centered approach and rehabilitation.
Case of power struggle between paradigms: Medical vs Rogerian ... 81 Kamila Misiakiewicz-Has
Elisabete Silva, Clarisse Pais, Luís S. Pais 6
Mathematics ... 113 F. T. Pachón-García
A procedure to check the mathematical skills of students in Secondary School ... 115 Mechanical and electrical engineering ... 135 Alexandre Pereira
Introduction to soft matter ... 137 Mariana-Rodica Milici, Laurentiu-Dan Milici
The resonance phenomenon: condition, consequences, practical applications ... 145 Intensive Programmes/Erasmus+ Mobility of Individuals ... 169 Cristina Mesquita
Preface
Elisabete Silva, Clarisse Pais, Luís S. Pais The Editors
We have to start off this preface by congratulating the IPB for its achievement. It has been positioned in the top 50 best Higher Education Institutions in the area of Food Technology and Science by the renowned Shanghai ranking. For 4 years in a row the IPB has been considered the best Polytechnic Institute in Portugal by the U-Multirank. Therefore, we have to take our hat off to the IPB.
It goes without saying that our compliment is also addressed to the authors, reviewers and everyone who made this publication possible. This is now the 6th
number of Teaching Crossroads which started in 2012 when we came up with the idea of publishing research work presented in the Erasmus Weeks endorsed by the IPB. Since then we have had over 40 articles published and over 6,000 downloads. Actually, the top five countries doing downloads include France, Germany, Sweden, The Netherlands and the USA.
We aim to reach not only other researchers but also students who can find relevant information in the articles for their areas of study. Not only do we have a clear, well-structured publication to make it more appealing to the reader, but also we look for interesting and in-depth discussions, ideas and projects to promote serious research work developed in Europe. This has been our main motto since we started.
Elisabete Silva, Clarisse Pais, Luís S. Pais 8
the three last previous numbers, we have included the specific area on International mobility, Intensive Programmes and Erasmus+.
To entice you to read these informative and thoughtful articles, we highlight some of the main ideas that the authors delved into in their research works.
Marcin Bogdanski’s research focuses on regional development in Poland. The study covers the period between 2000 and 2014 throughout which the author analysed the level of economic development in Polish provinces. Moreover, the author reflects on the ineffectiveness of EU cohesion policy aiming at economic convergence within the EU member countries.
Malgorzata Okreglicka presents a study which analyses the selected aspects in the area of current assets management, such as trade credit and inventories, in a varied and large number of Polish enterprises. The statistical work developed is of considerable advantage as it will allow a comparison between the diverse values obtained among the different companies and therefore this reveals crucial for the improvement of management methods and tools.
Elzbieta Broniewicz compares environmental protection costs and revenues in Portugal and Poland bearing in mind the domains of environmental protection and economic sectors. Detailed and accurate survey results are shown and by doing so the author calls our attention to the importance of environmental protection and the need for government expenditure in this specific field. This study also illustrates how the world economy influences government expenditure in environmental protection both in Portugal and Poland which has been decreasing over the last three years.
Juan Antonio Torrénts Arévalo’s study is rather valuable as it indicates a guideline about strategy management useful for any company. The author presents and describes several strategic methods, e.g. SWOT and Porter, and all the process linked to them, namely the definition of objectives, the analysis of the competitive environment and the internal organisation of companies, just to name a few. This study also focuses on the performance of Spanish economy in 2011.
Teaching Crossroads: 12th IPB Erasmus Week 9
Kamila Misiakiewicz-Has explores the topic of fertility in males. The author provides scientific data resulting from experiments performed in rats treated with endocrine-disrupting chemicals. These substances proved to confirm they alter endogenous hormones causing thus major influences on the estrogen–androgen imbalance in the male reproductive system.
F.T. Pachón-García and A. Berenguer-García present a study carried out in secondary schools with the purpose of checking students’ mathematical skills at this level of education. The procedure chosen to conduct the study was based on math-ematical tests whose results were then compared with national data and analysed. Taking into account the results obtained the authors present some innovative solu-tions to improve deficiencies that students have had in specific mathematical areas.
Alexandre Pereira presents a study which is part of his doctoral thesis. This article introduces the topic of soft matter highlighting its use and behaviour. The study focuses mainly on a Polymer called Ionic Polymer Metal Composite.
Mariana-Rodica Milici and Laurentiu-Dan Milici study the conditions, con-sequences and practical applications of the resonance phenomenon. Focusing on the RLC series circuit under sinusoidal steady state, the authors provide valuable explanations and warnings regarding the resonance condition and applications of this phenomenon.
Cristina Mesquita briefly describes the Expeducom project, financed under Erasmus+ K2, in which she participated in representation of the IPB. This was a joint project between 7 European Higher Education Institutions with the aim of developing and implementing innovative pedagogical practices related to experi-ential learning in the kindergarten and primary school context.
Teaching Crossroads: 12th IPB Erasmus Week 11
Economy and Management
Regional development in Poland
Marcin Bogdański [email protected]
University of Warmia and Mazury in Olsztyn Faculty of Economics
Poland
Abstract
The paper focuses on describing the most important aspects of the process of regional economic development in Poland between 2000 and 2014. It contains the analyses of the level of economic development of the provinces and its changes over time, and presents the most important determinants of the changes being observed.
The analyses do not allow for a clear evaluation of the processes of economic development of the Polish regions, especially in the context of the dynamics and scale of the processes of economic convergence. Focusing on the diversification of economic development within the country, it should be emphasised that the year 2000 saw relatively large disparities in the level of GDP per capita for the provinces. And during the period analysed these disparities have increased.
At the same time, it was possible to observe an ongoing convergence process in relation to the average level of economic development of the EU countries and regions. And what is more important, this process was not limited only to the wealthiest provinces.
Elisabete Silva, Clarisse Pais, Luís S. Pais 14
literature, which is the determinants of economic convergence and effectiveness, or even purposefulness of EU`s Cohesion Policy. The results of the study support the thesis that at regional level there are significant differences in the economic potential of regions and these differences (which are quite stable) prevent the achievement of economic convergence. Thus, many efforts taken within the EU Cohesion Policy understood as a “simple” decreasing of disparities in the level of economic development of regions will be ineffective.
Keywords: regional development, economic convergence, Poland
Introduction
The issues related to the functioning of regions and their economic development are occupying an increasing part of the analyses carried out in social sciences, in-cluding economic sciences. This is due to the fact that in a dynamic contemporary macro-economic environment, which requires relatively frequent changes of eco-nomic policies and tools, the regional level is the most effective and efficient method of conducting this kind of policy. The regional and local authorities are able to take advantage of the resources present in the area more effectively provided they are able to shape their economic policy in a self-governing fashion and have the proper administrative and financial tools to do so. Such steps, in turn, provide the basis for the economic development of the area. Hence, this is one of the reasons why the economic policy of the European Union focuses primarily on the regional level.
The growing interest in the issues of regional development also results from the increasing disparities in the level of their economic development. The scale of the observed differences is particularly large for the economies of China and the US, where metropolises and metropolitan regions are absorbing an increasing part of economic potential (Dijkstra, Garcilazo & McCain, 2013). This, in turn, causes negative social phenomena and processes, manifested, among others, in the weakening of ties between social and professional groups and regional communi-ties, the disintegration of existing social structures, and the escalation of unrest and conflicts (Jasiński, 2012).
Teaching Crossroads: 12th IPB Erasmus Week 15
Poland has been a member of the European Community since 2004. However, several years before its accession to the EU Poland had been a beneficiary of European funds aimed, on the one hand, at increasing the dynamics of the development of Polish regions, and on the other hand at reducing the existing regional disparities. Similar goals were adopted in the 1999 reform of the territorial organisation of the country, which established 16 new provinces.
At this point, it seems reasonable to ask about the effectiveness of these measures. Has the level of economic development grown dynamically in the regions over the last several years? Has this growth helped decrease the developmental disparities existing at the beginning of the 21st century? Finally, have these differences been reduced also in relation to the average level of economic development of the EU regions? Answering these questions will give the incentive to raise a discussion on the assessment of the effectiveness and efficiency of the processes of economic and social transformation in Poland commenced in 1989 after the collapse of social-ism and symbolically finalised in 2004 when Poland entered the European Union.
1. Methodology of the analysis
The achievement of the objective established for the analyses necessitated the selection of the appropriate measure of the economic development of the regions. One can find many different methods of measuring development in the literature. Some of them are synthetic in nature and encompass various dimensions of this process. However, their frequently complicated structure makes it difficult to in-terpret the results and requires access to a set of statistical data. On the other hand, simple measures used for certain aspects or effects of the process of economic growth ignore its complexity and may lead to some simplistic conclusions.
Given the purpose of this work and its size, it was decided that the value of GDP
per capita would be the most appropriate measure. It is one of the most widely used measures of economic development. It shows the value of global production of goods and services in the region per person, roughly reflecting the wealth of the society. Despite the high degree of data aggregation, it makes it possible, among other things, to take into account the structure of the business activity conducted in the region, the structure of the expenditures of production factors, price ratios and demographic factors (Strahl, 2009, p.17). In addition, the simplicity of the interpretation of the results means that it is relatively frequently used for both scientific analyses and designing economic policies and tools (Bogdański, 2010).
Elisabete Silva, Clarisse Pais, Luís S. Pais 16
similar structural characteristics become more alike (e.g. the educational level of the population, the structure of production). Regions with different structural parameters trend towards different long-term income levels (Wójcik, 2008).
To determine whether beta-convergence occurs between economies, one can use the following equation (Kudłacz & Woźniak, 2009):
Where:
y(T) – the value of GDP per capita in the ending year; y(0) – the value of GDP per capita in the starting year; T+1 – the number of years.
Using the values of parameter α1, it is possible to calculate parameter β, which indicates what percentage of the distance from the long-term equilibrium state the economy covers in one year (ibid).
The second type of convergence is sigma-convergence. It occurs when the diver-sification of income between economies decreases over time. The basic measures of this diversification are the standard deviation and the coefficient of variation of GDP per capita. The occurrence of the beta convergence is a necessary – but insufficient – condition for obtaining the sigma-convergence (Próchniak, 2004).
The time frame of the analysis covered the period between 2000 and 2014, and was largely limited by the possibility of obtaining comparable statistical data. The starting year of the analysed period is the second full year of the functioning of the new provinces after the introduction of the reform of the territorial organisation of the country. The ending year is 2014, which was the last year for which it was possible to obtain comparable statistical data, the source of which was the Eurostat database (http://ec.europa.eu/eurostat/data/database).
2. The concept of economic development and its measures
Defining the concept of economic development is a complicated and complex task, regardless of its spatial scale. In addition, its understanding has changed over time due to the evolution of research on the nature of the various socio-economic processes and civilisational changes taking place in the world. This is a result of the complexity and multidimensionality of the processes of economic development. Hence, to know it fully and understand its essence requires a comprehensive and multidisciplinary approach based on the categories of economic, social, spatial, ecological and local order (Kosiedowski, 2001).
Teaching Crossroads: 12th IPB Erasmus Week 17
since its emergence as an independent scientific discipline. At the same time, this is still an issue that requires continuous research (Bocian, 2002). Economic development is usually defined as “(...) the process of changes in the economy that is caused by the development of productive forces and entails both quantitative and qualitative changes in the production ratios and the production method” (Przygodzki, 2012, p.43). In other words, it is defined as economic growth with some simultaneous processes of qualitative changes. These changes occurring in the material, ownership and institutional structures of the economy exert a stimulating influence on the dynamics of the economic changes, particularly on the production growth rate, the size and structure of employment, and the distribution of income (Korenik, 1999). The literature includes a wide diversity of definitions of economic development, also in relation to the economic development of regions. They are related to vari-ous aspects of the process and emphasise its different conditions and dimensions. Hence, it seems more reasonable to identify some characteristics of economic development that are common to most definitions. Thus it can be assumed that (Chądzyński, 2012):
1) Development is multidimensional – it combines many interdependent processes and phenomena of social, economic, political and cultural nature.
2) Development is a broader category than growth – it also contains structural changes. Development results in an increase in the number of elements of the economic system, which leads to a more complex structure. In the case of growth, however, only the “size” of these elements increases. 3) Development is a dynamic category – the relations between various
developmental components are not constant and are subject to some slow evolutionary changes under normal conditions.
4) Development is spatially diversified.
Being a complex and multidimensional process, regional development consists of various components. The most important of these include: economic growth, employment growth, the rise in prosperity and quality of life, the increase in vestment attractiveness, technological development and the implementation of in-novations, the processes of the restructuring of economic activity, the development of human and social capital, the development of the institutional infrastructure, the improvement of the image of the regions, and the integration of the regions (Szewczuk, 2011).
Elisabete Silva, Clarisse Pais, Luís S. Pais 18
Although the relations between economic growth and economic development are not always clear and are not universal, it seems that growth is the primary process. First, care must be taken to increase the level of wealth and create an appropriate financial and material foundation so that it is later possible to support the develop-ment of the non-material spheres. It is these material foundations (work and the income related to it) that determine the ability to achieve the higher-order objec-tives – spiritual development and securing lifetime achievements and opportunities for future generations (Chądzyński, 2012).
One consequence of the complexity and multidimensionality of the processes of regional economic development is the difficulty in measuring the level and dynamics of the changes. Its comprehensive measurement requires that many different quantitative and qualitative variables should be included and measured. For this purpose, complex synthetic multi-measure indices are designed to com-prehensively measure the level of economic development of the selected spatial units. This, however, raises important methodological challenges (related to the proper selection of diagnostic variables, assigning the appropriate weights to them, and assigning numerical values to qualitative variables) as well as practical chal-lenges which result from the availability and frequency of publication of statistical data. Furthermore, the interpretation of such indices may pose some difficulties, especially in the context of conclusions for economic policy (Michalos, 2007; Pater, Harasym & Skica, 2015).
One relatively frequently used synthetic measure of the level of economic de-velopment (also in relation to regions) is the value of Gross Domestic Product per capita. This indicator represents the average value of the global production generated in a given area per person. It reflects an approximation of the wealth of the society as the basic component of its economic development. The simplicity of calculation, the ease during the interpretation and development of various comparisons and summaries, and the widespread availability of statistical data cause it to be one of the most widely used measures of economic development at different levels of data aggregation despite some flaws and limitations (Michalek & Zarnekow, 2011). In the case of regions of countries of the European Union (EU), the use of GDP per capita as the basic criterion for the assessment of the development level is also justified by the fact that its value is decisive for the qualification of the region for support under the Convergence objective of the EU Cohesion Policy (Puigcerver-Penalver, 2007).
3. The local government system in Poland
Teaching Crossroads: 12th IPB Erasmus Week 19
It is assumed in the economic and social sciences and practice (including the framework of the EU Cohesion Policy) that the region is “(...) a territorial unit with a political representation directly subordinated to the central level” (Waldziński, 2005, p.22). If one accepts this as a decisive criterion, one must note that the function of the regions in Poland is performed by provinces (in Poland called voivodeships).
Currently, the Polish territory is divided into 16 provinces. They were established by the Act of 24 July 1998 on the introduction of the three-tier administrative division of the country. This event played an important part in the systemic and economic transformation initiated in Poland after the collapse of the socialist economy in 1989. The new larger provinces started functioning on 1 January 1999 and replaced the previous 49 smaller provinces. But more importantly, under the said act the provincial authorities have regained the capacity to self-govern guaranteed by the Constitution and have been properly equipped with real instruments that enable the shaping of their socio-economic situations for the first time since the end of World War II (Heller & Bogdański, 2013).
The purpose of the reform was to boost the economic development of Poland by, among other things, increasing the degree of economic and legal independence of the 16 provinces at the NUTS II level. After five years, significant adjustments were made to the reform. From 1 January 2004 on, there was a significant increase in the revenues of local governments. In practical terms, these changes were aimed at increasing the decentralisation of the country. The rising income had two sources, the first being the increased grants and subsidies from the state budget, and the second being the increase in local governments’ own revenues (Heller, 2011, p.102).
In accordance with the Polish legislation, the provincial government is responsi-ble for the implementation of a number of mandatory tasks (goals) whose efficient and effective performance also contributes to raising the level of socio-economic development. The main goals include tasks in the area of:
1) public education, including higher education;
2) the promotion and protection of health, social security and support for families;
3) the modernisation of rural areas, environmental protection and water management, including flood protection;
4) spatial development; 5) consumer rights protection; 6) public security and defence;
7) counteracting unemployment and reviving the local labour market.
Elisabete Silva, Clarisse Pais, Luís S. Pais 20
grants from the state budget and special purpose budgets (the Act of 13 November 2003 on the income of local government units – legal status as of October 2016).
4. Results
Table 1 presents the values of GDP per capita for the Polish provinces between 2000 and 2014 as an approximate measure of the level of economic development. It also presents the values of similar measures for the whole country as well as the EU average. For comparative purposes, it was decided that all data presented in them should be expressed on the basis of purchasing power parity.
When analysing the data presented in Table 1, one can see some clear patterns. Firstly, Poland is a country with a strong diversification in the level of regional economic development. At the beginning of the analysed period, the difference between the richest (Mazowieckie Province) and the poorest region was more than double (2.14). Moreover, these disproportions increased over the analysed period, and they were 2.3:1 in 2014.
Compared to other regions, the capital region (Mazowieckie Province) has the highest level of development, which largely results from its favourable location (the central part of the country) and above all the presence of Warsaw – the capital of the country, the largest Polish city, and the location of the largest and most impor-tant organisations and enterprises in the country. Other regions characterised by a relatively high level of economic development include the provinces of Śląskie, Dolnośląskie and Wielkopolskie. Their significant part belongs to the most ur-banised areas in the country whose central cities (Katowice and the whole Silesian conurbation, Wroclaw and Poznan, respectively) are among the largest city centres in Poland. At the same time, they are highly industrialised regions with long-term traditions in many branches of the secondary industry. In relation to the national average, the average level of GDP per capita in these provinces in 2000 was higher by 17.4 percentage points. At the end of the analysed period, this value increased to 20.8 percentage points. At the same time, in 2000 the share of the four most developed provinces mentioned above in the creation of the national GDP was equal to 50.85% (and 20.4% for Mazowieckie Province). At the end of the analysed period it increased to 52.68% (22.12% for Mazowieckie Province).
Teaching Crossroads: 12th IPB Er
asmus
W
eek
21
Table 1 – GDP per capita of voivodships in Poland during years 2000-2014 (in euro, PPS – purchasing power parity standard)
Province 2000 2002 2004 2006 2008 2010 2012 2014 Dynamics 2000=100%
Lódzkie 8 200 9 000 10 100 11 400 13 100 14 600 16 400 17 400 212,20
Mazowieckie 14 100 15 000 16 600 19 000 21 500 25 000 28 100 29 800 211,35
Malopolskie 8 300 8 800 9 700 11 100 12 600 13 800 15 600 16 600 200,00
Slaskie 9 800 10 700 12 300 13 100 15 100 16 800 18 700 19 300 196,94
Lubelskie 6 600 7 100 7 800 8 500 10 000 10 800 12 400 13 000 196,97
Podkarpackie 6 700 7 300 8 000 8 800 10 100 10 900 12 300 13 200 197,01
Swietokrzyskie 7 200 7 800 8 700 9 600 11 600 12 100 13 200 13 500 187,50
Podlaskie 6 800 7 500 8 100 9 000 10 300 11 500 12 600 13 400 197,06
Wielkopolskie 9 800 10 300 11 800 13 100 14 900 16 500 18 700 20 000 204,08
Zachodniopomorskie 9 100 9 500 9 900 11 100 12 600 13 400 14 800 15 600 171,43
Lubuskie 8 200 8 700 9 800 11 100 12 200 13 300 14 600 15 600 190,24
Dolnoslaskie 9 500 10 200 11 100 13 200 15 200 17 700 20 000 20 800 218,95
Opolskie 7 700 8 000 9 400 10 100 12 100 12 900 14 200 15 000 194,81
Kujawsko-Pomorskie 8 300 8 900 9 700 10 700 12 100 13 000 14 300 15 100 181,93
Warminsko-Mazurskie 7 100 7 500 8 300 9 200 10 400 11 400 12 600 13 300 187,32
Pomorskie 9 100 9 900 10 800 12 200 13 500 15 100 17 200 17 700 194,51
POLAND 9 200 9 900 11 000 12 300 14 100 15 700 17 600 17 900 194,56
EU-28 19 600 21 100 22 400 24 500 26 000 25 400 26 500 26 700 136,22
Elisabete Silva, Clarisse Pais, Luís S. Pais 22
it was 15.98% in 2000 and 15.26% at the end of the analysed period. These regions form the so-called eastern wall of Poland – an arbitrary macro-region with a low level of economic development. It consists of the provinces with a relatively low population density, a poorly developed urban network, and a relatively uncompetitive production structure in which a relatively important role is played by the agricul-ture industry. An additional common trait of these provinces is the fact that all of them have hallmarks of peripheral regions to a large degree. Their peripherality is not only of a geographic nature (location along the eastern border of the country) but of economic, social and cultural nature, as well (Heller& Bogdański, 2015).
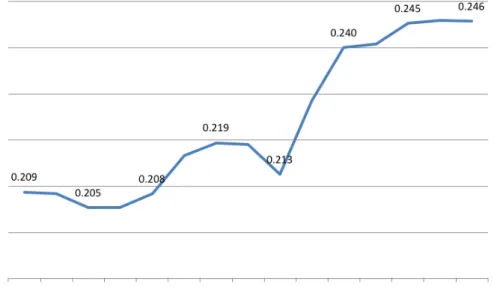
One of the measures most commonly used to determine disparities in economic development between spatial units is the coefficient of variation of GDP per capita. Fig. 1 shows its values estimated for all the Polish provinces between 2000 and 2014.
Figure 1: The values of the coefficient of variation of regional GDP per capita in Poland between 2000 and 2014.
Source: author’s own calculations based on Eurostat data, http://ec.europa.eu/eurostat/data/database
Teaching Crossroads: 12th IPB Erasmus Week 23
relatively richest and most developed provinces were characterised by a greater resistance and flexibility to the global economic downturn, which is evidence of a higher level of competitiveness.
Figura 2: The average annual growth rate of GDP per capita in the provinces between 2000 and 2014.
Source: author’sown calculations based on Eurostat data, http://ec.europa.eu/eurostat/data/database
Elisabete Silva, Clarisse Pais, Luís S. Pais 24
the analogous period in 2000. The lowest average growth rate, in turn, was that of Zachodniopomorskie Province (3.97%).
Figure 3: Processes of beta-convergence of the provinces between 2000 and 2014
Source: author’sown calculations based on Eurostat data, http://ec.europa.eu/eurostat/data/database
The thesis about the lack of beta-convergence between the Polish regions is also confirmed when using slightly more advanced statistical analysis methods. Fig. 3 shows the relation between the initial level of economic growth in the provinces (the measure of the level of development was based on the natural logarithm for GDP per capita in 2000) and the average annual growth rate of GDP per capita as a method of measuring the dynamics of growth processes (in this case, the measure was the natural logarithm of the average annual growth rate of GDP per capita between 2000 and 2014). The vertical line marks the average level of economic growth of all the provinces in 2000, and the horizontal line indicates the average annual growth rate of GDP per capita between 2000 and 2014.
Teaching Crossroads: 12th IPB Erasmus Week 25
processes, but both its value (0.09) and the level of statistical significance do not allow for confirmation of this thesis.
The regression equation describing the relation between the initial level and the subsequent growth dynamics for the Polish provinces between 2000 and 2014 took the form:
(p = 0.000) (p = 0.715) R2 = 0.09
The positive value of the coefficient before the explanatory variable indicates that in the case of the Polish regions between 2000 and 2014 it was possible to observe processes of slow beta-divergence, which consisted in a relatively fast growth of the relatively rich provinces, and these differences increased at a rate of 0.02% per an-num. One should exercise caution with these conclusions because of the low value of the coefficient R2 of the estimated regression function, and due to the statistical
insignificance of the calculated slope of the function.
The obtained results could be influenced to some extent by the specific nature of Mazowieckie Province – its superior position in the social and economic system of Poland and by far the highest level of economic development. Therefore, it was decided to evaluate the regression function again but this time excluding the capital region. The obtained results are as follows:
(p = 0.000) p = 0.929) R2 = 0.006
In this case, they may indicate the processes of slow convergence between the Polish regions, but both its rate and the low statistical significance of the estimated coefficients of the regression equation do not allow for clear confirmation of this thesis, either.
Determining the level of economic development of spatial units is relative in nature, i.e. the indication whether a given country or region is at a high or low development level depends on the choice of the units it is compared against. In the case of the Polish economy and its regions, the natural point of reference is the average level of economic development of the European Union and its regions. The accession of Poland to the economic and political structures of the EU, which oc-curred on 1 May 2004, was a symbolic turning point in the history of the country that finalised the key stage of the processes of economic and political transformation commenced in 1989 after the collapse of the centrally planned economy. For these reasons, Table 2 shows data representing the value of GDP per capita for Polish regions in relation to the average value of this indicator in the EU.
Elisabete Silv
a, Clarisse P
ais, Luís S. P
ais
26
Table 2: GDP per capita of Polish voivodships in relation to the EU average (PPS, in percentage)
Voivodship 2000 2001 2002 2003 2004 2005 2006 2007 2008 2009 2010 2011 2012 2013 2014
Change in percentage
points
Lódzkie 42 41 43 44 45 46 46 49 51 54 57 59 62 62 63 21
Mazowieckie 72 71 71 72 74 76 78 82 83 92 98 102 106 107 108 36
Malopolskie 42 40 42 42 43 44 45 47 49 52 54 57 59 59 60 18
Slaskie 50 49 51 51 55 54 53 56 58 63 66 69 70 70 70 20
Lubelskie 34 34 34 34 35 35 35 37 39 41 43 45 47 47 47 13
Podkarpackie 34 34 35 35 36 36 36 37 39 42 43 45 46 47 48 14
Swietokrzyskie 37 36 37 38 39 38 39 42 45 47 48 49 50 49 49 12
Podlaskie 34 35 36 36 36 37 37 39 40 43 45 47 48 49 49 15
Wielkopolskie 50 49 49 50 53 54 54 56 57 64 65 68 70 72 73 23
Zachodniopomorskie 46 45 45 44 44 45 45 47 49 51 53 54 56 56 57 11
Lubuskie 42 41 41 41 44 45 45 47 47 50 52 53 55 56 57 15
Dolnoslaskie 48 47 48 49 50 51 54 58 59 64 70 73 75 75 76 28
Opolskie 39 37 38 38 42 41 41 45 47 50 51 53 54 54 55 16
Kujawsko-Pomorskie 42 42 42 42 43 43 44 46 47 49 51 53 54 55 55 13
Warminsko-Mazurskie 36 35 35 36 37 37 38 39 40 43 45 46 47 48 48 12
Pomorskie 46 45 47 47 48 49 50 52 52 58 59 62 65 64 64 18
Poland 47 46 47 48 49 50 50 53 54 59 62 64 66 67 68 21
Teaching Crossroads: 12th IPB Erasmus Week 27
GDP per capita is low in most cases. At the beginning of the period it ranged from 34% (for Lubelskie and Podkarpackie Provinces) to 72% (Mazowieckie Province) of the EU average. This approach also clearly exposes the groups of provinces with a relatively good economic situation (Mazowieckie, Śląskie, Dolnośląskie and Wielkopolskie) as well as the relatively poor regions (the so-called eastern wall). However, subsequent years saw a gradual improvement in this relation in favour of the Polish regions. The rate and scale at which the developmental gaps decreased were not uniform, though.
Mazowieckie Province definitely stands out as its value of regional GDP per capita in relation to the EU average over the analysed period increased by 36 per-centage points. It is also the only Polish region in which the value of the analysed indicator exceeded its average value throughout the Community from 2011 on.
The provinces reducing the developmental gap with the EU at a relatively fast pace are also Dolnośląskie (change of 28 percentage points), Wielkopolskie (23 percentage points), Łódzkie (21 percentage points) and Śląskie Province (20 percent-age points). All of them were among the relatively highly developed regions at the beginning of the period. Again, this indicates the deepening of the inter-regional disparities in Poland between 2000 and 2014. The presented data also show that the reduction of the developmental gap between the entire country and the EU average by 21 percentage points was, first of all, due to the relatively rapid development of those very regions that were already at a relatively high level of development at the beginning of the period.
In the case of provinces that were characterised by the lowest values of regional production per capita in 2000, one can also observe the process of economic con-vergence with respect to the average level of development in the EU. The dynam-ics of this process, however, are clearly lower than those of the regional economic leaders. Of the five regions that had the lowest values of GDP per capita in 2000, the economies of Podlaskie (15 percentage points) and Podkarpackie Provinces were the fastest at reducing the developmental gap with the EU. On the other hand, in the case of Warmińsko-Mazurskie and Świętokrzyskie Provinces, the disparities decreased by only 12 percentage points.
5. Conclusions
tradi-Elisabete Silva, Clarisse Pais, Luís S. Pais 28
tions, a modern production structure and relatively large capital cities. On the other hand, the regions with the lowest level of development were the peripheral prov-inces (located along the eastern Polish border) where agriculture and the relatively technologically underdeveloped processing industry played an important role in the production structure. In addition, these regions have a low population density and an underdeveloped city network. The observed differences in subsequent years increased steadily. This was despite the fact that after 2007 Poland was the greatest beneficiary of EU funds allocated to the implementation of the Cohesion Policy.
At the same time, it was possible to observe an ongoing convergence process in relation to the average level of economic development of the EU countries and regions. Importantly, this process was not limited only to the wealthiest provinces. Also, the Polish regions that belonged in 2000 to the least developed regions gradu-ally reduced the development disparities in comparison to the EU average, although the rate of convergence processes was much lower in this case. It should be noted, though, that similar tendencies to increase the regional development disparities within national economies and reduce them between regions of the various EU countries can also be seen in most Member States of the European Community.
The persistence of the regional economic disparities in Poland gives reasons to believe that they will continue to increase in the coming years with all their negative consequences. Currently, the only regions characterised by a positive balance of internal migration are those that are already highly developed. The phenomenon of migration applies mainly to highly skilled and educated young people. As a result of the outflow of the most valuable workforce resources, the development potential of the poorest regions will be reduced, which may lead to the accelera-tion of the processes of divergence. Analysing the debate on the determinants of regional development in Poland the results of the paper should give a new impulse for changing at least some of the goals and tools of regional policy. It follows that a stronger emphasis in its goals should be put in creating for less developed regions more effective ways of using the dynamic growth of regional leaders to improve their economic potential and, in the long term, to improve their dynamics of re-gional economic development.
Teaching Crossroads: 12th IPB Erasmus Week 29
the point of asking questions or, even more, searching for answers. However, it will probably require a change in the approach to designing the guidelines and tools of the Cohesion Policy.
References
Bocian, A., (2002). Determinanty wzrostu gospodarki polskiej. In A.F. Bocian (Ed.) Podlasie. Determinanty wzrostu (pp. 17-27). Białystok, Wydawnictwo Uniwersytetu w Białymstoku.
Bogdański, M. (2010). Urban Determinants of Polarisation of Economic Development in Poland. Olsztyn Economic Journal, 5, 269-279.
Chądzyński, J. (2012). Nowe koncepcje rozwoju – w kierunku rozwoju lokalnego. In J. Chądzyński, A. Nowakowska, Z. Przygodzki (Eds.) Region i jego rozwój w warunkach globalizacji (pp. 63-104). Warszawa, Wydawnictwa Fachowe CeDeWu.pl.
Dijkstra, L., Garcilazo, E., & McCann, P. (2013). The Economic Performance of European Cities and City Regions: Myths and Realities. European Planning Studies, 21, 334-354. doi: http://dx.doi.org/10.1080/09654313.2012.716245. Heller, J. (2011). Ekonomiczna aktywność państwa w rozwoju gospodarczym regionów.
Olsztyn, Wydawnictwo Uniwersytetu Warmińsko-Mazurskiego w Olsztynie. Heller, J., & Bogdański, M. (2013). Skuteczność polityki spójności ekonomicznej
Unii Europejskiej. Studia Europejskie, 68, 149-168.
Heller, J., & Bogdański M. (2015). Gospodarka województwa warmińsko-mazurskiego na tle wybranych województw i regionów Unii Europejskiej. In S. Achremczyk (Ed.), Warmia i Mazury 1990-2015. Gospodarka, polityka, społeczeństwo (pp. 43-63). Olsztyn, Ośrodek Badań Naukowych.
Jasiński, J. (2012). Spójność ekonomiczna i społeczna regionów państw Unii Europejskiej. Warszawa, Oficyna Wydawnicza Politechniki Warszawskiej. Korenik, S. (1999). Rozwój regionu ekonomicznego na przykładzie Dolnego Śląska.
Wrocław, Wydawnictwo Akademii Ekonomicznej we Wrocławiu.
Kosiedowski, W. (2001). Teoretyczne problemy rozwoju regionalnego. W: Zarządzanie rozwojem regionalnym i lokalnym. In A. Adamiak, W. Kosiedowski (Eds.) Problemy teorii i praktyki (pp. 17-47). Toruń, TNOiK.
Kudłacz, T., & Woźniak, D. (2009), Konwergencja czy polaryzacja rozwoju regionalnego Polski w perspektywie 2020 r. w świetle projekcji modelu HERMIN?. Zarządzanie Publiczne, 7, 19-30.
Elisabete Silva, Clarisse Pais, Luís S. Pais 30
Michalos, A. (2007). Connecting Communities with Community Indicators. Second OECD Forum on Statistics, Retrieved October 5 2016 from www.oecd.org/ site/worldforum06/38647593.pdf.
Pater, R., Harasym, R., & Skica, T. (2015). Index of Regional Economic Development. Some considerations and the Case of Poland. Studia Regionalne i Lokalne, 1(59), 54-83.
Próchniak, M. (2004). Analiza zbieżności wzrostu gospodarczego województw w latach 1995-2000. Gospodarka Narodowa, 3, 27-44.
Przygodzki, Z. (2012). Teoretyczne podstawy rozwoju regionalnego i lokalnego. In J. Chądzyński, A. Nowakowska, Z. Przygodzki (Eds.) Region i jego rozwój w warunkach globalizacji (pp. 39-62). Warszawa, Wydawnictwa Fachowe CeDeWu.pl.
Puigcerver-Penalver, M. (2007). The Impact of Structural Funds Policy on European Re-gions` Growth. A theoretical and Empirical Approach. The European Journal of Comparative Economics, 4, 179-208.
Strahl, D. (2009). Klasyfikacja europejskiej przestrzeni regionalnej ze względu na rozwój gospodarczy i gospo-darkę opartą na wiedzy. In R. Brol (Ed.),
Gospodarka lokalna i regionalna w teorii i praktyce (pp. 15-26). Wrocław, Wydawnictwo Uniwersytetu Ekonomicznego we Wrocławiu.
Szewczuk, A. (2011). Rozwój lokalny i regionalny – główne determinanty. In A. Szewczuk (Ed.) Rozwój lokalny i regionalny. Teoria i praktyka (pp. 13-88). Warszawa, Wydawnictwo C.H. Beck.
Ustawa o dochodach jednostek samorządu terytorialnego z dnia 13 listopada 2003, Retrieved October 20 2016 from http://isap.sejm.gov.pl/DetailsServlet?id= WDU20032031966
Waldziński, D. (2005). Polityka regionalna w Polsce w procesie przemian kulturowo-cywilizacyjnych. Olsztyn, Wydawnictwo Uniwersytetu Warmińsko-Mazurskiego w Olsztynie.
Management of current assets in the Polish corporate
sector – selected aspects
Małgorzata Okręglicka [email protected]
Czestochowa University of Technology Faculty of Management
Poland
Abstract
Elisabete Silva, Clarisse Pais, Luís S. Pais 32
of intuition or ad hoc actions, which improve financial management methods and tools.
Keywords: working capital, inventories, receivables, management, current assets
Introduction
The importance of working capital has been investigated from different per-spectives in previous studies. Working capital is defined as the difference between current assets (cash, accounts receivable, inventories) and current liabilities and is often used to measure a firm’s liquidity level (Mun & Jang, 2015; Okręglicka, 2014). The objective of working capital management is to ensure that the economic entity is able to meet its operating expenses and also remain in a position to pay short-term obligations. Enterprises with higher working capital investment are considered to be more liquid; hence they have lower bankruptcy risk (Dunn and Cheatham, 1993). By managing working capital efficiently, enterprises can reduce their dependence on external funding, reduce their financing costs and use the released cash for further investments, improving the company financial flexibility (De Almeida & Eid, 2014). The mismanagement of working capital may lead to a liquidity crisis and a reduction in profitability, hence affecting the ability of the firm to continue to operate as a going concern (Ukaegbu, 2014). So, working capital may act as a stock of precautionary liquidity, providing insurance against future shortfalls in cash (Fazzari & Petersen, 1993). Efficient working capital management is recognized as an important aspect of financial management practices in allor-ganizational forms (Enqvista et al., 2014).The particular importance of working capital management is required in small and medium-sized companies because of higher financially constrained they need to face (García-Teruel & Martínez-Solano, 2007; Haviernikova et al., 2016).
The most commonly described elements of working capital management in economic literature are: receivable (trade credit) management and inventory management. The effectiveness in their management can bring the improvement in business performance and ensure the day to day survival of the company.
The aim of this paper is to identify and analyse the selected aspect in the area of current assets management in Polish enterprises, classified according to the size of employment, as micro, small, medium-sized and large enterprises.
Teaching Crossroads: 12th IPB Erasmus Week 33
1. Theoretical background
There is substantial literature on trade credit policy and inventory management. Many authors emphasize the importance of taking into account the interactions between the various working capital elements that is receivable accounts, inventories and payable accounts (Sartoris & Hill, 1983). However, there are still not so many attempts to integrate both credit policy and inventory management decisions into one coherent policy.
The investment in receivable accounts and inventories represents an important proportion of a firm’s assets, while trade credit is an important source of funds for most firms (Baños-Caballero et al., 2014). It is presented in literature that a higher investment in extended trade credit and inventories might increase corporate per-formance for several reasons. Larger inventories can reduce supply cost, provide hedge against input price fluctuations, and minimize loss of sales due to potential
stock-outs (Blinder & Maccini, 1991; Corsten & Gruen, 2004). In addition, they allow enterprises better service for their customers and avoid high production costs arising from high fluctuations in production (Schiff & Lieber, 1974).
In turn, trade credit to customers may affect positively sales of the company because it allows for price discrimination, serves as a warranty for product qual-ity, and fosters long-term relationship with customers (Summers & Wilson, 2002; Long et al., 1993). Also, it encourages clients to acquire merchandise at times of low demand (Emery, 1987; Ben-Nasr, 2016) and allows them to verify product and services quality prior to payment (Smith, 1987; Lee & Stowe, 1993). Granting trade credit may encourages customers to buy products when it is difficult to differentiate products (Shipley & Davis, 1991; Deloof and Jegers, 1996)
Excessively high level of receivables or inventories brings many negative effects
since greater receivable and inventory levels indicate a need for additional capital, which enterprises must finance and it involves financing costs and opportunity costs (Aktas et al., 2015). Moreover, too much cash tied up in net operating work-ing capital might also impede companies from implementwork-ing value-enhancwork-ing investment projects in the short run (Ek & Guerin, 2011).
When we keep stock available, it brings costs such as warehouse rent, losses in stock or insurance and security expenses, just to name a few. The higher the level of inventories is the higher costs are generated (Kim & Chung, 1990).
Elisabete Silva, Clarisse Pais, Luís S. Pais 34
which trade credit is organized, managed and monitored is of crucial importance to ensure effective risk management (Paul & Boden, 2008).
2. Data and methodology
The aim of this paper is to identify and analyse the selected aspect in the area of current assets management in Polish enterprises, classified according to the size of employment, as micro, small, medium-sized and large enterprises. In view of the main aim, the following research hypothesis has been formulated: There are still poor management practices in the area of current assets management in Polish enterprises.
In order to examine hypotheses, the researcher conducted studies in 380 en-terprises from southern regions of Poland. The research group selection had an accidental character and this is why study should be treated as a seed research, identifying trends, which should be confirmed, based on representative sample. The study group consisted of 68.9% of microenterprises, 21.8% of small enterprises, 5.3% of medium enterprises and 3.9% of large enterprises. The studies have a form of a direct questionnaire and were carried out in the first half of 2014 and were addressed to enterprises’ owners or managers, who were completing survey ques-tionnaires in a paper form in the presence of an interviewer. Despite the fact that the studies referred to enterprise’s finance, they had a qualitative character. This resulted from the fact that there were microenterprises in the study group which conduct limited financial reporting; therefore, an access to the quantitative data was restricted. This is why the statistical analysis of the material was conducted on the basis of Spearman’s rank correlation coefficient. The studies had seed character and constitute the basis for the preparation of extended research in the future.
3. Results and discussion
Management of current assets, i.e. receivables, inventory and cash, is a very wide subject, so it is difficult to present all aspects of this issue. Based on empirical studies, the author carried out a broad analysis, but only selected aspects thereof will be discussed in this article.
Teaching Crossroads: 12th IPB Erasmus Week 35
Table 1: Problems with inflow of receivables
Size of the enterprise
total
micro small medium large
yes, big 5,7% 12,0% 9,5% 35,7% 8,4%
yes, but to a limited extent 40,1% 55,4% 71,4% 35,7% 45,0%
no 54,2% 32,5% 19,0% 28,6% 46,6%
Source: own research
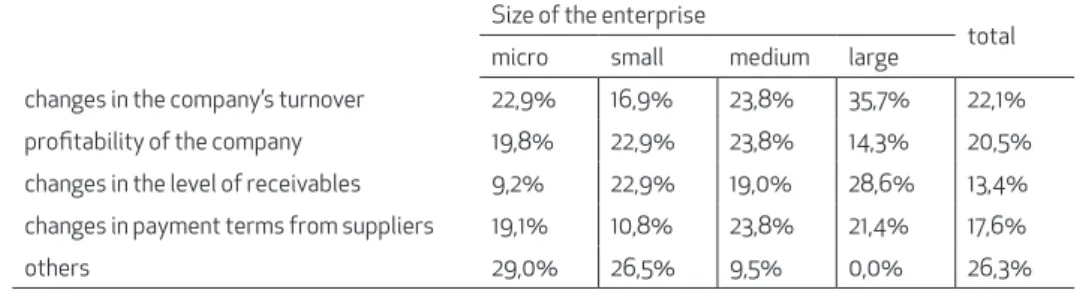
Changes in company’s income were indicated by surveyed entrepreneurs as the main reasons for the change of internal policies concerning the determination of the level of receivables. Nonetheless, there are visible differences depending on the size of the company, i.e. profitability is more important for the smaller companies, while the level of already owned receivables is of greater importance in case of large companies (see table 2).
Table 2: Reasons for changing the policy concerning shaping receivables in a company (extension/ shortening of invoice payment terms for consumers)
Size of the enterprise
total
micro small medium large
changes in the company’s turnover 22,9% 16,9% 23,8% 35,7% 22,1%
profitability of the company 19,8% 22,9% 23,8% 14,3% 20,5%
changes in the level of receivables 9,2% 22,9% 19,0% 28,6% 13,4%
changes in payment terms from suppliers 19,1% 10,8% 23,8% 21,4% 17,6%
others 29,0% 26,5% 9,5% 0,0% 26,3%
Source: own research
Elisabete Silva, Clarisse Pais, Luís S. Pais 36
Table 3: Company policies towards customers when granting deferred payment dates in the opinion of entrepreneurs
Size of the enterprise
total
micro small medium large
very mild 13,0% 1,2% 9,5% 21,4% 10,5%
mild 26,7% 27,7% 9,5% 14,3% 25,5%
moderate 46,9% 53,0% 52,4% 42,9% 48,4%
rigorous 9,2% 13,3% 19,0% 21,4% 11,1%
acute 4,2% 4,8% 9,5% 0,0% 4,5%
Spearman’s rho correlation coefficient = 0,134, p = 0,009 Source: own research
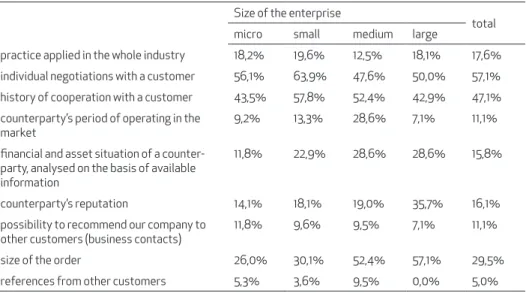
When assessing the factors that determine the granting of a deferred payment date to a counterparty it is visible that individual negotiations with a given customer and the quality of up to now cooperation are most important ones. In the case of medium and large companies, order size becomes very important, since it gives the opportunity to utilize economies of scale (see table 4).
Table 4: Factors influencing the granting of a deferred invoice payment term to a counterparty
Size of the enterprise
total
micro small medium large
practice applied in the whole industry 18,2% 19,6% 12,5% 18,1% 17,6%
individual negotiations with a customer 56,1% 63,9% 47,6% 50,0% 57,1%
history of cooperation with a customer 43,5% 57,8% 52,4% 42,9% 47,1%
counterparty’s period of operating in the market
9,2% 13,3% 28,6% 7,1% 11,1%
financial and asset situation of a counter-party, analysed on the basis of available information
11,8% 22,9% 28,6% 28,6% 15,8%
counterparty’s reputation 14,1% 18,1% 19,0% 35,7% 16,1%
possibility to recommend our company to other customers (business contacts)
11,8% 9,6% 9,5% 7,1% 11,1%
size of the order 26,0% 30,1% 52,4% 57,1% 29,5%
references from other customers 5,3% 3,6% 9,5% 0,0% 5,0%
Source: own research
Teaching Crossroads: 12th IPB Erasmus Week 37
delays in settling own liabilities, which usually cannot be combined with financial consequences for the debtor.
Table 5: Main reason for contractors’ delay in invoice payment
Size of the enterprise
total
micro small medium large
contractor has problems with the recovery of his own receivables
25,2% 30,1% 19,0% 21,4% 25,8%
contractor is in the deteriorating financial situation
25,2% 21,7% 23,8% 14,3% 23,9%
contractor is not afraid of the consequences in relation to the delay i.e. to the penalty interests
16,8% 15,7% 19,0% 14,3% 16,6%
contractor is dishonest 11,8% 6,0% 9,5% 35,7% 11,3%
in Poland there is a social consent to make the payments after due date
21,0% 26,5% 28,6% 14,3% 22,4%
Source: own research
Resulting payment delays of the counterparties are not without impact on the economic health of a company. Arrears reduce the level of working capital and can undermine the accounting liquidity of a company. This is confirmed by empirical studies, indicating that lack of payment for supplied goods or provided services most often causes delays in payments for own purchases (see table 6). The results are similar in all size groups of companies. The need to reduce investment activity, hampering the development of a company, is another important factor.
Table 6: Problems arising in a company as a result of delays in collecting receivables from coun-terparties
Size of the enterprise
total
micro small medium large
we cannot continue our own investments 36,6% 42,2% 42,9% 35,7% 38,2%
we cannot settle our own liabilities in a timely manner
60,3% 63,9% 66,7% 71,4% 61,8%
we have to raise prices for our own products 9,9% 10,8% 14,3% 0,0% 10,0%
we need to reduce employment and salaries 5,7% 10,8% 4,8% 7,1% 6,8%
we have to take out a bank loan as we are lacking money
11,1% 28,9% 28,6% 28,6% 16,6%
we cannot introduce new products or solutions
23,7% 19,3% 38,1% 21,4% 23,4%
Elisabete Silva, Clarisse Pais, Luís S. Pais 38
Despite the problems that generate delays in collecting receivables to com-panies, most of the surveyed entities do not take any actions aimed at enforcing penalty interests on arrears, fearing a negative reaction of customers in the form of resignation from commercial cooperation (see table 7). Only 11,3% of companies charge penalty interests to be borne by customers, while there is a weak statistical relationship between the size of the company and the frequency of use of this form of disciplining the customers.
Table 7: Charging the penalty interests for the delay in invoice payments
Size of the enterprise
total
micro small medium large
Yes, always 10,7% 9,6% 19,0% 21,4% 11,3%
Yes, in some cases 24,0% 42,2% 42,9% 50,0% 30,0%
No, never 65,3% 48,2% 38,1% 28,6% 58,7%
Spearman’s rho correlation coefficient = -0,192, p = 0,000 Source: own research
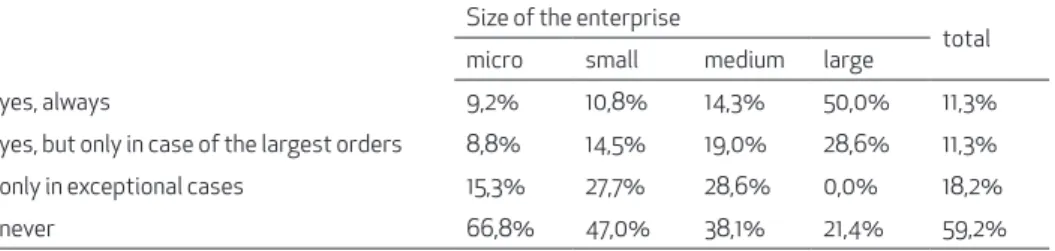
Effective management of receivables is not just enforcement of arrears and shaping the policy towards counterparties, but also reducing the risks associated with cooperation with trading partners. One of the elements of risk mitigation may be the insurance on receivables in the event of the insolvency of counterparty. It may be noted that few companies in Poland take advantage of this form, while the frequency of insuring the receivables depends to some extent on the size of the company, i.e. larger companies much more often take advantage of such an opportunity than smaller ones (see table 8).
Table 8: Use of insurances in case of contractors’ insolvency
Size of the enterprise
total
micro small medium large
yes, always 9,2% 10,8% 14,3% 50,0% 11,3%
yes, but only in case of the largest orders 8,8% 14,5% 19,0% 28,6% 11,3%
only in exceptional cases 15,3% 27,7% 28,6% 0,0% 18,2%
never 66,8% 47,0% 38,1% 21,4% 59,2%
Spearman’s rho correlation coefficient = -0,245, p = 0,000 Source: own research
Teaching Crossroads: 12th IPB Erasmus Week 39
known to them (table 9). Analysing the level of stocks in individual size groups of companies, it is visible that larger companies more often maintain high storage levels than small entities, probably to their specificity and large-scale production.
Table 9: Level of inventory balance
Size of the enterprise
total
micro small medium large
high level of inventory balance 10,7% 19,3% 28,6% 35,7% 14,5%
sufficient (average) level of inventory bal-ance
73,7% 69,9% 71,4% 57,1% 72,1%
low level of inventory balance 15,6% 10,8% 0,0% 7,1% 13,4%
Spearman’s rho correlation coefficient = -0,184, p = 0,000 Source: own research
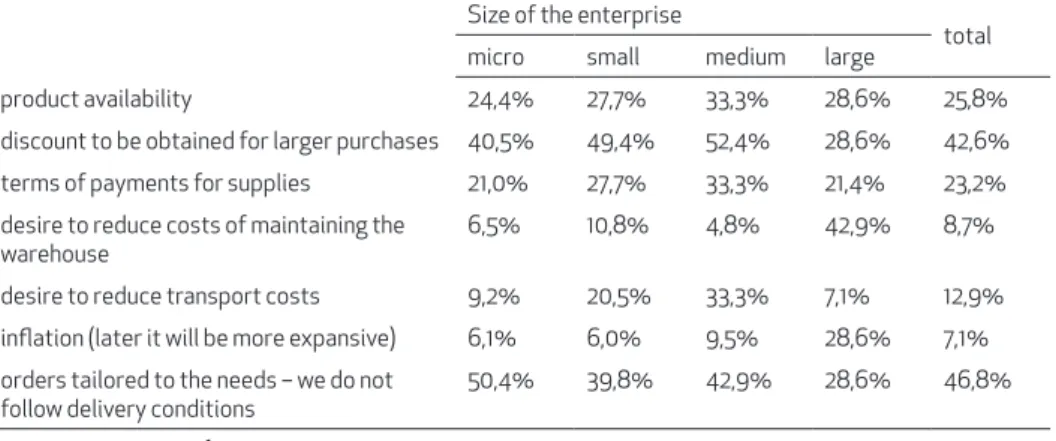
When analysing the factors that influence or force to maintain a certain level of stock by a company, the highest score was achieved by an answer indicating the absence of a coherent policy in this respect (see table 10). Companies imple-ment temporary measures, make orders (if necessary), thereby foregoing market possibilities which may occur. The only factor which is taken into account is the possibility to obtain a volume discount, which requires planning and raising a specified amount of funds for the eventuality of increased orders.
Table 10: Key factors determining the volume of purchases of goods to the warehouse
Size of the enterprise
total
micro small medium large
product availability 24,4% 27,7% 33,3% 28,6% 25,8%
discount to be obtained for larger purchases 40,5% 49,4% 52,4% 28,6% 42,6%
terms of payments for supplies 21,0% 27,7% 33,3% 21,4% 23,2%
desire to reduce costs of maintaining the warehouse
6,5% 10,8% 4,8% 42,9% 8,7%
desire to reduce transport costs 9,2% 20,5% 33,3% 7,1% 12,9%
inflation (later it will be more expansive) 6,1% 6,0% 9,5% 28,6% 7,1%
orders tailored to the needs – we do not follow delivery conditions
50,4% 39,8% 42,9% 28,6% 46,8%
Source: own research
Elisabete Silva, Clarisse Pais, Luís S. Pais 40
Table 11: Techniques of stock replenishment
Size of the enterprise
total
micro small medium large
having a predetermined stock level and we make an order if the stock differs from this level
33,2% 33,7% 33,3% 21,4% 32,9%
using a computer system in order to control the stock and on this basis we make a decision
11,8% 26,5% 28,6% 28,6% 16,6%
applying an economic model to determine the optimal stock level
3,4% 4,8% 9,5% 21,4% 4,7%
following the market practice in relation to the stock level
8,0% 3,6% 9,5% 7,1% 7,1%
making decisions Ad hoc – we act intuitively, without particular analyses
30,9% 28,9% 14,3% 7,1% 28,7%
other 12,6% 2,4% 4,8% 14,3% 10,0%
Source: own research
The above approach of entrepreneurs in the field of shaping stock levels may result in part from the fact that they do not perceive stocks as a factor that limits the liquid capital in the company (table 12). Most companies have not found any relationship between stocks and problems with accounting liquidity. At the same time, a weak statistical relationship was noted here, indicating that smaller com-panies suffer less from accounting liquidity problems due to “freezing” cash in the form of stocks.
Table 12: The need to have goods in stock as a source of accounting liquidity problems (lack of cash – cash frozen in the form of goods)
Size of the enterprise
total
micro small medium large
yes, to a large extent 4,2% 6,0% 9,5% 7,1% 5,0%
yes, but slightly 29,4% 38,6% 28,6% 42,9% 31,8%
no 66,4% 55,4% 61,9% 50,0% 63,2%
Spearman’s rho correlation coefficient = -0,102, p = 0,047 Source: own research
Teaching Crossroads: 12th IPB Erasmus Week 41
Table 13: Current working cash has been obtained from:
Size of the enterprise
total
micro small medium large
own (private) resources 82,8% 83,1% 76,2% 71,4% 82,1%
working capital loan 11,8% 25,3% 38,1% 35,7% 17,1%
overdraft 7,6% 15,7% 19,0% 0,0% 9,7%
supplier credit (receiving invoices with pay-ment terms)
15,6% 16,9% 14,3% 21,4% 16,1%
customer credit (prepayments) 0,8% 3,6% 0,0% 7,1% 1,6%
private loans 5,7% 10,8% 4,8% 7,1% 6,8%
others 11,1% 7,2% 9,5% 42,9% 11,3%
Source: own research
Among the reasons for the shortcomings in the working capital, the surveyed companies most often indicate sales with deferred payment date, problems with enforcement of receivables and the need to invest, which moves own resources from the current operations area to the development operations area and relates in particular to larger economic operators (table 14).
Table 14: Reasons for shortages of working capital in a company
Size of the enterprise
total
micro small medium large
low profitability of a company 21,8% 19,3% 9,5% 0,0% 19,7%
sale on invoice with payment term 19,5% 41,0% 38,1% 35,7% 25,8%
the need to prepay the supply of materials, goods, etc.
20,2% 20,5% 14,3% 35,7% 20,5%
problems with enforcement of payments from counterparties – untimely payment of invoices
22,1% 34,9% 47,6% 28,6% 26,6%
increased sales volumes 6,9% 6,0% 23,8% 7,1% 7,6%
price fluctuations, exchange rates, etc. 3,8% 8,4% 19,0% 28,6% 6,6%
need for constant investments 22,1% 28,9% 38,1% 50,0% 25,5%
others 29,8% 21,7% 14,3% 7,1% 26,3%
Source: own research
Elisabete Silva, Clarisse Pais, Luís S. Pais 42
4. Conclusions
Constant analysis and effective management of current assets is a key element in maintaining accounting liquidity and surviving in the market. Polish corporate sector is often affected by the problems related to the maintenance of liquidity, which is the main cause of bankruptcies of small companies, particularly start-ups.
According to the main aim of the paper, the identification and analysis of the selected aspect in the area of current assets management in Polish enterprises were conducted. This allowed for a partial confirmation of a hypothesis. The studies clearly indicate that the area of current assets in Polish enterprises is managed in an unprofessional and sketchy way, on the basis of intuition or ad hoc actions. This conclusion points to the necessity of improving management methods, including the use of professional methods and management tools to a larger extent, which refers particularly to small-scale business entities.
The contribution of this paper to the literature is the presentation of national results of the research which could be compared with the analogical data from other countries or regions. In addition, it shows the differences between results in micro, small and medium-sized enterprises, which allow the further development of the studies.
The main limitation of the performed studies is the lack of the possibility to compare the results with the situation in other countries due to the local nature of the studies. Certainly, they can provide valuable comparative basis for the results of studies conducted by scientist among companies operating in various regions of the world.
References
Aktas, N., Croci, E., & Petmezas, D. (2015). Is working capital management value-enhancing? Evidence from firm performance and investments. Journal of Corporate Finance, 30, 98–113. DOI:10.1016/j.jcorpfin.2014.12.008. Retrieved October 25, 2015, from ScienceDirect database.
Baños-Caballero, S., García-Teruel, P.J., & Martínez-Solano, P. (2014). Working capital management, corporate performance, and financial constraints, Journal of Business Research, 67(3), 332-338. DOI:10.1016/j.jbusres.2013.01.016. Retrieved October 25, 2015, from ScienceDirect database.
Ben-Nasr, H. (2016). State and foreign ownership and the value of working capital management, Journal of Corporate Finance, 41, 217–240, College of Business and Economics, Qatar University, Qatar
Teaching Crossroads: 12th IPB Erasmus Week 43
Corsten, D., & Gruen, T. (2004). Stock-outs cause walkouts. Harvard Business Review, 82, 26–28. Retrieved October 25, 2015, from EBSCOhost database. De Almeida, J.R. & Eid, Jr. W. (2014). Access to finance, working capital
management and company value: Evidences from Brazilian companies listed on BM&FBOVESPA. Journal of Business Research, 67, 924–934. Retrieved March 07, 2017, from ScienceDirect database.
Deloof, M. (2003). Does working capital management affect profitability of Belgian firms?Journal of Business Finance & Accounting, 30, pp. 573–587. DOI: 10.1111/1468-5957.00008. Retrieved March 05, 2017, from Wiley Online Library.
Dunn, P. & Cheatham, L. (1993). Fundamentals of small business financial management for start-up, survival, growth, and changing economic circumstances,Managerial Finance, 19. 1–13. Retrieved March 05, 2017, from http://www.emeraldinsight.com/doi/pdfplus/10.1108/eb013737 Ek, R., & Guerin, S. (2011). Is there a right level of working capital? Journal of
Corporate Treasure Management, 4, 137–149. Retrieved October 25, 2015, from EBSCOhost database.
Emery, G.W. (1987). An optimal financial response to variable demand. Journal of Financial and Quantitative Analysis, 22, 209–225. DOI: 10.2307/2330713 Retrieved October 25, 2015, from EBSCOhost database.
Enqvista, J., Grahamb, M., & Nikkinenc, J. (2014). The impact of working capital management on firm profitability in different business cycles: Evidence from Finland. Research in International Business and Finance, 32, 36–49. Retrieved March 07, 2017, from ScienceDirect database.
Fazzari, S.M., & Petersen, B. (1993). Working capital and fixed investment: New evidence on financing constraints. The Rand Journal of Economics, 24, 328–342. Retrieved October 25, 2015, from EBSCOhost database.
García-Teruel, P.J. & Martínez-Solano, P. (2007). Effects of working capital management on SME profitability. International Journal of Managerial Finance. 3(2), 164-177. Retrieved March 08, 2017, from emeraldinsight database.
http://dx.doi.org/10.1016/j.jcorpfin.2016.09.002. Retrieved March 08, 2017, from ScienceDirect database.
Elisabete Silva, Clarisse Pais, Luís S. Pais 44
Kim, Y.H., & Chung, K.H. (1990). An integrated evaluation of investment in inventory and credit: A cash flow approach. Journal of Business Finance & Accounting, 17, 381–390. Retrieved October 25, 2015, from EBSCOhost database. Lee, Y.W., & Stowe, J.D. (1993). Product risk, asymmetric information, and trade
credit. Journal of Financial and Quantitative Analysis, 28, 285–300. DOI: 10.2307/2331291. Retrieved October 25, 2015, from EBSCOhost database. Long, M.S., Malitz, I.B., & Ravid, S.A. (1993). Trade credit, quality guarantees
and product marketability. Financial Management, 22, 117–127. Retrieved October 25, 2015, from EBSCOhost database.
Mun, S.G., & Jang, S. (2015). Working capital, cash holding, and profitability of restaurant firms. International Journal of Hospitality Management, 48,
1–11. DOI:10.1016/j.ijhm.2015.04.003. Retrieved October 25, 2015, from ScienceDirect database.
Okręglicka, M. (2014). The economic recession and working capital management of companies in Poland. Economy & Business, 8, 696-706. Retrieved October 25, 2015, from http://www.scientific-publications.net/en/article/1000427/ Paul, S. & Boden, R. (2008). The secret life of UK trade credit supply: Setting a new
research agenda. The British Accounting Review, 40, 272-281. DOI:10.1016/j. bar.2008.05.007. Retrieved October 25, 2015, from EBSCOhost database. Paul, S., & Wilson, N. (2006). Trade credit supply: an empirical investigation of
companies level data. Journal of Accounting-Business and Management, 13, 85-113. Retrieved October 25, 2015, from EBSCOhost database.
Sartoris, W., & Hill, N. (1983). A Generalized Cash Flow Approach to Short-Term Financial Decisions. Journal of Finance, 38, 349–360. DOI: 10.2307/2327967. Schiff, M., & Lieber, Z. (1974). A model for the integration of credit and inventory
management. Journal of Finance, 29, 133–140. DOI: 10.1111/j.1540-6261.1974.tb00029.x. Retrieved October 25, 2015, from EBSCOhost database. Shipley, D. & Davis, L. (1991). The role and burden-allocation of credit in distribution channels,Journal of Marketing Channels, 1. 3–22. Retrieved March 05, 2017, from Taylor&Francis Online.
Smith, J.K. (1987). Trade credit and informational asymmetry, The Journal of Finance, 42, 863–872. DOI: 10.1111/j.1540-6261.1987.tb03916.x. Retrieved March 05, 2017, from Wiley Online Library.
Summers, B. & Wilson, N. (2002). Trade credit terms offered by small firms: survey evidence and empirical analysis. Journal of Business Finance and. Accounting. 29, 317–335. DOI: 10.1111/1468-5957.00434. Retrieved October 25, 2015, from EBSCOhost database.