www.atmos-meas-tech.net/7/2683/2014/ doi:10.5194/amt-7-2683-2014
© Author(s) 2014. CC Attribution 3.0 License.
The Sofia University Atmospheric Data Archive (SUADA)
G. Guerova, T. Simeonov, and N. Yordanova
Sofia University, Faculty of Physics, Department of Meteorology and Geophysics, 5 James Bourchier Blvd., 1164 Sofia, Bulgaria
Correspondence to:G. Guerova ([email protected])
Received: 31 January 2014 – Published in Atmos. Meas. Tech. Discuss.: 5 March 2014 Revised: 15 July 2014 – Accepted: 17 July 2014 – Published: 21 August 2014
Abstract. Atmospheric sounding using the Global Naviga-tion Satellite Systems (GNSS) is a well-established research field in Europe. At present, GNSS data from 1800 stations are available for model validation and assimilation in state-of-the-art models used for operational numerical weather prediction centres in Europe. Advances in GNSS data pro-cessing make it possible also to use the GNSS data for cli-matic trend analysis, an emerging new application. In Bul-garia and southeastern Europe, the use of GNSS for atmo-spheric sounding is currently under development.
As a first step, the Sofia University Atmospheric Data Archive (SUADA) is developed. SUADA is a user-friendly database, and includes GNSS tropospheric products like zenith total delay (ZTD) and derivatives like vertically in-tegrated water vapour (IWV), as well as observations from radiosonde (RS) and surface atmospheric data. Archived in SUADA are (1) GNSS tropospheric products (over 12 000 000 individual observations) and derivatives (over 55 000) from five GNSS processing strategies and 37 sta-tions for the period 1997–2013, with temporal resolusta-tions from 5 min to 6 h, and (2) radiosonde IWV data (over 6000 observations) for station Sofia (1999–2012).
Presented are two applications of the SUADA data for the study of long- and short-term variations of IWV over Bulgaria during the 2007 heatwave and intense precipitation events in 2012.
1 Introduction
Atmospheric water vapour is the most abundant greenhouse gas involved in the climate feedback loop. As the tem-perature of the Earth’s surface and atmosphere increases, so does the moisture-holding capacity of the atmosphere
and atmospheric water vapour is expected to increase in a warmer climate. The evidence is now indisputable (Dessler and Sherwood, 2009) that water vapour increase adds one de-gree Celsius to global warming for every one dede-gree through greenhouse gas emissions. Traditionally, the long-term wa-ter vapour trends have been estimated using the global ra-diosonde (RS) data (Gaffen et al., 1992; Ross and Elliott, 1996, 2001). In the last decade, the use of GNSS tropospheric products has been employed to verify the RS trends, which are not homogeneous due to sensor changes. Gradinarsky et al. (2002) estimate the water vapour trend using GNSS data over Scandinavia and finds it to be positive, with 0.1– 0.2 mm yr−1for the 1993–2000 period. They also report that
winter trends are larger, than summer trends for the southern part of the region and opposite for the northern part. Nils-son and Elgered (2008) analysed data for Sweden and Fin-land for the period 1993–2006 and confirmed the previous findings. Ning (2012) estimates the linear IWV trends, using 15 year global GNSS data set. The trends are found to be in the range−1.65 to+2.32 kg m−2decade−1 and the esti-mated trend uncertainties is of the same order, varying from 0.21 to 1.52 kg m−2decade−1.
campaign in the region of the Black Forest mountains in the summer of 2007 van Baelen et al. (2011) study the relation-ship between water vapour evolution and the life cycle of pre-cipitation systems. They show that (1) frontal systems seem to develop preferentially where the largest amount of water vapour is available, and that (2) water vapour has a predomi-nant role as a precursor for the initiation of local convection. Accumulation of water vapour on the crest of the orography leads to ridge convection and its passing over the orography triggers lee-side convection. De Haan (2008) shows the value of the real-time GNSS–IWV maps for nowcasting by exam-ining two cases studies. The first case is a severe storm on 8 June 2007 and the second case are two thunder-storm events on 20 July 2007. In both cases the convergence of moist air contains information on the location of develop-ing thunderstorms. For the analysis of the case studies several methods are used – radar observations, GPS IWV maps and surface wind observations. The conclusion is that the real-time GPS IWV maps are of good quality and can be helpful for nowcasting of severe thunderstorms. A nine-year study in northern Spain, conducted by Seco et al. (2012), reports that rain events are usually from atmospheric low pressure systems and water vapour entries are caused by Atlantic dis-turbances. They identify three precipitation patterns associ-ated with different behaviour of water vapour during the year. Winter and summer months tend to have characteristic water vapour patterns, while spring and autumn are without clear patterns.
Atmospheric water vapour is also one of the most variable and important parameters for numerical weather prediction (NWP) and forecasting, but is under-sampled in current op-erational meteorological observing systems. Application of GNSS tropospheric products for NWP was the focus of EU projects WAVEFRONT, MAGIC, TOUGH and COST Ac-tion 716. The main achievements of those projects are (1) the set-up of near-real-time processing with data available with a 90 min time lag (Elgered et al., 2005), (2) quality con-trol of the GNSS tropospheric products, and (3) set-up of a real-time GNSS archive. Following their success, the appli-cation of GNSS for NWP is now a well-established technique in Europe. Since 2005, E-GVAP (EIG EUMETNET GNSS Water Vapour Programme, EGVAP project, 2014) has been in charge of the collection and quality control of operational GNSS tropospheric products for NWP in Europe. More than 12 E-GVAP analysis centres (ACs) produce GNSS tropo-spheric products for over 1800 ground-based GNSS stations in Europe, with a target latency of 90 min, and make them available to national meteorologic services. The state of the art is data assimilation of hourly updated ZTD in NWP mod-els. While the production, exploitation and evaluation of op-erational GNSS tropospheric products for NWP is well estab-lished in northern and western Europe, it is still an emerging research field in eastern and southeastern Europe.
This manuscript is a first step towards the application of ground-based GNSS tropospheric products in operational
meteorological and climate observing systems in Bul-garia/southeastern Europe. As a platform for archiving data on an ongoing basis, the Sofia University Atmo-spheric Data Archive (SUADA) was developed. Currently, SUADA includes GNSS tropospheric products and deriva-tives like IWV from 5 processing strategies and total of 37 stations for the period 1999–2013. IWV from the ra-diosonde station Sofia in Bulgaria is also archived in SUADA (About SUADA, 2014). The envisaged applications include (1) cross-validation of ground-based and satellite observa-tions, and derivation of systematic biases, (2) validation of numerical models used for research and numerical weather prediction (NWP), (3) a study of water vapour distribution in Bulgaria/southeastern Europe, (4) detection of long-term wa-ter vapour trends in Bulgaria/southeaswa-tern Europe and links to heatwaves, droughts and changes in the pathway of the At-lantic cyclones, and (5) a study of how well state-of-the-art climate models, notably the one participating in the Inter-governmental Panel on Climate Change (IPCC) AR5 assess-ment, simulate the present climate of Bulgaria/southeastern Europe. SUADA was developed in close collaboration with the Institute of Applied Physics, University of Bern (IAP-UniBe). Since 2001, IAP-UniBe has operated the START-WAVE (STudies in Atmospheric Radiative Transfer and Wa-ter Vapour Effects) database. The STARTWAVE database (Morland et al., 2006a) was funded within the framework of the NCCR Climate project 2001–2013 (NCCR, 2014). The STARTWAVE database was used for studies covering (1) validation of two operational NWP models used in Me-teoSwiss (Guerova et al., 2003), (2) comparison with the 40 year reanalysis data (ERA40) of the European Centre for Medium Range Weather Forecasting (Morland et al., 2006b), and (3) evaluation of the ECHAM5 climate model. STARTWAVE data was used for instrumental intercompar-isons, the major result being detection of daytime bias in the radiosonde observations (Guerova et al., 2005) as well as instrumental problems at the high-altitude Jungfraujoch sta-tion (Guerova et al., 2003). In Switzerland, a consistent pos-itive IWV trend was found by Morland and Maetzler (2007). Analysing IWV during the 2003 heatwave summer, Guerova and Morland (2008) report a large positive IWV anomaly in June and a large negative anomaly during the heatwave in August.
I N ST RU M EN T
ST AT I ON
t
t
iiii iiiiii
iiii iii
COORDI N AT E
&
&
o
o //
VVVVVVVVVVVVVVVVV**
t t jjjj jjjj jjjj jjjj -Z Z Z Z Z Z Z Z Z Z Z Z Z Z Z Z Z Z Z Z Z Z Z Z Z Z Z Z Z Z Z Z
Z ST AT I ON SOU RCE
UUUUUUUUUUUUUUUUU**
t
t
iiiiii iiii
iiiiii i
r
r
ddddddddddddddddddddddddddddddddd
SOU RCE
o
o
M ODEL I N
, , Z Z Z Z Z Z Z Z Z Z Z Z Z Z Z Z Z Z Z Z Z Z Z Z Z Z Z Z Z Z Z Z Z Z Z
SY N OP
* * V V V V V V V V V V V V V V V V V
GN SS I N
RADI OSON DE I N
M ODEL OU T
, , Z Z Z Z Z Z Z Z Z Z Z Z Z Z Z Z Z Z Z Z Z Z Z Z Z Z Z Z Z Z Z Z Z Z Z
Z GN SS OU T
RADI OSON DE OU T
t
t
iiiiiiii iiii
iiiii
F I ELD DEF I N I T I ONoo //U SERSoo //LOG
Figure 1.SUADA data structure and data flow.
2 Sofia University Atmospheric Data Archive (SUADA) 2.1 SUADA structure
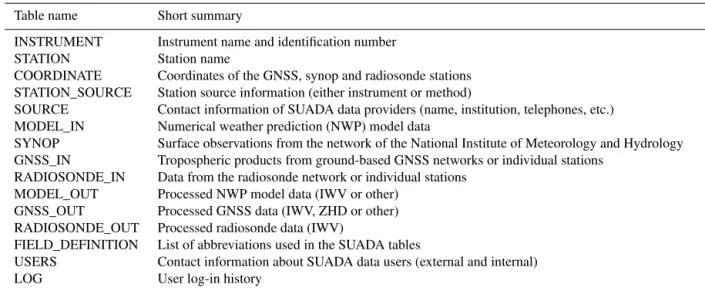
SUADA is developed using Structured Query Language (SQL) for relational database management systems (Codd, 1970). The SUADA tables are structured as peers, with addi-tional relations between them as shown in Fig. 1.
In Fig. 1, the SUADA tables are presented in groups. The first group of tables are “Information tables”: INSTRU-MENT, STATION, COORDINATE, STATION_ SOURCE and SOURCE (rows 1 and 2 in Fig. 1). The second group of tables are the “Primary tables”: MODEL_IN, SYNOP, GNSS_IN and RADIOSONDE_IN (row 3 in Fig. 1). The third group of tables are the “Secondary tables”: MODEL_OUT, GNSS_OUT and RADIOSONDE_OUT (row 4 in Fig. 1). The last group of tables are the “Infor-mation tables for the web portal”: FIELD_DEFINITION, USERS and LOG (row 5 in Fig. 1). A short description of the SUADA tables is given in Table 1. The tables are also accessible from the SUADA web portal.
2.2 SUADA data sets 2.2.1 GNSS data sets
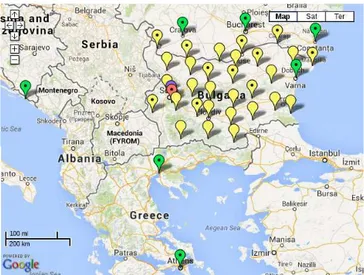
Currently, SUADA has five GNSS data sets processed with different software and strategies. As seen in Table 2, the GNSS data offer a high temporal resolution from 5 min to 6 h, and the IGS station in Sofia, Bulgaria (SOFI, marked by the red pointer in Fig. 2) has been available since 2001. The GNSS data sets are discussed below.
The first SUADA GNSS data set is IGS-repro1. In 2008, the International GNSS Service (IGS) initiated global GNSS data reprocessing campaign (IGS-repro1, Rebischung et al., 2012; Byun and Bar-Sever, 2009). Nine IGS analysis cen-tres contributed to reanalysing the GPS data collected by the IGS global permanent network since 1994 in a fully consistent way using the latest models and methodology. The IGS-repro1 campaign started after adoption of a new set of antenna phase centre calibrations for 65 out of 232 sites of the global IGS network. Archived in SUADA are IGS-repro1 tropospheric products for station SOFI for the period 2001–2007. The ZTD and gradients are processed
Figure 2.SUADA GNSS stations in Bulgaria/southeastern Europe.
with JPL GIPSY/OASIS software, and are available every 5 min for the period 1997–2007. The estimation approach is as follows. (1) Fixed orbits and clocks: IGS Final Re-Analyzed Combined (1995–2007) and IGS Final Combined 2008–Current. (2) Earth orientation: IGS Final Re-Analyzed Combined (1995–2007) and IGS Final Combined (2008– Current). (3) Transmit antenna phase centre map: IGS stan-dards. (4) Receiver antenna phase centre map: IGS stanstan-dards. (5) Elevation angle cut-off: 7◦, (6) mapping function (hydro-static and wet): GMF (Boehm et al., 2006a). (7) Data arc: 24 h. (8) Data rate: 5 min. (9) Estimated parameters: station clock (white noise), station position, wet zenith and (10) de-lay (3 cm h−1random walk), delay gradients (0.3 cm h−1
ran-dom walk), phase biases (white noise).
Table 1.SUADA table names and short descriptions.
Table name Short summary
INSTRUMENT Instrument name and identification number
STATION Station name
COORDINATE Coordinates of the GNSS, synop and radiosonde stations
STATION_SOURCE Station source information (either instrument or method)
SOURCE Contact information of SUADA data providers (name, institution, telephones, etc.)
MODEL_IN Numerical weather prediction (NWP) model data
SYNOP Surface observations from the network of the National Institute of Meteorology and Hydrology
GNSS_IN Tropospheric products from ground-based GNSS networks or individual stations
RADIOSONDE_IN Data from the radiosonde network or individual stations
MODEL_OUT Processed NWP model data (IWV or other)
GNSS_OUT Processed GNSS data (IWV, ZHD or other)
RADIOSONDE_OUT Processed radiosonde data (IWV)
FIELD_DEFINITION List of abbreviations used in the SUADA tables
USERS Contact information about SUADA data users (external and internal)
LOG User log-in history
(post-processing mode EUREF-post), with a two-hourly sampling rate for more than 200 GNSS tracking stations of the permanent EUREF network (EUREF tropospheric de-lays, 2014). On the Balkan Peninsula, there are 15 EUREF stations: 5 stations each in Greece and Romania and 1 sta-tion in Turkey, Croatia, Macedonia, Slovenia and Bulgaria, totaling 15 stations. Bulgarian station SOFI has been part of the EUREF permanent network since 1997. In SUADA are uploaded SOFI tropospheric products from 2001 to 2004 processed by the BKG (Bundesamt für Kartographie und Geodäsie) analysis centre in Germany. BKG produces daily tropospheric solutions using fixed coordinates from weekly solution with Bernese software, 10◦elevation cut-off angle
and elevation dependent weighting. No a priori tropospheric model is used but the zenith total delay is estimated at 1 h in-tervals for each station and the mapping function is Dry Niell (BKG – EUREF Local Analysis Centre, 2014; Niell, 1996).
The fourth SUADA GNSS data set is provided by the Zen-itGEO (Zenitgeo, 2014) private company. Since 2009, the company has operated a GNSS network with 30 GNSS sta-tions, evenly distributed over Bulgaria (marked by the yel-low pointers in Fig. 2). ZenitGEO processes the GNSS data and provides tropospheric products with a very high tem-poral resolution of 5 min (300 s). Currently, IWV is derived for 11 stations (marked by the yellow pointers with dots in Fig. 2), namely Vidin, Oryahovo, Lovech, Veliko Tarnovo, Ruse, Razgrad, Silistra, Shabla, Kyustendil, Pazardzhik and Sliven. It is to be noted that 8 of them are in Northern Bul-garia. The high temporal resolution of the GNSS product is degraded due to the low temporal resolution of the meteoro-logical data set (see Sect. 2.2.3); therefore, in the near fu-ture, use of the NWP model data will be considered (see Sect. 2.2.4). This will also allow the spatial resolution for Bulgaria to be increased.
The fifth SUADA GNSS data set is a targeted process-ing performed by Keranka Vasilleva (Balkan) for the period 19–26 July 2007. GPS data from 19 GNSS permanent sta-tions (AUT1, NOA1, BUCU, COST, DUBR, GLSV, GRAZ, MATE, ORID, PENC, POLV, ROZH, SOFI, SULP, MIKL, WTZR, ZIMM, VARN, CRAI) from central and eastern Eu-rope were processed with the Bernese software, version 5.0. Sixteen of them are IGS and EUREF stations. Seven sessions of 24 h have been created. For each session, hourly station coordinates and ZTD are estimated. The troposphere model used is Saastamoinen dry model (Saastamoinen, 1972) with Niell dry mapping (Niell, 1996) and tilting gradient model. Corrections to the introduced zenith values are estimated and the ZTD and gradients are obtained. Tropospheric prod-ucts for the stations in southeastern Europe: Sofia (SOFI), Dubrovnik (DUBR), Athens (NOA1), Thessaloniki (AUT1), Craiova (CRAI), Constanta (CONS), Bucharest (BUCU) and Varna (VARN) (marked by the green pointers in Fig. 2) are uploaded in the SUADA.
2.2.2 Radiosonde data set
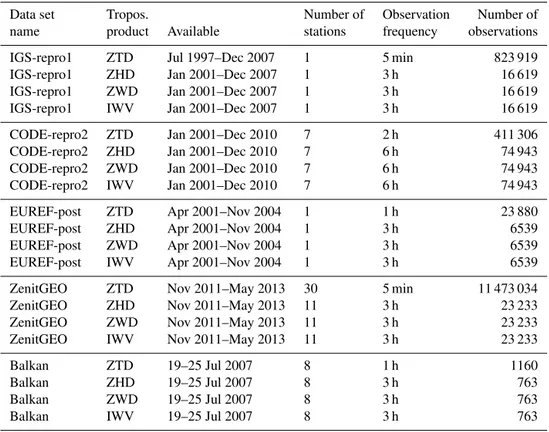
Table 2.GNSS data sets as of 1 October 2013.
Data set Tropos. Number of Observation Number of
name product Available stations frequency observations
IGS-repro1 ZTD Jul 1997–Dec 2007 1 5 min 823 919
IGS-repro1 ZHD Jan 2001–Dec 2007 1 3 h 16 619
IGS-repro1 ZWD Jan 2001–Dec 2007 1 3 h 16 619
IGS-repro1 IWV Jan 2001–Dec 2007 1 3 h 16 619
CODE-repro2 ZTD Jan 2001–Dec 2010 7 2 h 411 306
CODE-repro2 ZHD Jan 2001–Dec 2010 7 6 h 74 943
CODE-repro2 ZWD Jan 2001–Dec 2010 7 6 h 74 943
CODE-repro2 IWV Jan 2001–Dec 2010 7 6 h 74 943
EUREF-post ZTD Apr 2001–Nov 2004 1 1 h 23 880
EUREF-post ZHD Apr 2001–Nov 2004 1 3 h 6539
EUREF-post ZWD Apr 2001–Nov 2004 1 3 h 6539
EUREF-post IWV Apr 2001–Nov 2004 1 3 h 6539
ZenitGEO ZTD Nov 2011–May 2013 30 5 min 11 473 034
ZenitGEO ZHD Nov 2011–May 2013 11 3 h 23 233
ZenitGEO ZWD Nov 2011–May 2013 11 3 h 23 233
ZenitGEO IWV Nov 2011–May 2013 11 3 h 23 233
Balkan ZTD 19–25 Jul 2007 8 1 h 1160
Balkan ZHD 19–25 Jul 2007 8 3 h 763
Balkan ZWD 19–25 Jul 2007 8 3 h 763
Balkan IWV 19–25 Jul 2007 8 3 h 763
The radiosonde is widely used for intercomparison with GNSS-derived integrated water vapour (IWV). To compute the IWV from the radiosonde profiles (RS–IWV), the fol-lowing equation is used:
IWV= 1 ρw
htop Z
h0
ρwv(h)dh, (1)
where h0 is the altitude of the station, where the probe is
released,htopis the maximum achieved height by the probe
during sounding,ρwis the density of water,ρwvis the density
of water vapour. IWV is measured in millimetres (Guerova et al., 2003). A total of 6376 radiosonde IWV data for the period 1997–2012 is archived in SUADA.
The collection of the radiosonde data incurs substantial op-erational costs, which limits the temporal and spatial resolu-tion of this observing system. Radiosonde data is a long-term observation, with time series of over 50 years, which is suit-able for global climatic trend analysis, but which requires careful quantification of possible systematic biases. Studies in Japan (Ohtani and Naito, 2000), Switzerland (Guerova et al., 2005), and France (van Baelen et al., 2005) report bimodal distributions of the GPS and radiosonde residuals. Guerova et al. (2003) report an isolated case of IWV over-estimation by the radiosonde related to the passage through low stratus clouds.
2.2.3 Surface observation data set
Surface observations of (1) pressure, (2) 2 m temperature, (3) 10 m wind speed and direction, (4) precipitation, (5) cloud cover and (6) current weather are archived in SUADA. The measurements are from the surface observation network (synop) of the National Institute of Meteorology and Hydrol-ogy (NIMH) in Bulgaria. The surface data is collected man-ually every 3 h starting at 00:00 UTC. The data is available from OGIMET weather information server (Ogimet Weather Information Service, 2014). In addition, surface observa-tions from 3 staobserva-tions in Romania (Constanta, Crauiova and Bucharest) with hourly update and measurements by auto-matic weather stations are saved. The surface data is used for derivation of IWV from the GNSS tropospheric products as described in Sect. 3. The frequency of the surface observa-tions is a limiting factor in obtaining high temporal resolution of water vapour. Often the surface data is not collocated with the GNSS station and altitude corrections are applied, which reduce the quality of the product.
2.2.4 Numerical weather prediction (NWP) model data set
forecasts of temperature and precipitation for Bulgaria (WRF Weather Forecast, 2014), with a horizontal resolution of 9.7 km. The initial and boundary conditions are from the Global Forecast System (GFS) model, with a horizontal res-olution of 0.5◦.
The WRF model description can be found in Skamarock et al. (2008). The model can be run with a spatial resolu-tion between 1 and 10 km. Numerous specific models, such as the Hurricane Weather Research and Forecasting (HWRF) have been created upon WRF. From the first release in 1990 until now the model has evolved (Michalakes et al., 1998) and additional packages have been developed for interactive nesting, upgraded physics, three-dimensional data assimila-tion and simplified parallelisaassimila-tion (Michalakes et al., 2004). WRF has a large worldwide community, with over 20 000 users in over 130 countries.
The near-future use of the WRF model will be (1) to re-place the synop observations for the derivation of GNSS– IWV, (2) to compare the model water vapour field with GNSS products, and (3) to assimilate GNSS–IWV.
3 GNSS meteorology
The concept of GNSS meteorology was suggested by Bevis et al. (1992). The propagation of the GNSS signal through the atmosphere is affected by the atmospheric gases. The mag-nitude of the atmospheric effects depends on several factors: on the composition of the atmosphere; on the elevation of the receiver (thus on the thickness of the atmosphere); on the ele-vation angle of the satellite; and finally on the amount of wa-ter vapour, which depends mainly on the current atmospheric conditions.
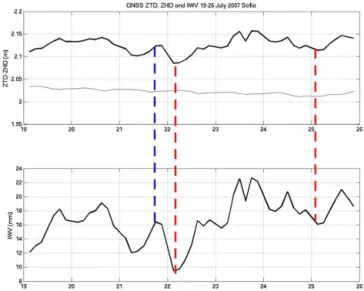
There are two contributing factors for the signal path de-lay in the lower atmosphere–troposphere: they are the hy-drostatic delay and the wet delay. The hyhy-drostatic delay is caused by all the gases in the atmosphere, except the water vapour. The hydrostatic delay in the zenith direction is called zenith hydrostatic delay (ZHD), and as seen from Fig. 3a, is relatively stable on a day timescale. It can be derived by us-ing its dependency on the local atmospheric pressure (Bevis et al., 1992; Emardson et al., 1998):
ZHD=(2.2768±0.0024) ps
f (h, θ ), (2)
f (h, θ )=1−0.00266 cos(2θ )−0.00028h, (3) wherepsis local surface pressure andf (h, θ )is a factor
de-pendent on heighthand the latitude variation of gravitational accelerationθ.
The second contributing factor is the zenith wet delay (ZWD). It is caused by the water vapour in the atmosphere. The ZWD has a large temporal variation in an hour timescale. This is the reason, why the GNSS-derived integrated water vapour (IWV) is so valuable with its high temporal resolu-tion (Fig. 3b). The ZWD contributes less then 10 % of the
Figure 3.GNSS meteorology: ZTD, ZHD and IWV at station SOFI
during the 2007 heatwave from 19 to 25 July.(a)Zenith total
de-lay (ZTD), zenith hydrostatic dede-lay (ZHD) in m, and(b)integrated
water vapour (IWV) in mm. The diurnal cycle of IWV with an in-crease in the afternoon hours and a minimum in early morning is seen well.
zenith total delay (ZTD). ZWD and IWV can be calculated by using
ZWD=ZTD−ZHD, (4)
IWV= 10
6
(k3/Tm+k2)Rv
ZWD, (5)
wherek2,k3 andRv are constant and Tm is the weighted
mean atmospheric temperature. Uncertainties in the IWV derived from ground-based GNSS are caused by errors in (1) surface pressure (1 hPa corresponds to 0.33–0.37 mm in IWV) and (2) ZTD (1 mm corresponds to 0.15–0.16 mm in IWV). The accuracy of IWV is estimated to be in the range ±1 mm.
At present, surface pressure and temperature from the synop stations are used to derive the IWV from GNSS (see Sect. 2.2.3). For example, for 11 stations from the ZenitGEO network appropriate surface synop stations from NIMH net-work (Sect. 2.2.3) are allocated. It is to be noted that the synop observations have a temporal resolution of 3 h, while GNSS tropospheric products have a temporal resolution of 5 min; thus, the derived ZHD, ZWD and IWV are degraded to being three-hourly. In addition, the altitude corrections for temperature and pressure are required for most of the synop stations. For the remaining 19 stations of the ZenitGEO net-work no appropriate surface stations are available. In near fu-ture use of surface pressure and temperafu-ture from the WRF model (Sect. 2.2.4) are envisaged.
Figure 4.Geopotential height at 500 hPa (black lines), surface pres-sure (white lines) and thickness (colour map) at 06:00 UTC on 24 May 2012 from the GFS analysis.
different altitude in the lower atmosphere will thus depend on location and, importantly, on the elevation above sea level. To represent IWV spatial distribution, two-dimensional maps are suggested by Morland and Maetzler (2007). They pro-pose an altitude correction for 500 m a.s.l.:
IWV(0.5)=a×IWV(h)×exp h−
0.5
H
, (6)
where IWV(0.5)is IWV at altitude 500 m, IWV(h)is the es-timated IWV at altitudeh,a are empirically derived coeffi-cients, andHis the scale height. This correction is applied to 11 stations from the ZenitGEO network at altitude between 36 and 542 m. The produced two-dimensional maps are used for convection case studies in Sect. 4.1.
4 Case studies
4.1 Short-term variation of IWV: intense precipitation events in 2012
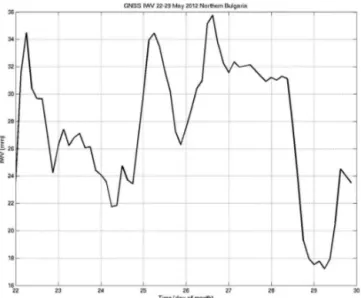
In this work, two events with intense precipitation in Bul-garia, one associated with frontal passage and one with the development of local convection, are presented. The first event is on 25 May 2012, when a cold front passes over Bulgaria. The period 22–29 May is characterised by a low-pressure field over the Mediterranean area. Prolonged precip-itation and thunderstorms are a result of the air mass insta-bility or frontal passage. From 24 to 25 May, a trough can be seen on the 500 hPa map, and a cyclonic field near the surface (Fig. 4). On 24 May, a cold front connected with a cyclonic centre over the Sea of Azov passes over Bulgaria. On the next day, 25 May 2012, another cold front passes Bulgaria from north to south. The intrusion of a cold air mass can be seen
Figure 5.GNSS–IWV for 22–29 May 2012 at Lovech, Bulgaria.
in Fig. 5 at 15:00 UTC over Northern Bulgaria. The water vapour values decrease by 10, to 25 mm (Fig. 4).
For the period 24–27 June, the weather is dynamic, changeable with unstable air mass, cumulonimbus cloud de-velopment and precipitation with different ranges and inten-sities. On 26 June, a cold front passes over Bulgaria, and the temperature at 850 hPa drops from 18◦C at 00:00 UTC to around 10◦C at 06:00 UTC on 27 June 2012. There is a considerable temperature gradient both at altitude and sur-face, and the maximum temperature decreased by 5–6◦C. At
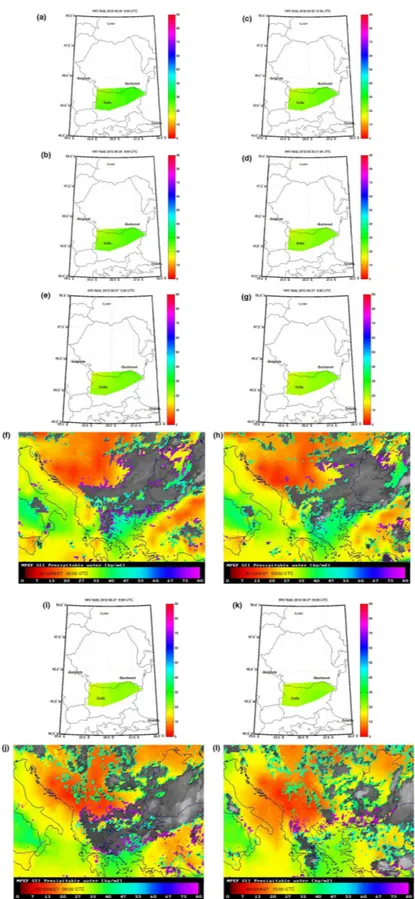
12:00 UTC on 26 June, dry air mass was advected from north to west, spreading along the Balkan mountain range (Fig. 6). This pathway of cold and dry air is usually associated with intense precipitation of both rain and snow in the spring and autumn seasons. The consecutive two-dimensional IWV maps from 26 and 27 June capture well the advancement of the dry air mass. In less than 24 h the IWV in Northern Bul-garia decreased by half from above 35 mm at 06:00 UTC on 26 June to 15–20 mm at 03:00 UTC on 27 June. After the cold front passage on 26 June the air mass remains unstable with high relative humidity at level 700 hPa and warming at high altitudes (200 hPa) contributing for the convection de-velopment. On 27 June, the advected dry air catches the re-ceding humid air mass, resulting in isolated convective cell development, with thunderstorms and intense precipitation. Intense rainfall of 74 L m−2for six hours is recorded between
Figure 6.Two-dimensional IWV maps from GNSS on 26 June 2012 at(a)06:00 UTC,(b)09:00 UTC,(c)12:00 UTC and(d)21:00 UTC.
Two-dimensional maps on 27 June 2012 at 00:00 UTC:(e)GNSS and(f)Meteosat, 06:00 UTC;(g)GNSS and(h)Meteosat, 09:00 UTC;
Figure 7. Top figure: monthly mean IWV for SOFI, Bulgaria (thick line 2007, dashed line 2001–2010). Bottom figure: monthly anomaly (difference 2007 mean and 2001–2010 mean) from GNSS (open circles) and radiosonde (filled circles).
analysis of 20 further convective situations for 2012. This work is a contribution to working group two of COST Action ES1206 “Advanced Global Navigation Satellite Systems tro-pospheric products for monitoring severe weather events and climate (GNSS4SWEC)”.
4.2 Long-term variation of IWV: the 2007 heatwave Heatwaves have become a common summer feature in south-eastern Europe (Matzarakis et al., 2007). The July 2007 heat-wave has the largest geographical extension, reaching Bul-garia. The atmospheric circulation leading to the heatwave is characterised by a northerly displacement of the subtropical jet stream (flow at 200 hPa) that allowed subtropical African air to reach southeastern Europe as far as 50◦N. The GNSS– IWV from the IGS repro2 and RS–IWV are used to study the 2007 heatwave. The annual and seasonal mean GNSS–IWV for the period 2001–2010 is compared to the 2007 period, and is presented in Table 3.
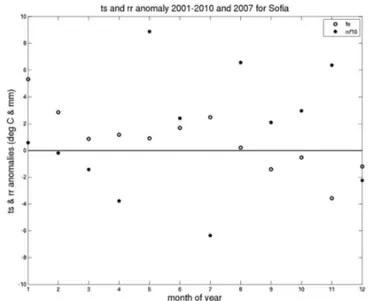
Figure 8.Monthly anomaly of temperature (open circles) and
pre-cipitation (filled circles) for Sofia, Bulgaria.
As seen in Table 3, the annual GNSS–IWV in 2007 is 14.0 mm, and is similar to the 2001–2010 mean. The sea-sonal values show that in 2007 the GNSS–IWV is larger for winter (+5 %) and smaller for summer and autumn (−5 and −6 % respectively). For comparison, the IWV from the ra-diosonde (RS–IWV) station in Sofia is also presented in Ta-ble 3. The RS–IWV annual, winter, summer and autumn sea-sonal means in 2007 have the same tendency as GNSS–IWV. It is to be noted that there is a difference between the sam-pling rates of GNSS and RS, the first being 3 h, while the sec-ond is once a day at 12:00 UTC. In addition, the radiossec-onde station is in Sofia (marked by the red pointer in Fig. 2) and at an altitude of 590 m, while the GNSS station is on the Plana mountain (marked by the blue pointer in Fig. 2) and at an altitude of 1120 m.
In addition, the monthly IWV anomalies are studied. In Fig. 7 are plotted GNSS–IWV and RS–IWV anomalies. When GNSS–IWV in 2007 (solid line in Fig. 7a) is compared to 2001–2010 (dashed line in Fig. 7a), the following features stand out: (i) an IWV decrease in April, (ii) an IWV increase in May, and (iii) a sharp IWV decrease in July. Clearly seen from Fig. 7b is that the largest negative IWV anomaly is in July, about−4 mm from GNSS–IWV and−5 mm from RS– IWV. There is very good correlation of the anomaly from the two techniques despite the different sampling rates and loca-tions. The difference between the GNSS–IWV and RS–IWV anomaly is under 0.5 mm in 7 months, between 0.5 and 1 mm in 2 months, and about 1 mm in 3 months.
Table 3.Columns 1–3 are the station name and annual mean for 2001–2010 and 2007 respectively; columns 4–5: winter DJF (December, January and February) mean for 2001–2010 and 2007; columns 6–7: spring MAM (March, April and May) mean for 2001–2010 and 2007; columns 8–9: summer JJA (June, July and August) mean for 2001–2010 and 2007; columns 10–11: autumn SON (September, October and November) mean for 2001–2010 and 2007. The 2007 departure from the 2001–2010 mean is given in % in the brackets.
Station 2001–2010 2007 2001–2010 2007 2001–2010 2007 2001–2010 2007 2001–2010 2007
IWV–IGS repro2 mm mm DJF DJF MAM MAM JJA JJA SON SON
SOFI 14.3 14.0 8.0 8.4 12.7 12.7 21.8 20.6 14.8 14.0
Change −2 % +5 % 0 % −5 % −6 %
IWV–RS mm mm DJF DJF MAM MAM JJA JJA SON SON
Sofia 15.5 15.1 8.8 9.1 13.6 13.2 23.9 22.5 16.0 15.5
Change −3 % +3 % −3 % −6 % −3 %
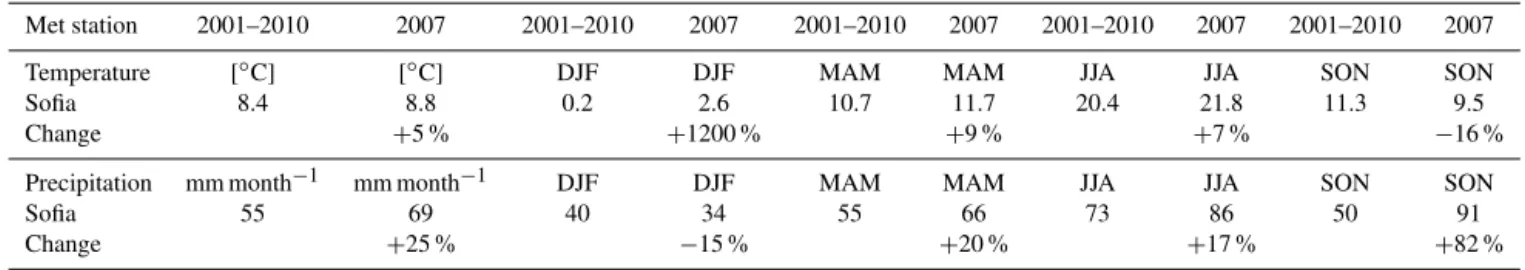
Table 4.Annual and seasonal means of IWV, temperature and precipitation for station Sofia, Bulgaria for winter (DJF), spring (MAM),
summer (JJA) and autumn (SON) for 2001–2010 and 2007.
Met station 2001–2010 2007 2001–2010 2007 2001–2010 2007 2001–2010 2007 2001–2010 2007
Temperature [◦C] [◦C] DJF DJF MAM MAM JJA JJA SON SON
Sofia 8.4 8.8 0.2 2.6 10.7 11.7 20.4 21.8 11.3 9.5
Change +5 % +1200 % +9 % +7 % −16 %
Precipitation mm month−1 mm month−1 DJF DJF MAM MAM JJA JJA SON SON
Sofia 55 69 40 34 55 66 73 86 50 91
Change +25 % −15 % +20 % +17 % +82 %
amount in 2007 was 25 % higher than the 2001–2010 amount. However, the winter was 15 % drier (column 5 in Table 4), and from spring, only the month of May has a pos-itive precipitation anomaly over 80 mm, as seen in Fig. 8. In the summer of 2007, the month of July was very dry (about 60 mm less than the 2001–2010 mean).
5 Conclusions
The Sofia University Atmospheric Data Archive (SUADA) is a regional database for Bulgaria and southeastern Europe. GNSS tropospheric products (over 12 000 000 individual ob-servations) and derivatives (over 55 000) from five GNSS processing strategies and 37 stations for the period 1997– 2013 are archived in SUADA. The temporal resolution of the GNSS data is from 5 min to 6 h. In addition, over 6000 individual IWV from the radiosonde station in Sofia for the period 1999–2012 are archived in SUADA.
The application of SUADA data is shown in case stud-ies for intense precipitation events in 2012 and during the heatwave in 2007. At 12:00 UTC on 26 June dry air mass was advected from the northwest, spreading along the Balkan mountain range. Near the Black Sea coast, the advected dry air catches the receding humid air mass, resulting in the development of local convection and intense rainfall with 74 L m−2. The two-dimensional IWV maps capture well the advancement of the dry air mass. In less than 24 h, the IWV in Northern Bulgaria decreased by half, from above 35 mm
at 06:00 UTC on 26 June to 15–20 mm at 03:00 UTC on 27 June. The strong north–south gradient of IWV over the Balkan Peninsula is confirmed by the Meteosat-derived prod-uct. The second application of the SUADA data is a study of the IWV anomaly during the 2007 heatwave in Bulgaria. Despite the difference in the location and sampling rate, the two data sets give a negative IWV anomaly in July 2007 of about−4 mm from GNSS–IWV, and−5 mm from RS–IWV. July 2007 has less IWV compared to 2001–2010, with−16 and−19 % respectively for GNSS–IWV and RS–IWV.
This work is a first step in the application of GNSS tropo-spheric products for atmotropo-spheric sounding in Bulgaria and southeastern Europe. The work will continue with (1) an improvement in the temporal and spatial resolution of the GNSS–IWV, notably the ZenitGEO, (2) validation of NWP model WRF with the GNSS data set for Bulgaria, (3) analy-sis of additional convective cases in 2012, and (4) an analyanaly-sis of the diurnal cycle of GNSS–IWV during 18 fog events at Sofia Airport in the period 2011–2012. The work is a con-tribution to working groups two and three of COST Action ES1206 “Advanced Global Navigation Satellite Systems tro-pospheric products for monitoring severe weather events and climate (GNSS4SWEC)” 2013–2017.
Ch. Georgiev and A. Stoycheva from the National Institute of Meteorology and Hydrology provided the Meteosat IWV plots and the detailed analysis of the weather conditions. The tropospheric products are the result of collaboration with the ZenitGEO team and Keranka Vassileva.
Edited by: M. Nicolls
References
About SUADA: available at: http://suada.phys.uni-sofia.bg/
?pageid=185 (last access: 31 January 2014), 2014.
Bevis, M., Businger, S., Herring, T., Rocken, C., Anthes, R., and Ware, R.: GPS meteorology: remote sensing of atmospheric wa-ter vapor using the Global Positioning System, J. Geophys. Res., 97, 15787–15801, 1992.
BKG – EUREF Local Analysis Centre: available at: http://www. epncb.oma.be/ftp/center/analysis/BKG.LAC (last access: 31 Jan-uary 2014), 2014.
Boehm, J., Niell, A., Tregoning, P., and Schuh, H.: The Global Map-ping Function (GMF): A new empirical mapMap-ping function based on data from numerical weather model data, Geophys. Res. Lett., 33, L07304, doi:10.1029/2005GL025546, 2006a.
Boehm, J., Werl, B., and Schuh, H.: Troposphere mapping functions for GPS and very long baseline interferometry from European Centre for Medium-Range Weather Forecasts operational analysis data, J. Geophys. Res., 111, B02406, doi:10.1029/2005JB003629, 2006b.
Byun, S. and Bar-Sever, Y.: A new type of troposphere zenith path delay product of the international GNSS service, J. Geodesy, 83, 367–373, doi:10.1007/s00190-008-0288-8, 2009.
Codd, E.: A relational model of data for large shared data banks, Commun. ACM, 13, 377–387, doi:10.1145/362384.362685, 1970.
CODE Analysis Strategy Summary: available at: http://igscb. jpl.nasa.gov/igscb/center/analysis/code.acn (last access: 31 Jan-uary 2014), 2014.
Dach, R., Brockmann, E., Schaer, S., Beutler, G., Meindl, M., Prange, L., Bock, H., Jaeggi, A., and Ostini, L.: GNSS process-ing at CODE: status report, J. Geodesy, 83, 353–366, 2009. de Haan, S.: Meteorological applications of a surface network of
Global Positioning System receivers, Ph. D. thesis, Wageningen University, 2008.
Dessler, A. E. and Sherwood, S. C.: A matter of humidity, Science, 323, 1020–1021, 2009.
EGVAP project: available at: http://egvap.dmi.dk/ (last access: 31 January 2014), 2014.
Elgered, G., Plag, P., van der Marel, H., Barlag, S., and Nash, J. (Eds.): COST 716: Exploitation of ground-based GPS for oper-ational numerical weather prediction and climate applications, European Commission, Brussels, 2005.
Emardson, T., Elgered, G., and Johanson, J.: Three months of con-tinuous monitoring of atmospheric water vapor with a network of Global Positioning System receivers, J. Geophys. Res., 103, 1807–1820, 1998.
EUREF tropospheric delays: available at: http://www.epncb.oma. be/_productsservices/sitezenithpathdelays/ (last access: 31 Jan-uary 2014), 2014.
Gaffen, D., Elliott, W., and Robock, A.: Relationship between tropospheric water vapor and surface temperatures as ob-served by radiosondes, Geophys. Res. Lett., 19, 1839–1842, doi:10.1029/92GL02001, 1992.
Gradinarsky, L., Johansson, J., Bouma, H., Scherneck, H.-G., and Elgered, G.: Climate monitoring using GPS, Phys. Chem. Earth, 27, 335–340, 2002.
Graham, E., Koffi, E., and Matzler, C.: An observational study of air and water vapour convergence over the Bernese Alps, Switzer-land, during summertime and the development of isolated thun-derstorms, Meteorol. Z., 21, 561–574, 2012.
Guerova, G. and Morland, J.: Water vapour anomaly during the 2003 summer in Switzerland, in: AGU Chapman Conference, p. 1, Hawaii, USA, 20–24 October 2008.
Guerova, G., Brockmann, E., Quiby, J., Schubiger, F., and Mat-zler, C.: Validation of NWP mesoscale models with Swiss GPS Network AGNES, J. Appl. Meteorol., 42, 141–150, 2003. Guerova, G., Brockmann, E., Schubiger, F., Morland, J., and
Mat-zler, C.: An integrated assessment of measured and modeled IWV in Switzerland for the period 2001–2003, J. Appl. Mete-orol., 44, 1033–1044, 2005.
Matzarakis, A., de Freitas, C., and Scott, D.: Developments in tourism climatology, in: Commission Climate, Tourism and Recreation, International Society of Biometeorology, 2007. Meindl, M., Dach, R., and Jean, Y.: International GNSS Service
Technical Report, Tech. rep., IGS Central Bureau, 2011. Michalakes, J., Dudhia, J., Gill, D., Klemp, J., and Skamarock, W.:
Design of a Next-Generation Regional Weather Research and Forecast Model, World Scientific, River Edge, New Jersey, 117– 124, 1998.
Michalakes, J., Dudhia, J., Gill, D., Henderson, T., Klemp, J., Ska-marock, W., and Wang, W.: The Weather Reseach and Fore-cast Model: software architecture and performance, in: Proceed-ings of the 11th ECMWF Workshop on the Use of High Perfor-mance Computing In Meteorology, edited by: Mozdzynski, G., 25–29 October 2004, Reading UK, 2004.
Morland, J. and Mätzler, C.: Spatial interpolation of GPS integrated water vapour measurements made in the Swiss Alps, Meteorol. Appl., 14, 15–26, 2007.
Morland, J., Deuber, B., Feist, D. G., Martin, L., Nyeki, S., Kämpfer, N., Mätzler, C., Jeannet, P., and Vuilleumier, L.: The STARTWAVE atmospheric water database, Atmos. Chem. Phys., 6, 2039–2056, doi:10.5194/acp-6-2039-2006, 2006a.
Morland, J., Liniger, M. A., Kunz, H., Balin, I., Nyeki, S., Mat-zler, C., and Kampfer, N.: Comparison of GPS and ERA40 IWV in the Alpine region, including correction of GPS observa-tions at Jungfraujoch (3584 m), J. Geophys. Res., 111, D04102, doi:10.1029/2005JD006043, 2006b.
NCCR Climate: available at: http://www.nccr-climate.unibe.ch/ (last access: 31 January 2014), 2014.
Niell, A.: Global Mapping Functions for the Atmosphere Delay at Radio Wavelength, J. Geophys. Res., 101, 3227–3246, 1996. Nilsson, T. and Elgered, G.: Long-term trends in the atmospheric
water vapor content estimated from ground-based GPS data, J. Geophys. Res., 113, D19101, doi:10.1029/2008JD010110, 2008. Ning, T.: GPS Meteorology: With Focus on Climate Applications,
Ph. D. thesis, Chalmers University of Technology, 2012. Ogimet Weather Information Service: available at: http://www.
Ohtani, R. and Naito, I.: Comparisons of GPS-derived precipitable water vapors with radiosonde observations in Japan, J. Geophys. Res., 105, 26917–26929, doi:10.1029/2000JD900362, 2000. PHYSON: available at: http://physon.phys.uni-sofia.bg (last access:
31 January 2014), 2014.
Rebischung, P. J., Griffiths, Ray, J., Schmid, R., Collilieux, X., and Garayt, B.: IGS08: the IGS realization of ITRF2008, GPS Solut., 16, 483–494, 2012.
Ross, R. and Elliott, W.: Tropospheric water vapor climatology and trends over north America: 1973–93, J. Climate, 9, 3561–3574, doi:10.1175/1520-0442(1996)009<3561:TWVCAT>2.0.CO;2, 1996.
Ross, R. and Elliott, W.: Radiosonde based Northern Hemisphere tropospheric water vapor trends, J. Climate, 14, 1602–1612, doi:10.1175/1520-0442(2001)014<1602:RBNHTW>2.0.CO;2, 2001.
Saastamoinen, J.: Atmospheric correction for the troposphere and stratosphere in radio ranging of satellites, in The Use of Arti-ficial Satellites for Geodesy, Geophys. Monogr. Ser., 15, edited by: Henriksen, S. W., Mancini, A., and Chovitz, B. H., 247–251, AGU, Washington, D.C., 1972.
Schroedter-Homscheidt, M., Drews, A., and Heise, S.: Total water vapor column retrieval from MSG-SEVIRI split win-dow measurements exploiting the daily cycle of land sur-face temperatures, Remote Sens. Environ., 112, 249–258, doi:10.1016/j.rse.2007.05.006, 2008.
Seco, A., Ramirez, F., Serna, E., Prieto, E., Garcia, R., Moreno, A., Cantera, J., Miqueleiz, L., and Priego, J.: Rain pattern analysis and forecast model based on GPS estimated atmospheric water vapor content, Atmos. Environ., 49, 85–93, 2012.
Skamarock, W. C., Klemp, J. B., Dudhia, J., Gill, D. O., Barker, D. M., Duda, M. G., Huang, X-Y., Wang, W., and Pow-ers, J. G.: A description of the Advanced Research WRF version 3, NCAR Tech.Note, NCAR/TN-475STR, 113 pp., 2008. Weather Research and Forecasting Model (WRF): available at: http:
//wrf-model.org/index.php (last access: 31 January 2014), 2014. WRF Weather Forecast: available at: http://suada.phys.uni-sofia.bg/
?pageid=2132 (last access: 31 January 2014), 2014.
van Baelen, J., Aubagnac, J.-P., and Dabas, A.: Comparison of near-real time estimates of integrated water vapor derived with GPS, radiosondes, and microwave radiometer, J. Atmos. Ocean. Tech., 22, 201–210, 2005.
van Baelen, J., Reverdy, M., Tridon, F., Labbouz, L., Dick, G., Bender, M., and Hagen, M.: On the relationship between water vapour field evolution and the life cycle of precip-itation systems, Q. J. Roy. Meteorol. Soc., 137, 204–223, doi:10.1002/qj.785, 2011.