Samples
SUELY PATRICIA COSTA GONC
¸ ALVES, SANDRA MARA MARTINS FRANCHETTI
Department of Biochemistry and Microbiology, UNESP – S˜ao Paulo State University, Rio Claro, SP, Brazil Correspondence to: Sandra Mara Martins Franchetti; e-mail: [email protected].
Received: June 30, 2014 Accepted: September 20, 2014
ABSTRACT: This work studied the biodegradation of polyethylene/poly(hydroxybutyrate-co-hydroxyvalerate) (PE/PHBV) and polypropylene/PHBV (PP/PHBV) films, by respirometry in soil, using biometric flasks. Additionally, the characteristics of the soil were measured by pH, moisture, organic matter content, and quantification of microorganisms. The soil analysis showed that the two blends inhibited the soil bacteria activity and stimulated the growth of fungi. The PE/PHBV (80/20) blend is more susceptible to the microbial action in the soil than the PP/PHBV (80/20) blend. The blends showed higher biodegradation in the PHBV amorphous phase, due to consumption of ester groups, leading to rearrangement of the crystalline phase of PHBV fraction. On the basis of quantification of CO2, the PE/PHBV (80/20) film showed approximately 7% biodegradation, and the beginning occurred in a period
of 60 days. Moreover, the employed methods Fourier transform infrared spectroscopy and X-ray diffraction completed the information obtained by the respirometry method, showing evident changes in the polymer chains structure and crystallinity, respectively. C 2014 Wiley Periodicals, Inc. Adv Polym Technol 2015, 34, 21486; View this article online at wileyonlinelibrary.com. DOI 10.1002/adv.21486
KEY WORDS: Blends, FT-IR, X-ray, Respirometry, Soil
Introduction
T
he use of polymeric materials in daily life has increased dramatically in recent decades. After disposal, high lev-els of plastic debris persist in the environment, which generates several cumulative effects. The biodegradability of polymeric materials is dependent on the reaction of their structure in the presence of degradative microbial populations and on environ-mental conditions that favor microbial growth. The attack of mi-croorganisms on polymeric materials depends on the specificity of the microorganisms, the chemical and physical properties of the materials and environmental conditions.1In general, organic and synthetic compounds undergo de-composition in the soil through the process of aerobic soil respi-ration, which causes oxidation (loss of electrons) of the substrate, which can oxidize completely into CO2, with greater production
of adenosine triphosphate.2Therefore, the assessment of
micro-bial respiration is one of the most widely used parameters to quantify the activity of soil microbes.
Several analytical methods for monitoring the biodegrada-tion of polymers and standards have been established in order to standardize the procedures involved in biodegradation. These standards are commonly used to measure the CO2 released
in aerobic environments, sewage effluents, activated sludge,
Contract grant sponsor: Capes—PNPD (2255/2009).
and controlled composting.3–7Although these testing methods
share the same principles, they differ in the composition of the medium, inoculum, and the technique to measure the evolution of gas. In most tests, a conversion of 60–90% of the substrate to CO2 is expected to occur within 6 months, indicating the
biodegradability of polymeric materials.8
However, little is known about the properties of the soil and parameters used. Soil is a complex ecosystem that encompasses an enormous diversity of organisms belonging to different taxo-nomic and physiological groups that interact at different levels within the community.9The parameters attributed to soil quality
enabled the evaluation of the physical, chemical, and biological properties of the soil in order to gain an understanding of the polymer biodegradation process.
Polyolefins such as polypropylene (PP) and polyethylene (PE) are the most widely used synthetic petrochemical-based polymeric materials, due to their ease of processing into various products, including packaging materials and equipments10and
good mechanical properties. Since synthetic polymers are diffi-cult to biodegrade, one strategy for addressing this issue is to use blends or bio-based composite materials whose properties allow the reduction of the environmental impact caused by synthetic polymers.11
Poly(hydroxybutyrate) (PHB) is a crystalline thermoplas-tic produced from renewable resources such as microbial organisms,12 in addition to being biodegradable in natural
environments.13 A study on the blend properties of poly
(PLA) showed that blends of PHBV/PLA are not miscible. The morphological analyses indicated that increasing the PHBV content in the polymer blends results in increasing the PLA crystallinity, as the finely dispersed PHBV crystals act as a filler and a nucleating agent for PLA.14 Other PHBV blends
has been investigated such as with PP and PE, showing the effect of the degradable polymer on the synthetic polymers.15–17
According Massoud et al.,17the attachment of microorganisms
on the PP/PHBV blend caused the oxidation process, resulting in the formation of different functional groups, i.e., alcohols, aldehydes, ketones, carboxyls, and the metabolites that are used by microbial cells.
G ´omez and Michel18 studied the relative
biodegradabil-ity of a range of polymeric materials and natural fiber composites used for various commercial applications by measuring the average carbon (CO2 and or CH4)
mineral-ized from each treatment under composting, soil incubation, and anaerobic digestion conditions. The results showed that during 660 days soil incubation, substantial mineralization was observed for polyhydroxyalkanoate plastics, starch-based plastics, and materials made from compost. No significant degradation was observed for PE or PP plastics or the same plastics amended with commercial additives meant to confer biodegradability.
The combination of renewable resources polymers with syn-thetic polymers and the effect of properties of the soil during the biodegradation process may have influence on the biodegra-dation of the polymeric material. In this case, we have the polyolefins with excellent barrier properties, but difficult to degrade;19 in contrast, the PHBV is susceptible to microbial
action, especially if the HV content increases in the copolymer, causing crystallinity decrease.20,21This study evaluated the
con-dition of soil before and after respirometric tests and its influ-ence on the biodegradation of PP/PHBV (80/20) and PE/PHBV (80/20) blends.
Materials and Methods
POLYMERS
The polymeric materials used in this study were PP (HP 550; Mw = 145,000 g/mol, supplied by Braskem, S˜ao Paulo, Brazil), PE (BP-681/59, supplied by Braskem, S˜ao Paulo, Brazil). The polymers were mixed for 15 min in a Thermo Haake rheometer operating at 170°C and 60 rpm (Department of Metallurgical and Materials Engineering, University of S˜ao Paulo, Brazil). The PP/PHBV and PE/PHBV (80/20, w/w) blends (granules) were compression molded for 3 min at 170°C between two aluminum sheets in a hot hydraulic press. All the films thus prepared showed an average thickness of 100µm.
FOURIER TRANSFORM INFRARED SPECTROSCOPY
Infrared spectra were analyzed using a Shimadzu IR-Prestige21 FTIR spectrometer with a resolution of 4 and 400–4000 cm−1. The Fourier transform infrared spectroscopy
(FTIR) band intensities were determined from the corrected profiles, using Lorentz deconvolution software (Shimadzu).
X-RAY DIFFRACTION
X-ray diffraction (XRD) measurements were taken using a Rigaku RU-200B diffractometer (belonging to IFSC/USP, S˜ao Carlos, SP, Brazil) operating at 50 kV and 100 mA using a CuKα
radiation wavelength of 1.54 A as the X-ray source. Diffraction patterns were recorded in the range of 2θ =10–35o at a scan
speed of 0.36/min at room temperature.
SCANNING ELECTRON MICROSCOPY
Scanning electron microscopy (SEM) was used to investigate the effects of biodegradation on the morphology of polymers films before and after biodegradation. The samples were pre-pared using conventional gold sputter coating and analyzed under a Zeiss DSM 940-A scanning electron microscope, using an acceleration voltage of 4 keV.
SOIL
Soil samples for the biodegradation tests were collected from a garden area (S˜ao Paulo State University, Rio Claro, SP, Brazil; 22°23′45′′S, 47
°32′35′′W) and from the top 15-cm depth. The soil was sifted through a 3-mm sieve and the sifted particles were used in the tests. According to the K ¨oppen classification, the soil used was taken from a region that has a Cwaclimate, with annual pluvial precipitation of 1366.8 mm and average annual temperature of 21.6°C.22
SOIL ANALYSIS
Soil samples were analyzed by measuring several physico-chemical properties (organic matter, moisture content, pH, quan-tification of microorganisms, and toxicity) after 180 days of incubation of the polymer in the soil. The pH of the soil was determined in 0.01 M of CaCl2 (1:2.5, w:v).23 The soil sample
moisture content was determined by oven dry at 105±3°C for 24 h.23
Soil’s organic matter content was determined based on the method of combustion of organic matter in a muffle furnace.24
According to Pereira et al.,24determining the organic matter by
the combustion method is satisfactory for soil samples with high organic carbon content.
The number of bacteria and fungi was determined by using plate count agar to enumerate bacteria and potato dex-trose agar (PDA) supplemented with chloramphenicol (PDA– chloramphenicol) to enumerate fungi growing on Petri dishes, which were both incubated at 30°C for 48 h.25
BIODEGRADATION TEST–RESPIROMETRIC TEST
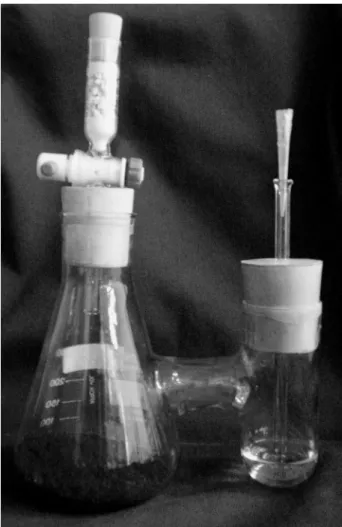
Biometer flasks were used for the biodegradation tests, as originally suggested by Bartha and Pramer.26 Each biometer
production was measured volumetrically at intervals of approx-imately 24 h for 180 days.
The amount of CO2 generated by the samples during the
respirometric test was calculated according to Eq. (1) (adapted from ISO 14855),27 where VA is the volume of HCl used for
titration.
mCO2(mg)= {[KOH]/[HCl]×10−VA} ×[HCl]×44 (1)
The calculations to determine the amount of CO2generated
by the samples and their percentage of biodegradation during the respirometric test (Eqs. (2) and (3) were based on the ISO 14855 standard.27 The CO
2 produced by biodegradation was
determined from the difference between the values of CO2
pro-duced in the flask containing the soil/polymer sample and the control flask (soil). The percentage of biodegradation of each sample was determined based on the ratio of the amount of CO2
produced by biodegradation of the material to the theoretical amount of CO2(ThCO2) released by it,21where “m” is the mass
of the film (mg) and Xc is the quantity of carbon in the film (in this case based on its chemical formula).
ThCO2=m×XC×(44/12) (2)
FIGURE 1. Biometer flask.
%Biodegradation=(mCO2/ThCO2)×100 (3)
Results and Discussion
Table I presents the results of soil samples after 180 days of incubation of each tested blend in the biometer flask. After the biodegradation test, the pH of the soil in the flasks was 6.7 and 6.6, respectively, for control soil and blends. The amount of organic matter after the biodegradation test showed a variation of about 5% in the control soil and 3% in the blends, compared with the original soil. The moisture content of soil samples after degradation varied according to the material contained in the biometer flasks.
Changes in the soil microbial community after biodegra-dation were dependent on the type of polymer. The bacterial population in the soil containing PP/PHBV and PE/PHBV de-creased. However, the fungal population increased after 180 days of biodegradation; thus, in this case especially, these two factors along with the soil conditions favored the biodegradation process.
Microbial activity is influenced by several variables such as temperature, moisture, availability of nutrients, and input of organic matter, which are closely related to geographical coordi-nates and climate.28Soil’s water content is also essential for the
microorganisms because it affects the intracellular metabolism, the movement of nutrients, toxic substances, and adherence to clay particles.29Another important factor in microbial growth is
soil’s pH, which can directly affect the metabolism, membrane permeability, and adsorption, or indirectly affect the physiology and solubility of toxic elements.2
Other related works show different results depending on the soil conditions and the polymer type. The degradation of a-PHB, binary blends with natural PHB (n-PHB), and poly(L-lactic acid) (PLLA), respectively, were investigated in the soil by Rytcher et al.30Soil used in the experiments had a composition of 83%
sand, 11% dust, and 6% loam, with average moisture of 15% and temperature of 22 ±2°C. During the experiment, the number of all tested microorganisms decreased slowly with the time of degradation. However, in the soil with an a-PHB/n-PHB blend after 42 and 70 days, an increase in the number of bacteria has been observed; and in the soil with PLLA and a-PHB/PLLA films, there have been no changes were observed in bacterial population during the incubation time. After a specified period of polymeric samples degradation indicated a slight increase in both acidity and salinity. The authors conclude that the addition of a-PHB accelerates the process of degradation of natural PHB, and in the presence of mineral fertilizer, the erosion of all samples occurs faster than that without fertilizer.30
Weng et al.31 studied the biodegradation of the
TABLE I
Properties of the Soil Used in the Respirometric Tests
Material pH (CaCl2) (±0.3) Organic Matter (g/kg) (±16.2) Moisture (%) (±1.8) Bacteria (106CFU/g) Fungi (105CFU/g)
Initial soil 6.2 413.0 32.0 1.8 1.0
Control soil test 6.7 390.0 27.9 1.5 1.4
PP/PHBV (80/20) 6.6 400.4 28.6 1.3 1.6
PE/PHBV (80/20) 6.6 400.8 27.6 1.0 1.5
erosion from the surface to the interior, whereas PLA was hydrolytically degraded, which was the reason that it had differ-ent degradation rates at differdiffer-ent depths of soil, where there were different moisture levels and microbial strains.31 C´esar et al.32
studied the mineralization of poly(3-caprolactone) and adipate-modified starch blend in soils with different textures. On the basis of their analysis of the evolution of CO2, the authors
con-cluded that the soil texture affected the kinetics of mineraliza-tion of polymers and degradamineraliza-tion is faster in clayey soils than in sandy soils.
The influence of soil’s physical and chemical parameters on microbial activity is not linear, but rather complex, and is reflected in the individual responses of the various species of microorganisms and their enzymatic systems.29Thus, each
fac-tor directly or indirectly affects the microbiota and therefore the biodegradation of polymeric materials.
As mentioned earlier, respirometry is a method for determin-ing the amount of carbon released in the form of CO2in response
to the action of the soil microbial community.33Figure 2 shows
the percentage of biodegradation of each sample based on the quantification of accumulated CO2generated in each
respirom-eter flask during the 180 days of the experiment.
In the present study, the PP/PHBV (80/20) films presented no biodegradation during the period in which they were buried in the soil. The amount of CO2produced in the biometer flasks
containing these films was less than the amount produced by the control biometer (containing only soil). The negative values relating to the amount of CO2produced in biometer flasks
con-taining PP/PHBV films were due to the films’ inhibitory action on microbial activity.34According to Chiellini et al.,35
respiromet-FIGURE 2. Percentage of biodegradation.
ric tests may be affected by the large amount of CO2 produced
in biometric controls, especially when the degradation of the samples is slow. According to these authors, depending on the amount of sample, there is an increase in local concentrations of the material, and also in the products of degradation, which can interfere negatively in the ideal conditions for microbial growth. Therefore, it is possible that due to the large lag phase and the properties of materials to be degraded in the test, the number of microorganisms was not sufficient for biodegradation.36In
addi-tion, the soil microbial community can use the available organic matter in the soil as a cosubstrate in metabolic pathways.37
The biodegradation rate observed for the PE/PHBV (80/20) film was under 7%, twice the rate observed for the neat PE.15
It was noticed that the CO2 evolution rate of PE/PHBV
sam-ples was similar to that of the control respirometer (containing only soil) in up to 60 days, different than the films neat PE that started the CO2evolution in 120 days.15Ho and Pometto38
also reported that the CO2 evolution rate (mg) of PE samples
at temperatures of 28, 40, and 55°C in 182 days coincided with the CO2production rates in respirometers containing only soil.
Corti et al.39found that the amount of CO
2produced in
preoxi-dized PE samples containing pro-oxidant additives was higher than that of the control with nonoxidized films. These authors attributed the much higher respiration rate (CO2production) in
oxidized films to fungi, which are able to use oxidation products as a source of carbon. Feuilloley et al.40 tested the
biodegra-dation of commercial films Mater-BiR (polycaprolactone/starch
[60/40] blend, 50µm thick), EcoflexR (60 mm), and PE
pro-oxidant additive (36 mM). The PE films showed a degradation rate of 10–15% after 1 year of incubation at 28°C.
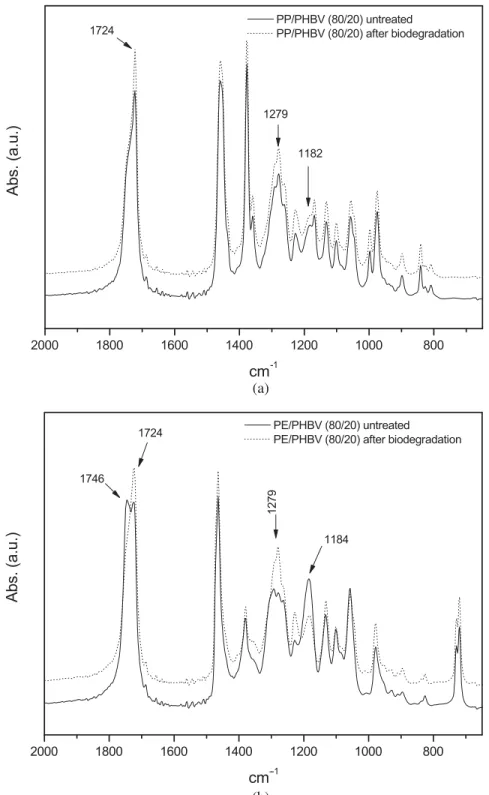
Figure 3 shows FTIR spectra of the untreated and after biodegradation films in respirometric tests. The spectra of the PP/PHBV (Fig. 3a) were normalized using the band at 1456 cm−1, attributed to CH
3 deformation, which is
indepen-dent of crystallinity.41 The spectra of the PE/PHBV (Fig. 3b)
films were normalized in relation to the band at 1465 cm−1(CH 2
deformation).42
After the respirometric test on the blends, several changes were detected in the bands at 1182 (C–O–C amorphous phase), 1228 (C–O–C crystalline-sensitive band), 1279 (C–O–C crystalline-sensitive band),43 1724, and 1746 cm−1 (C=O
crys-talline and amorphous phase). Variations in the FTIR spectrum occurred preferentially in the fraction of PHBV, especially the decrease in intensity of the bands at 1182 cm−1 (44%)
and 1746 cm−1 (approximately 30%). The biotreated films
showed increased intensity of the bands at 1724 cm−1
(crystalline phase) and 1228 and 1279 cm−1
FIGURE 3. FTIR films: (a) PP/PHBV (80/20) (___) untreated ( . . . .) after biodegradation; (b) PE/PHBV (80/20) (___) untreated ( . . . .) after biodegradation.
crystalline phase of PHBV fraction. The PP/PHBV blend pre-sented the same tendency, but lower values.
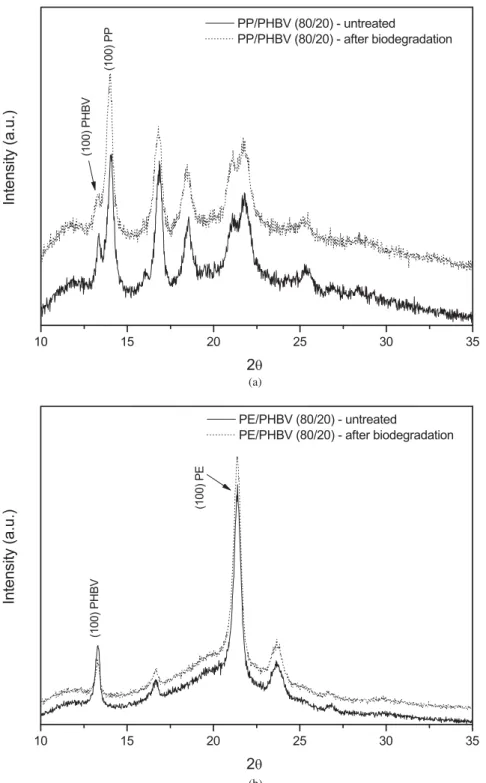
The X-ray diffractograms of the samples before and after the respirometric assay are shown in Fig. 4. Table II lists the average crystallite size (D) assigned to planes (110) of PP, PE, and PHBV, calculated by Scherrer’s equation44and variation in crystallite
size after biodegradation (%D). Changes significant in the de-gree of crystallinity were not observed after the biotreatment; the differences were 55–57% for PP/PHBV (80/20) and 54–52% for PE/PHBV (80/20) blends, respectively.
FIGURE 4. DRX films: (a) PP/PHBV (80/20) (___) untreated ( . . . .) after biodegradation; (b) PE/PHBV (80/20) (___) untreated ( . . . .) after biodegradation.
fraction of the PHBV after the respirometric test. These changes were probably due to the biodegradation of the contents of HV (18% valerate), located at the edges of the PHB crystal core, as described by Yoshie et al.45and closer to the other polymer (PE
or PP). The onset of biodegradation occurred in the fraction of PHBV rather than in the interphase of the blend, as described by Gonc¸alves et al.15,16The biodegradation of the PE/PHBV (80/20)
TABLE II
Crystallite Size (D) and Variation on Crystallite Size after Biodegradation (%D)
D(nm)
Sample 2θ hkl Untreated After Biodegradation %D
PP/PHBV 13.3 (110) PHBV 3.79 4.02 ↑6.0
14.0 (110) PP 3.53 3.19 ↓10.0
PE/PHBV 13.3 (110) PHBV 4.40 5.43 ↑23.0
21.4 (110) PE 3.18 3.03 ↓5.0
↑, increase crystallite size after biodegradation;↓, decrease crystallite size after biodegradation.
polymeric composites oxo-biodegradable PE and lignin (PE/lignin) studied by Samal et al.11showed morphological
in-compatible characteristics attributed to the heterogeneous dis-persion of the lignin phase in PE and the poor interfacial adhe-sion with the PE matrix.11 According to Rosa et al.,46 blends
of PHB/LDPE at different proportions were immiscible and showed phase separation. The polymeric spheres in the blend containing 25% LDPE were larger, whereas the blend containing 50% LDPE had higher polymer dispersion and smaller spheres. There was poor interfacial adhesion between PHB and LDPE, and the spheres of LDPE were not retained in the PHB matrix.45
The same results have been observed by Burlein and Rocha47in
LDPE/PHB blends. These results were attributed to the immis-cibility of polymers and the weak interfacial adhesion between the two polymers. Significant differences in morphology of the LDPE/PHB blends were observed as the PHB concentration was increased.47
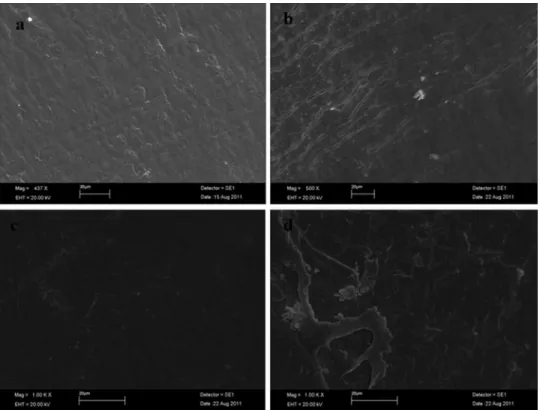
The SEM micrographs (Fig. 5) illustrate the morphological changes in the materials, resulting from microbial attack on polymer surfaces. After 180 days of biodegradation, the mor-phology changed significantly in the PP/PHBV and PE/PHBV films. This result, associated with the changes shown by FTIR and XRD, suggests that microbial attack changed the properties of the polymer matrix.
The biodegradation of blends is a process that depends on the phase distribution and compatibilization between the poly-mers. The use of the biodegradable fraction polymer and inter-phase by microorganisms causes changes in the polymeric ma-trix. The same behavior was reported by Masood et al.,17 who
observed a crystallinity increase in the PP/PHBV (90/10) blend subjected to microbial consortium in controlled biological and soil environments. According to these authors, the beginning of the degradation occurred in the PHBV content of the blend due to surface erosion caused by the microorganism, which is
gradually propagated to the inside of blend, affecting its chemical structure.17
It is important to consider the structural and chemical param-eters of each polymeric material used, such as its hydrophobicity, degree of crystallinity (crystal size), and morphology, which in-fluence microbial activity.5,48–50However, in the blends, a main
factor that influence the biodegradation process is the compat-ibility between the phases of the polymer fractions involved. That is, a higher phase separation makes the material more susceptible to microbial attack.
Conclusions
The films were biodegraded in the following order: PE/PHBV (80/20) > PP/PHBV (80/20). The rate of biodegradation of PE/PHBV was doubled and the beginning occurred in half the time than the neat PE film. The morphology (phase separation) in the blend is a relevant factor to support the biodegradation pro-cess. The bacterial population in the soil containing PP/PHBV and PE/PHBV decreased. However, the fungal population increased after 180 days of biodegradation.
The respirometry test is an efficient method to assess the biodegradability of polymeric films. It is a method that, associated with FTIR and XRD, assists in the understanding of biodegradation in the soil.
References
1. Gu, J.-D. Int Biodeterior Biodegrad 2003, 52, 69.
2. Madigan, M. T.; Martinko, J. M.; Parker, J. (Eds.). 10th ed.; Brock biology of microorganisms Pearson: S˜ao Paulo, Brazil, 2004.
3. Briassoulis, D.; Dejean, C. J Polym Environ 2010, 18, 384. 4. Briassoulis, D.; Dejean, C.; Picuno, P. J Polym Environ 2010, 18, 364. 5. Eubeler, J. P.; Bernhard, M.; Zok, S.; Knepper, T. P. Trends Anal Chem 2009, 28,
1057.
6. Gu, J-G.; Gu, J.-D. J Polym Environ 2005, 13, 65.
7. Krzan, A.; Hemjinda, S.; Miertus, S.; Corti, A.; Chiellini, E. Polym Degrad Stab 2006, 91, 2819.
8. Bastioli, C. (Ed.). Handbook of Biodegradable Polymers, 1st ed; Rapra Tech-nology: Shawbury UK, 2005.
9. Lopes, A. R.; Faria, C.; Prieto-Fern´andez, A.; Trasar-Cepeda, C.; Manaia, C. M.; Nunes, O. C. Soil Biol Biochem 2011, 43, 115.
10. Arutchelvi, J.; Sudhakar, M.; Arkatkar, A.; Doble, M.; Bhaduri, S.; Uppara, P. V. Indian J Biotechnol 2008, 7, 9.
11. Samal, S. K.; Fernandes, E. G.; Corti, A.; Chiellini, E. J Polym Environ 2014, 22, 58.
12. Laycock, B.; Halley, P.; Pratt, S.; Werker, A.; Lant, P. Prog Polym Sci 2013, 38, 536.
13. Kabe, T.; Sato, T.; Kasuya, K.; Hikima, T.; Takata, M.; Iwata, T. Polymer 2014, 55, 271.
14. Zembouai, I.; Kaci, M.; Bruzaud, S.; Benhamida, A.; Corre, Y. M.; Grohens, Y. Polym Test 2013, 32, 842.
15. Gonc¸alves, S. P. C.; Martins-Franchetti, S. M. Int J Mat Sci 2013, 2, 54 16. Gonc¸alves, S. P. C.; Martins-Franchetti, S. M.; Chinaglia, D. L. J Polym Environ
2009, 17, 280.
17. Masood, F.; Yasin, T.; Hameed, A. Int Biodeterior Biodegrad 2014, 87, 1. 18. G ´omez, E. F.; Michel, F. C. Jr. Polym Degrad Stab 2013, 12, 2583.
19. Ammala, A.; Bateman, S.; Dean, K.; Petinakis, E.; Sangwan, P.; Wong, S.; Yuan, Q.; Yu, L.; Patrick, C.; Leong, K. H. Prog Polym Sci 2011, 36, 1015.
20. Saad, G. R.; Seliger, H. Polym Degrad Stab 2004, 83, 101. 21. Weng, Y. X.; Wang, X. L.; Wang, Y. Z. Polym Test 2011; 30, 372–380.
22. Centro de Pesquisas Meteorol ´ogicas e Clim´aticas Aplicadas `a Agricultura—CEPAGRI. Available at: http://www.cpa.unicamp.br/outras-informacoes/clima_muni_494.html. Accessed June 1, 2013.
23. Empresa Brasileira de Pesquisa Agropecu´aria (EMBRAPA). Manual de m´etodos de an´alise do solo; SNLCS: Rio de Janeiro, Brazil, 1997.
24. Pereira, M. G.; Valladares, G. S.; Anjos, L. H. C.; Benites, V. M.; Esp´ındula, A. Jr.; Ebeling, A. G. Sci Agric 2006, 63, 187.
25. Jahnel, M. C.; Cardoso, E. J. B. N.; Dias, C. T. S. Rev Bras Cienc Solo 1999, 23, 553.
26. Bartha, R.; Pramer, D. J Soil Sci 1965, 100, 68.
27. International Organization for Standardization. ISO 14855-2. 2009.Interna-tional Organization for Standardization: Geneva, Switzerland.
28. Kang, H.; Kang, S.; Lee, D. Ecol Res 2009, 25, 1137.
29. Paul, E. A. (Ed.): 3th ed.; Soil microbiology, ecology, and biochemistry Elsevier: Oxford, UK, 2007.
30. Rychter, P.; Biczak, R.; Herman, B.; Smylla, A.; Kurcok, P. Adamus, G.; Kowal-czuk, M. Biomacromolecules 2006, 7, 3125.
31. Weng, Y.-X.; Wang, L.; Zhang, M.; Wang, X. L.; Wang, Y. Z. Polym Test 2013, 32, 60.
32. C´esar, M. E. F.; Mariani, P. D. S. C.; Innocentini-Mei, L. H.; Cardoso, E. J. B. N. Microbiota do Solo e Qualidade Ambiental Polym Test 2009, 28, 680. 33. Silveira, A. P. D.; Freitas, S. S. (Eds.). IAC: Campinas, Brazil, 2007.
34. Campos, A.; Marconato, J. C.; Martins-Franchetti, S. M. Polim Cienc Tecnol 2010, 20, 295.
35. Chiellini, E.; Corti, A.; Swift, G. Polym Degrad Stab 2003, 81, 341. 36. Reuschenbach, P.; Pagga, U.; Strotmann, U. Water Res 2003, 37, 1571. 37. van der Zee, M.; Stoutjesdijk, J. H.; Feil, H.; Feijen, J. Chemosphere 1998, 36,
461.
38. Ho, K. L. G.; Pometto, A. L. J Environ Polym Degrad 1999, 7, 101.
39. Corti, A.; Muniyasamy, S.; Vitali, M.; Imam, S. H.; Chiellini, E. Polym Degrad Stab 2010, 95, 1106.
40. Feuilloley, P.; C´esar, G.; Benguigui, L.; Grohens, Y.; Pillin, I.; Bewa, H.; Lefaux, S.; Jamal, M. J Polym Environ 2005, 13, 349.
41. Arkatkar, A.; Juwarkar, A. A.; Bhaduri, S.; Uppara, P. V.; Doble, M. Int Biode-terior Biodegrad 2010, 64, 530.
42. Sudhakar, M.; Doble, M.; Murthy, P. S.; Venkatesan, R. Int Biodeterior Biode-grad 2008, 61, 203.
43. Reis, K. C.; Pereira, J.; Smith, A. C.; Carvalho, C. W. P.; Wellner, N.; Yakimets, I. J Food Eng 2008, 89, 361.
44. Munaro, M.; Akcelrud, L. Polym Degrad Stab 2008, 93, 43. 45. Yoshie, N.; Saito, M.; Inoue, Y. Macromolecules 2001, 34, 8953.
46. Rosa, D. S.; Gaboardi, F.; Guedes, C. G. F.; Calil, M. R. J Mater Sci 2007, 42, 8093.
47. Burlein, G. A. D.; Rocha, M. C. G. Mat Res 2014, 17, 203.
48. Eldsater, C.; Erlandsson, B.; Renstad, R.; Albertsson, A. C.; Karlsson, S. Polymer 2000, 41, 1297.