RIO DE JANEIRO 2016
FUNDAÇÃO GETULIO VARGAS
ESCOLA BRASILEIRA DE ADMINISTRAÇÃO PÚBLICA E DE EMPRESAS MESTRADO EM ADMINISTRAÇÃO
In the heat of the moment:
convergent behavior of rankings under simulated annealing
Ficha catalográfica elaborada pela Biblioteca Mario Henrique Simonsen/FGV
Oliveira, Beatriz Abreu Foss de
In the heat of the moment: convergent behavior of rankings under simulated annealing / Beatriz Abreu Foss de Oliveira. – 2016.
53 f.
Dissertação (mestrado) - Escola Brasileira de Administração Pública e de Empresas, Centro de Formação Acadêmica e Pesquisa.
Orientador: Alexandre Linhares. Inclui bibliografia.
1. Processo decisório. 2. Comportamento humano. 3. Ranking. 4. Simulated annealing (Matemática). I. Linhares, Alexandre. II. Escola Brasileira de Administração Pública e de Empresas. Centro de Formação Acadêmica e Pesquisa. III. Título.
RIO DE JANEIRO 2016
BEATRIZ ABREU FOSS DE OLIVEIRA
In the heat of the moment:
convergent behavior of rankings under simulated annealing
ACKOWLEDGEMENTS
To my advisor, Alexandre Linhares, for supporting me not only in the dissertation process, but also
in my life.
To Celene Melo and Kaillen Givigi, for always helping me and being so kind.
To my friends Andréia Sodré, André Luiz Anselmo, Fernanda Concatto and Marcelo Salhab, for the
time they took in helping me with my dissertation and making me smile.
To all my friends from the Master course, with whom I shared difficult and joyful moments.
ABSTRACT
Rankings are a recent tool being used in several fields, including in management. Their pervasive
use is associated to the fields of behavior and decision making. Despite their constant use, few research
have tried to define the concept of ranking and the parameters to judge whether it is acceptable. In the
absence of a more precise understanding of what the term ranking means, its power is diminished as
well as its purpose. Thus, in this work I present the characteristics, advantages and disadvantages of
rankings. Further, I analyze patterns of behavior elicited in real rankings. To this end, I propose the use
of simulated annealing to study the quality of convergence of a ranking’s chosen dimensions. The
graphical analyses suggest, at least, two different patterns of convergence for rankings. The categories
were named well behaved and poorly behaved rankings.
DEFINITIONS
In order to facilitate the reading, there are some definitions that ought to be taken into consideration.
They are:
Convergence: Is the process of getting close to, and finding, a solution.
Delta (Δ): The finite difference between two functions.
Dimensions: Refers to a broader term, intangible aspect. It summarizes and can be break into
tangible aspects (indicators) that can be measured.
Entities: It is dependent on the subject of the ranking. For example, in a Chess Ranking, the entities
can be players. So entities are a general form of expressing the subject under analysis (e.g., players,
universities, countries).
Local minima: It is a point in space that has the lowest value, within a subset (i.e., neighborhood;
region) of the whole set of possible solutions.
TABLE OF FIGURES
Figure 1: Simulated Annealing applied to a ranking created through uniform distribution ... 25
Figure 2: Simulated Annealing applied to ranking created based on a normal distribution ... 27
Figure 3: Simulated Annealing applied to World Chess Federation Ranking ... 29
Figure 4: Simulated Annealing applied to World Bank Logistics Performance Index ... 30
Figure 5: Simulated Annealing applied to Human Development Index of 2013 ... 31
Figure 6: Simulated Annealing applied to Financial Times Rankings of 2013 ... 33
Figure 7: Simulated Annealing applied to Failed States Index ... 34
Figure 8: Simulated Annealing applied to Global Peace Index ... 35
Figure 9: Simulated Annealing applied to Global Innovation Index of 2013 ... 36
Figure 10: Simulated Annealing applied to Doing Business Ranking of 2013... 37
SUMMARY
1. INTRODUCTION: PEEKING REALITY ... 8
2. LITERATURE REVIEW ... 10
2.1 Theoretical Background ... 10
2.2 Gaming ... 13
2.3 Importance of studying rankings ... 14
2.4 The way rankings change the world around them ... 15
2.5 The hidden problems ... 17
3. METHODOLOGY ... 19
3.1 Simulated Annealing ... 19
3.2 Configuration & parameters of simulated annealing for the analysis of rankings ... 21
3.3 Data Collection ... 23
4. RESULTS... 24
4.1 Idealized rankings ... 24
4.1.1 Synthetic Ranking #1: Uniform Distribution ... 24
4.1.2 Synthetic Ranking #2: Binomial/Normal Distribution ... 26
4.2 Real Rankings: “well-behaved” cases ... 28
4.2.1 Case 1: ... 28
4.2.2 Case 2: ... 30
4.2.3 Case 3: ... 31
4.3 Real Rankings: transition to “poorly-behaved” cases ... 32
4.3.1 Case 1: ... 32
4.3.2 Case 2: ... 34
4.3.3 Case 3: ... 35
4.3.4 Case 4: ... 36
4.3.5 Case 5: ... 37
4.3.6 Case 6: ... 38
5. DISCUSSION ... 40
5.1 Limitations ... 41
5.2 Future Research ... 41
REFERENCES ... 43
APPENDIX ... 47
1. INTRODUCTION: PEEKING REALITY
Mr. Richard Zavala, the director of parks and community services of Fort Worth, Texas, is
preoccupied with his position on the annual ParkScore ranking from The Trust for Public Land. He
does feel that it's somehow an inadequate measure, though: “Once again, those cities that have a higher
density of population have a tendency of scoring higher, simply because their population is more
compact, versus the city of Fort Worth that is more dispersed and spread over 350 square-miles” (Hirst,
2015).
Ben Harder, chief of health analysis for U.S. News & World Report, affirms that even for a routine
surgery the choice of the hospital is a life-changing experience, and rankings permit that the patients,
along with their doctors, research for the hospitals best suited for their necessity. Novant Health Inc, a
healthcare provider, also stated that rankings are helpful to guide patients in their healthcare decisions
(Craver, 2015).
Juniper Research created the top tech leadership ranking by assessing “vision, innovation and
personal capital” of leaders. In this ranking the first position goes to Nadella, the guy who created “Windows-as-a-service”, the second position was taken by Jony Ive who created Apple’s smart watch and in the eighth position, which seems ironical, there is Elon Musk, Tesla CEO, which has endeavored
in problems such as energy-efficient cars as well as space travel (Darrow, 2015).
Andrew Chamberlain, Glassdoor’s chief economist, discusses about his company’s new ranking
report about best city for jobs. He informs that according to the statistics, some cities, like Boston and
other metropolis, are being penalized by house pricing and suggest that if the mayors and officials
aspire for a better score in this ranking, they should address housing availability and high costs
(Salomon, 2015).
From recreational space to healthcare, the bottom line present in these excerpts is that rankings are
ubiquitous, even in unconventional topics. Some, as Juniper Research top tech leadership ranking,
prompt us to think what are the prerequisites someone has to have in mind to create a ranking. More
than that, raise questions about what are the goals being pursued by each ranking, providing evidence
Over the last four decades, rankings have become a pervasive tool (Rauhvargers, 2013). There is a
wide range of scope for their use, as we may see them being used for products, services, and even
nations. From the most read book, to the list of the most cited researchers in a field of study, rankings
are omnipresent.
The average person may feel secure to consume rankings made and/or provided by third-party
organizations. However, this may not be the most prudent decision since, as pointed by researchers in
fields of organizational behavior (Espeland & Sauder, 2007; M. Sauder & Espeland, 2009), education
(Altbach, 2012; Hazelkorn, 2011; Rauhvargers, 2013), accounting (Brown, Fisher, Sooy, & Sprinkle,
2014), and culture (Lynch, 2013), rankings have both advantages and disadvantages that ought to be
taken into consideration.
In the present work, I try to unify the discoveries about rankings across the mentioned fields. This
type of study is needed due to the fact that rankings lack a common way of analyzing their
construction, and, as any other public social measure, rankings should be validated or, at a minimum,
have basic characteristics defined. In order to create a parallel between the ideas existing in the field
and the reality involving rankings, I propose the use of simulated annealing as a path to understand how
rankings behave1, by analyzing their convergence through graphs.
In order to accomplish this goal, I have first presented some examples of media information about
the usage of rankings. Next I present the origin of rankings and identify not only their basic
characteristics but also the most common advantages and disadvantages associated with their use. I
then proceed to analyze the importance of studying rankings and highlight the problems derived from
using them. Further, I introduce the simulated annealing technique to analyze how different types of
rankings converge in search of their optimal solution. Finally, I conclude by creating a connection
between decision making and rankings.
1
2. LITERATURE REVIEW
2.1 Theoretical Background
The first rankings were not intended for consumer appraisal; they were considered strategic
information for professional use only. However, due to media in the late 80’s, they started being
publicized and, as the organizations that provided them started to observe the amount of revenues
coming from publicizing it, rankings became a business (Espeland & Sauder, 2007; Lynch, 2013). In
her study, Lynch (2013) affirms that rankings determined a new pattern of trade and are consequence
of new managerialism.
According to Sauder and Espeland (2009), U.S. News & World Report started ranking colleges in
1983 and only in 1990 included annual rankings not only for colleges but also of graduate programs
and professional schools. Espeland and Sauder (2007) called this obsession over rankings the “audit
culture”, with the excessive focus being on evaluation.
Altback (2012) and Hazelkorn (2011), point out that the same ranking is used by different kinds of
users; they give the example of higher education, in which the rankings are used not only by students
but also by the whole high education system and government. The authors cite the ranking as a way or
comparing different institutions, in the absence of other benchmark strategies. Another example would
be the case of criminality in cities; it has its uses for those that plan to travel or to move, but also to
police forces and politicians, in order to create a plan on how to reduce violence. On the other hand,
this is a questionable usage of rankings since not all institutions under comparison are focusing in the
same goal, thus, the information is not adapted for every use (Vught, Westerheijden, & Ziegele, 2012).
The basic characteristic of rankings that can easily be observable by anyone is that they are ordinal
and hierarchical. Due to its attachment to a numerical ordering, the dimensions taken into account have
to be measurable. Even when names (e.g. countries) are ranked, there are numerical data related to the
positioning of each entity. They are in a continuous scale from 1 to x, in which x being elected by the
ranking creator (Federkeil, Vught, & Westerheijden, 2012a). The positioning of an entity depends both
on its own score and likewise the rest of the rank system, being considered a collective measure
(Caldarelli, 2012). In consequence, Blumm et al. (2012) affirm that for an item to maintain a stable
rank, the expectation that it fluctuates around a well-defined mean is a necessary but not sufficient
These characteristics allow rankings to have some advantages, such as objectivity and concision,
which facilitates the assimilation of information by decision makers, as well as its easy accessibility
(Isaac & Schindler, 2014). Additionally, these advantages empower rankings to have benchmark
capacity. This happens because entities can more readily compare themselves in given attributes to
other entities (Lynch, 2013; Rauhvargers, 2013; Vught & Westerheijden, 2012), such as nations
comparing their economic growth and looking for the reasons why other country could score higher.
Lynch (2013) highlights its importance in the governance field, since it enables auditing and
surveillance, which are needed for regulation and control. In sum, it is a tool that allows the generation
of credibility (Vieira & Lima, 2015), which is reinforced when the ranking is publicly available.
Despite being in favor or not of rankings, researchers point some disadvantages, or problems, that
harm rankings. They may be seen as the other side of the coin of rankings advantages. Federkeil,
Vught, & Westerheijden (2012) emphasize that the advantages and disadvantages occur because of the
trade-off between the manageable and the oversimplifying:
It is a presumable zero-sum game: when an entity moves up, another will have to move down,
there is no room for ties (Altbach, 2012; Lynch, 2013). This disadvantage is consequence of the
characteristic of rankings, the hierarchy condition does not allow two bodies to occupy the same space.
Some dimensions might not be taken into consideration: considering that the objective of
rankings is to reduce complexity, in this process important information might be set aside (Federkeil,
Vught, Westerheijden, 2012). For example, studies of the educational field constantly address the
problem of teaching versus research, where teaching can be disregarded in benefit of the research
dimension (Altbach, 2012; Hazelkorn, 2011). This leads to another problem:
Not all important dimensions can be easily measured: teaching, for instance, has an important
facet linked to quality. But, how to give a number to such quality? Usually this can lead to biases (e.g.
social desirability) since it has to be made measurable in some way, this is often achieved through
surveys (Altbach, 2012). Butler (2010), for example, points that the Times Higher Education rankings
rely heavily on reputational surveys. Ergo, it is questionable the extent that the gathered data can be
replicated, due to its subjective nature.
Rigor in collecting the data: even if the dimensions can be measured, a ranking can be flawed if
the data collected as input was badly measured. This can be done by mistake or even on purpose to
No entity is responsible for auditing rankings and fixate the weighs: as Vugh, Westerheijden,
Ziegele (2012, p.3) point “there are no officially recognized bodies that are accepted as having the
authority to define the rules of the game, nor is there an explicit understanding that different conceptual
frameworks (hence different indicators) define different competitions and hence validly different but
incomparable rankings”. The absence of the authority figure to evaluate if the rankings can be
comparable gave surge to innumerable different frameworks and rankings that supposedly answer the
same question when they, in fact have different purposes.
Weights for each dimension usually do not present a clear rationale: the ranking creator
assumes a weighting that seems valid, although not all rankings explain how they have chosen the
weights neither what these weights are (Altbach, 2012). Even explaining the choice of different
weights, another issue is to explain the chosen magnitude since it impacts the overall ranking.
Federkeil, Vught, Westerheijden’s (2012, p.43, emphasis by the author) criticism about rankings relies on this point, under the argument that “composite indicator with fixed weights inevitably means patronizing users of rankings by deciding about the importance and relevance of different indicators”.
This too leads to the problem of:
Replicability and validation: as any other measure, rankings have to be liable of replication.
Although this is not a problem found in all rankings, basic research on the term provides evidence that
most third parties’ rankings do not specify the weights and how the ranking was calculated, nor report
methodology, such as: dimensions and indicators choice explanation, aggregation method,
normalization of different metrics (Meijering, Kern, & Tobi, 2014; Rauhvargers, 2013; Vugh,
Westerheijden, Ziegele, 2012).2 This precludes possibilities of replication, since the results depend on
the weights utilized. Consequently, this lack of transparency harms validation once there is no access to
part of the data. Hood, Dixon and Beeston (2008) also reported that in cases they analyzed some
indicators, although present in the information about the ranking, were excluded before the aggregation
without a notice and explanation.
Change in criteria and methodology: evolution is important in any field, but this may create
inconsistencies in comparisons over periods of time (Altbach, 2012; Lynch, 2013). For instance, in the
2
Examples:100 Best Companies to Work for: Visit website: http://fortune.com/best-companies/
educational field it is common that institutions compare themselves over time. However, if
methodologies and criteria change, the comparison no longer makes sense, since there are two different
things being compared. A case that resembles this is presented by Chapman (2008), in which the
Southern Methodist University jumped from the 67th to the13th position while being aware that they
were not meant to be classified that way, which suggested a flaw in the methodology used. Also, Butler
(2010) reported that many universities swing in rankings from year to year, which cannot reflect real
changes in quality.
Further, authors such as Rauhvargers (2013) and Espeland and Sauder (2007), support the idea that
rankings should inform, guide, but never drive decisions. Indeed, rankings are subject to the purpose of
their creation and to who created them. The neutrality of numbers is an illusion. Lynch (2013, p.141)
reinforces this idea when affirming that rankings can deflect attention from their political and moral
purposes. However, as pointed by Vught and Zigele (2012, p.14) “readers need not see a ranking as
inherently bad, although bad ones do exist”. The notion that rankings usually drive decisions and
change behavioral patterns is where the importance to study rankings resides.
The consequences of the existence of rankings are reallocation of resources to improve conditions in
rankings, which can be called “gaming”, as well as other decisions related to the positioning in ranking
(Isaac & Schindler, 2014). In addition, they are perceived to strongly impact management (Vught,
Westerheijden, 2012).There is also evidence that different types of rankings elicit different patterns of
behavior, which is the case of the study of Brown and his colleagues (2014) about honesty in budgeting
reporting.
2.2 Gaming
Authors like Hazelkorn (2011) and Lynch (2013), reinforce the idea that in the struggle to be in a
good position in rankings and gain the rewards a good status offer, many entities opt to use the
indicators as their main guide to change themselves. In other words, they do the inverse thinking by
exploring indicators and forcing themselves to have better scores and, in consequence, better positions.
This may also be called reversed engineering as shown in the interviews made my Espeland and Sauder
(2007).
This behavior can, of course, be associated to better performance and be highly related to the core
facilitating this kind of behaviors and not being able to police up the entities, rankings fail to be a
reliable tool. For Espeland and Sauder (2007) this behavior is an illegitimate move to manipulate rules
and numbers, unconnected to and prone to undermine the motivation behind the rankings.
Apparently, the gaming strategy works best for entities in the cusp, so they can benefit of the top-ten
effect, a bias well described in the study of Isaac and Schindler (2014). The top-ten effect works
through a mechanism in which individuals create smaller sets of categories, differently from the idea
that rankings elicit equidistance between adjacent ranks, which was expected not only from Isaac and
Schindler (2014), but also in other studies such as Vught, Westerheijden (2012). Consequently, the
entities in the cusp may more easily change categories depending on the ranking positioning obtained
by engaging in gaming strategies, which can lead to benefits to their status. The bias works in both
ascending and descending rankings. It is important to notice that the occurrence of this bias is not due
to the ranking itself, but because of human way of thinking and handling information.
Rankings, in sum, have the power to provoke the industry to adapt to what it is measuring. However,
as pointed earlier, the disadvantages of rankings could be enough evidence that it should not dictate
what is important or not in an industry, at least not prior of being a reliable tool.
2.3 Importance of studying rankings
Sauder and Espeland (2009), point that the influence of rankings is permeating many institutional
environments as a form of disciplinary power, public assessment and accountability. As being
considered a public measure of performance, understanding how rankings behave is crucial to better
understand how organizations can possibly respond to them. Further, most institutions confront
pressure to formalize accountability mainly through quantitative measures.
Also, in accordance to Hood and colleagues (2008, p. 300), in the realm of politics and public
management rankings serve as evidence of performance in order to claim credit. Similarly, social
comparison theory can reinforce the idea of rankings as causing a change in the companies’ (and so in
individuals) mindset to strive in the measured dimensions (Garcia, Tor, & Gonzalez, 2006). An
evidence of the importance in studying rankings is presented by Elsbach and Kramer (1996, p. 474),
who affirm that bottom-tier entities in Business Week, for example, have their legitimacy and existence
universities in the bottom or outside the list? If people consider affiliations as part of the self, as said by
Escalas and Bettman (2005), this would be unconventional.
Rankings also elicit peer pressure to the extent to which an administrator might not be willing to
take this measure seriously for considering it poor, but can be compelled by peers to be part of the
rankings subordination circle; taking rankings as a key point in decision making. Furthermore, “despite
educators’ objections, rankings have become naturalized, shaping the cognition and activities of even their harshest critics” (Sauder & Espeland, 2009, p.68). This behavior happens mainly because a drop
in a rank cannot be afforded as it may signify a drop in revenues, donations or even layoff. It is a trade-
off that most people prefer not to face.
Although the previous points are related to business environment, rankings usage are also present in
daily decisions that affect people's lives such as where to study, where to work, which products are best
valued and so on. For instance, Pope (2009) show that changes in a hospital rank significantly attracts
more patients.
Studying rankings help to understand how they are employed in decision making, but it is also
important to study the tool itself to investigate the flaws it can create in the decision making. In sum,
the study of the tool is important because it impacts how people decide.
2.4 The way rankings change the world around them
Rankings pose a threat to the objects they are trying to measure. This is evident in the study of
Elsbach and Kramer (1996), in which the perception of the value of a university was modified
according to its positioning in the ranking. The authors claimed that the ranking created an identity
dissonance by altering the cognitive schema and perception of a person.
Sauder and Espeland (2009), grounded in Focault’s conception of discipline, suggest that rankings
have changed perceptions in education through coercive and seductive means. Moreover, rankings have
changed how actors make decisions and behave around them. The main point of their study, though,
was that rankings would prompt schools to buffer their activities, which did not happen; they actually
conformed through process of surveillance and normalization, internalizing the information given by
rankings.
In a previous study Sauder (2006), and independently Vieira and Lima (2015), supported that
which signals good quality, render more revenues and/or lower costs. The recognition and recall of an
entity is easier, mainly because the advantage of rankings ease of accessibility. This fact facilitates the
marketing of the entity, exactly because rankings boost marketing efforts. The larger amount of
revenues and lower costs of the entity are a response to this.
Espeland and Sauder (2007) present self-fulfilling prophecy and commensuration as the mechanisms
that enact the reactivity in people. In fact, the authors point the main benefits of rankings to be their
ease of accessibility of information, to the general public and also as feedback to policies, which is also
evident in the literature about availability as heuristic of Kahneman & Tversky (1973). This easiness
motivates competition of organizations, pushing them to improve. The turning point that makes
rankings harmful is when discretion is lost as well as when actors focus on indicators rather than on the
quality and context of what is being measured. In other words, rankings have flaws, but so does human
cognition, as we choose on how to handle the tools we have. It is mainly the interpretation given to the
tool that conceives the worst outcomes. It changes how people comprehend situations, “rankings offer a
generalized account for interpreting behavior and justifying decisions” (Espeland & Sauder, 2007, p.
10-11). In sum, the ranking numbers are decontextualized and depersonalized.
In accordance to this idea, Vieira and Lima (2015, p.70) suggest in their article that depending on
the context in which the ranking is inserted, the answer a person will get may be altered or even not
addressed. Rankings usually do not disclose they might present this kind of problems. In fact, it can be
more related to the lack of attention from systems one and two of a person (Kahneman, 2011). For
example, a ranking of Higher Education Institutions (HEIs) focus its basic indicators using research,
but the student may want to know which school has the best teaching quality, thus, the answer will not
be accurate for the specific use this person needs if they are not the target group.
Similar results in behavior change were also found by Brown et al. (2014). In an experiment, they
examined honesty in managers’ budget report when in presence of a firmlevel ranking, versus in
presence of an internal ranking of individual performance. The brightside is that the firmlevel ranking
may curb self-interest. On the other hand, the use of individual level ranking can lead to harmful
behavior to the organization, as the results show managers’ tendency to be less honest in their budget
report. According to the authors this happens because humans have an upward drive motivation, and
Finally, in the consumer decision domain, the study of Pope (2009) concludes that hospital rankings
have a significant impact on consumers perceived hospital quality, and thus their decisions about
healthcare.
2.5 The hidden problems
The problem for rankings consumers is that a bad positioning in rankings not necessarily means that
the entity has poor quality. It is a comparison with others, the whole system, which will be seen in the
analyses with simulated annealing. The gap between the entities can be seen as artificial lines
(Espeland & Sauder, 2007), exactly because entities are way more complex than numbers can capture
through digits.
From the previous problem, another can be inferred: differences are suppressed and not seen as
beneficial. In schools, for example, this case is explicit: how can schools for people with special needs,
such as the ones for blind and visually impaired people, be compared to schools where kids do not need
the same methodology and materials? Their core activities might be similar, but the way in which they
are processed is not. Ergo, the output should not be expected to be the same, for instance, grades in one
school may not mean the same in the other. Information needs to be taken in the context, not apart from
it.
As rankings permeate through different ways (e.g. media vehicles, colleagues), they can end up
being in individuals’ mind, creating anxiety and insecurity, given the limited ability of a person to
control the outputs (M. Sauder & Espeland, 2009). They can reproduce and intensify the hierarchy they
are supposed to measure (Espeland & Sauder, 2007). The initial good purpose of the use of rankings
may be backfiring in these occasions: simplification can actually lead to poorer decisions.
A fourth problem is that their apparent objectivity and concision mask the actual messiness of their
production as suggested by Sauder and Espeland (2009, p.72). “March and Simon (1958) show how
processes of simplification obscure the discretion, assumptions, and arbitrariness that infuse
information, as well as absorb uncertainty and contingency” (Espeland & Sauder, 2007, p. 17). As said previously, the illusion of the neutrality of numbers gain space when the original context is far less
charming as it is complex. A unique number is much more appealing and presents itself as much more
In summary, “the unintended consequences of rankings can be deleterious” (Espeland & Sauder,
2007, p. 32). Using the simulated annealing technique I am going to analyze the masked messiness that
is hidden in the numbers, offering the opportunity to understand the caution consumers need to take
3. METHODOLOGY
In this section I present the definition of simulated annealing and the graphs resulting from the
simulation using the open source language Python, and the data collection process.
3.1 Simulated Annealing
According to the Cambridge Online Dictionary3, to anneal is to make metal or glass soft by heating
and then cooling it slowly. The annealing process comes from metallurgy, where the objective is to
obtain a homogeneous product. In metallurgy, the faster the cooling rate, the higher the chance the
product has to have more internal energy, i.e., being less stable. On the other hand, slower cooling rates
produce more stable products, since its particles have settled in a state with less energy. The simulated
annealing was first implemented in both the combinatorial optimization and the statistical mechanics
field by Kirkpatrick, Gelatt, & Vecchi (1983).
It is a metaheuristic approach with no guarantees to global convergence, yet, it produces excellent
results, concentrating the search over the most prominent areas, and escaping from several local optima
in search of the global optimal solution instead (Aarts, Korst, & Michiels, 2005; Haeser & Gomes
Ruggiero, 2008; Kirkpatrick et al., 1983). It is widely used as an optimization method, generally in
problems that do not have an efficient algorithm to solve them and that that allow the definition of a
cost function (i.e., have , where is a finite space of possible states, and f is the cost, or
energy, function). The algorithm is said by Bertsimas and Tsitsiklis (1993) to produce good optimized
solutions even if the structure of the problem is complex.
The process occurs in steps. Each step considers a new temperature being simulated and, as a point
(i.e., state) is given, its neighboring points are chosen at random and their respective cost function
calculated (Haeser & Gomes Ruggiero, 2008). The simulations analyze the delta (Δ) of these functions
to search for the best result, attempting to avoid local optima. If is the current state and the state
created through the simulation of neighboring points, the acceptance or rejection of the generated point
is determined as follows and is known as the Metropolis criterion (Aarts et al., 2005; Kirkpatrick et al.,
Where:
T: temperature of the step
k: Boltzmann constant, which, for our purposes, can be safely ignored since all entities will use the
same formula.
In summary, this is how the technique manages to escape local minima; all improving changes are
accepted while non-improving changes may be accepted according to the temperature-defined
probability. Given that the probability structure considers the temperature, the acceptance rate
decreases along the process: the greater the temperature, the greater the chance to accept a new state in
relation to the current. In the same manner, the lower the temperature the less likely the change in state
is to occur. Consequently, the simulation has larger changes in the first iterations, resolving the major
disparities first and smaller alterations in the end. This is the main property of the algorithm that we
will be concerned with: how different rankings respond to this convergence regime by first solving the
large-scale issues, and gradually moving towards the small-scale ones.
In order to develop the process there are a few parameters that need to be set to form what Aarts and
colleagues (2005) name as cooling schedule: (1) the initial temperature, (2) the final temperature, (3)
the cooling rate, and (4) the condition to stop the iterations (minimum number of transitions in case of
dynamic schedule). There are two main classes of scheduling types: static or geometric - with fixed
parameters, and dynamic, in which the parameters are adaptive from the execution of the algorithm.
There is a trade-off between the cooling rate and the computational cost. As the simulation technique
proposes, in a sufficiently slow lowering of the temperature, the system can reach equilibrium at each
level of temperature, though this means the algorithm will run for a longer period of time. According to
Bertsimas & Tsitsiklis (1993, p.11) the algorithm converges to an optimal solution when time tends to
I do not intend to use simulated annealing to create rankings; instead, I propose a new use for
simulated annealing: analyze the complexity inherent to rankings, as the algorithm converges over
time. For instance, do all entities converge simultaneously? I propose that the convergence, if highly
non-uniform, is symptom of a "funny ranking" since there were issues with some of the entities that
make them converge on different annealing steps/timescales. (See the Conclusion for what is meant by
"funny ranking").
3.2 Configuration & parameters of simulated annealing for the analysis of rankings
The configuration used in this section was an adaptation of the simulated annealing implementation
of Perry (2016), which algorithm is presented in Annex. The modifications are the following:
● Since my objective here is, rather than optimization, to understand the convergence
process, I needed to include code to save each accepted movement, so that I could measure the
process later on; hence I measured the magnitude of accepted moves for each entity;
● A fixed number of annealing steps. This was desirable so that one may compare and contrast different ranking convergence scenarios;
● The initial temperature chosen by the algorithm is computed on a pre-processing stage, in which all proposed changes are accepted and the particular temperature measured is a lower
bound on the initial annealing temperature; and
● The starting configuration is not the same of the overall ranking obtained from the collection or the generation rankings for this study; entities were arranged as the pre-processing
state configured them (i.e., a random permutation of the entities involved in the ranking). The
desired final configuration is the ranking in the order that minimizes global Euclidean distance
between adjacent points.
The most appropriate parameters are gathered through experimentation, and that is a reason why I
opted to work with a dynamic algorithm. To summarize, following the theory, the cooling schedules
generated present:
(1) Initial temperature: high. This enables free movement across the degrees of freedom,
(2) Final Temperature: low, close to zero. This enables the Metropolis criterion to abstain
from changing a current state that can actually impair the best solution found.
(3) Condition to Stop or Scheduled Steps: I have considered 100 annealing steps for every
analyzed case, in order to offer a way to compare the convergence rate between cases.
(4) Cooling Rate: the cooling rate is also a dynamic choice, since each case has a different
initial temperature. The cooling rate is the Initial Temperature of the case divided by 100, the
number of scheduled steps. The rate was considered the same until the end of the process
without re-heating.
This said, the solution space is the ranking itself and the neighborhood set depend upon the
iterations. The last and most important thing about the simulated annealing is to define the objective
function used to generate the graphs.
As rankings are composed of real numbers, the metric used is in Euclidean Space. Therefore, the
computation of the cost function in each ranking was based on the Euclidean distance, in which the
position of two adjacent entities, say x and y, is calculated by summing their distances on an n-
dimensional space.
In the generation of the dataset, the input data were the full dimensions of the rankings. If a ranking
was composed of three dimensions, then the result was a 3-dimensional space, while if it had only two,
it would be a plane. In accordance to this rationale, the most basic ranking is the one with only one
dimension. One example of this case would be the medalist from a single sport competition, such as
swimming, or, as we will see in the next chapter, chess.
The idea is to choose the next item in the ranking based in the minimization of distances: change
proposals are of the form (x, y), in which item's x position in the ranking is exchanged with y's position.
Diverging from the theory, in the algorithm I used < instead of ≤ for the Metropolis Criterion because,
under my analysis, I do not wish to have two interchangeable entities whose particular ordering in the
ranking is of no consequence. This is why I consider it of no relevance which entity first achieves
convergence. If two entities have equal scores, their ordering in the ranking is irrelevant, as
long as they are adjacent.
In order to illustrate it, consider every two entities, say: f = (a,b,c) and h = (x,y,z). The Euclidean
matrix, and then convergence towards a ranking is gradually formed by annealing over the minimum
distance between all adjacent entities in the ranking. The process is repeated throughout all temperature
steps, until the system reaches a final state, with a best solution found and temperature approximately
zero.
3.3 Data Collection
I first explore the convergence of 1-dimensional rankings with synthetic distributions.
The other nine rankings contained in this study were chosen based on their public availability. I
believe the following rankings provide a small, but diverse enough set for study, for it simultaneously i)
encompasses schools, universities, nations, etc; and ii) are widely held in high regard, or at least
perceived by the general public, as "serious and important" media vehicles. They are: ● The World Chess Federation Ranking
● World Bank Logistics Performance Index ● Human Development Index of 2013
● Financial Times MBA program Rankings of 2013 ● Failed States Index 2010 a 2013
● Global Peace Index 2013 ● Global Innovation Index 2013 ● World Bank Doing Business 2013
● Academic Ranking of World Universities 2012
The datasets used as input to the algorithm were extracted from the official websites of the
mentioned rankings. Each dataset was analyzed individually to create the convergence graph. All
datasets were prepared to contain only the scores of the indicators for each dimension, not the entities
actual positioning in the ranking. For a list of the websites of each ranking as well as their respective
4. RESULTS
The results I will present are separated into three subsections: i) idealized rankings; ii) well-behaved
rankings; and iii) poorly behaved rankings. These names were based in their convergence behavior. I
will first analyze the behavior of idealized, synthetic, rankings, prior of studying real ranking datasets.
4.1 Idealized rankings
The first two graphs that were created used specific synthetic distributions. The purpose of this is to
analyze the characteristics expected from the convergence process of rankings, in its simplest form of a
single dimension and a well-known distribution. Both synthetic distributions were generated through
MsOffice Excel tool.
An ideal ranking should have a uniform distribution. This is because each entity has a clearly
defined position in the ranking. A second synthetic ranking to be analyzed uses the binomial
distribution. Here, all rankings are unidimensional.
4.1.1 Synthetic Ranking #1: Uniform Distribution
Using a uniform distribution to generate a ranking implies that all the possible values a variable4 can
assume, given the sample space, have the same probability. Considering en a given entity, where n is
the number of entities in the set; since I have contemplated 100 entities in this case, the notation of the
distribution is en ~ U{ 1, 100}. Here, entity #1 has value 1, entity #2 has value 2, and so forth, the last
entity has value 100, ranked #100. Nonetheless, the ordering would be inverse (e.g. #1 has value 100
and #100 has value 1) since the Simulated Annealing algorithm considers the minimum distances when
ranking, not discerning between which magnitude of score is more important.
When generating a ranking with a uniform distribution, the temperature seems to “cool” down at a
quite uniform rate, with most entities converging simultaneously, given that each entity in the sample
space will be set in a unique position in each iteration of the simulation. The cooling is the pace of
convergence, and in this case, as expected from the characteristics of rankings, the convergence occurs
at a similar pace. Figure 1 displays a ranking generated by a uniform distribution.
4
Figure 1: Simulated Annealing applied to a ranking created through uniform distribution
How to read this graph:
● At the extreme left, at the Y axis, we have a scale of marks of the entities in the ranking. Starting in 0 with top ranked entities, and, as we move higher in this axis, we are going to
substandard entities.
● At the extreme right the label shows the gradation in the magnitude of movements and the colors representing it. Considering this, in the extreme left, we have the maximum
magnitude of movements and as we move rightwards, we have the gradual decrease in the
magnitude and the convergence of entities to their final position (T ≡ 0).
● At the bottom of the graph, the X axis, there are the scale marks of the annealing schedule steps that mark the number of times the temperature was decreased by the cooling rate. ● Each pixel in the graph displays the cumulative magnitude of moves that an entity has accepted under temperature step T of the annealing schedule. For example, if Germany is the
measure for the bottom-left pixel will read as 100. One can readily see that, as the Temperature
cools down, the magnitude of movements’ decreases accordingly.
As expected, since it is a ranking generated via the uniform distribution, the graph has a smooth
convergence. Entities in the middle converge afterwards because they have more movement options (or
degrees of freedom) than entities at the top (or bottom) of the ranking. For example, exchanging entity
#50 in the ranking to entity #80 is equal, in this case, to exchanging entity #50 with entity #20. But
notice that entity #20 does not have an entity with 30 positions above it, neither does entity #80 have an
entity with 30 positions below it. Because entity #50 has more degrees of freedom, it is natural that it
should have a slower convergence pace.
However being merely an example, since the data was generated and not collected from real world
cases, it serves merely as guidance to what graphs would resemble if the data were perfectly collected
and organized in a linear ordering fashion.
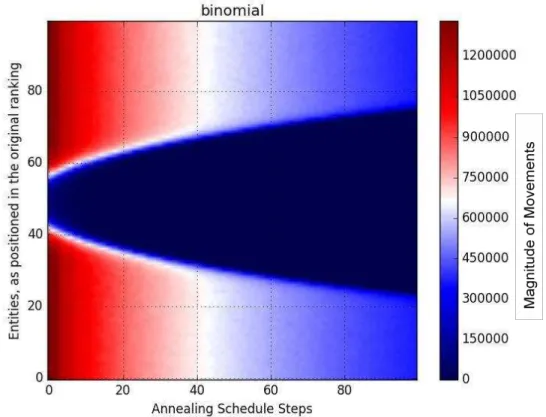
4.1.2 Synthetic Ranking #2: Binomial/Normal Distribution
Since most events in real life do not fit into a uniform distribution, the idea here was to have a better
grasp on convergence in different distributions, such as the normal curve. This would be a transition
between idealized rankings and real rankings, using a binomial distribution with p= 0.5 to generate a
ranking in which a number of entities cluster in its center, which, repeated n-times, converges to a
normal distribution. The normal distribution is more consistent when most of the objects under analysis
are not far from the mean: they concentrate around it and the farther it gets from it, the rarer they
become.
In the case of rankings, the event is the dimension, and the score signals its positioning. Figure 2
displays a ranking generated by a binomial distribution, which rapidly converges to a normal
Figure 2: Simulated Annealing applied to ranking created based on a normal distribution
How to read this graph:
Knowing that the normal distribution will have most entities in the middle and as the function was
based on the Euclidean distance, the first entities to converge are in the middle. This happens because
these adjacent entities are much alike, and the real optimal solution must traverse between them: a
traversal between these entities has a much lower cost than a traversal that switches between them and
a high modulus sigma entity.
The edges of the graph, however, need more iterations since it is difficult to choose which one is
really the best fit for the position. Consider the orders of magnitude involved between the middle
entities and the extreme entities. Item #1 here has, as value, the probability of flipping 100 coins and
getting all heads, a number very close to zero. So does item #2. So the exchange between #1 and #2 is
basically meaningless to the cost function, especially compared to the exchange of items close to the
mean. It is also possible that the floating point representation is unable to represent the difference
4.2 Real Rankings: “well-behaved” cases
In this section we explore three real rankings that have a similar convergence pattern, which can be
called “well-behaved” since they are extracted from real cases and are similar to an idealized uniformly distributed ranking.
4.2.1 Case 1:
The following ranking was accessed by World Chess Federation (Federation Internationale des
Echecs or FIDE). The idea of the Federation is to stimulate people to engage in Chess as mental sport.
In order to support those with best results and excellence, the Federation issues monthly rankings with
the scores of the latest competitions, considering only the active players. To be part of the rating list the
individual has to be registered through a national chess federation. There is only one dimension in the
aggregated ranking, the points won (i.e. a victory means one point, a loss zero, and half a point for
draws) (FIDE, 2016). Although in the website the total number of individuals with points higher than
1000 is listed, I only considered the first 100 players. Figure 3 displays the simulated annealing
Figure 3: Simulated Annealing applied to World Chess Federation Ranking
How to read the graph:
At a glance, this graph resembles, to a certain extent, the uniform idealized ranking graph (Figure 1);
this is why the ranking was categorized as a well-behaved ranking. The convergence shape is mostly
smooth. The curvature is more prominent because there is more divergence in the data that prevents the
convergence to be less precise than the idealized uniform distribution.
The resemblance with Figure 1 could be due to the fact that the ranking takes into consideration only
one dimension/indicator. From this, one can hypothesize that one-dimensional rankings, when well
measured, are mostly reliable since the only work that need to be done is ordering in a hierarchical
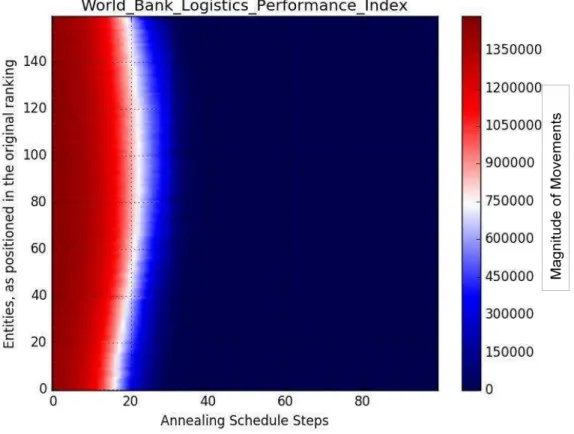
4.2.2 Case 2:
Issued by The World Bank, the Logistic Performance Index of 2013 (LPI) is a tool that intends to
help countries diagnose their challenges as well as their opportunities in trade logistics and; at same
time, benchmark with other countries. There are two different perspectives, (1) the international and (2)
the domestic. For this study I used the international LPI. The index ranks the performance of 160
countries, considering 1 dimension, comprised of 6 indicators.
Figure 4 presents the graph created by the use of the international LPI of 2013.
Figure 4: Simulated Annealing applied to World Bank Logistics Performance Index
How to read this graph:
Though starting with a higher temperature than the prior case, the convergence of the LPI data was
even faster, as it was before the 25th annealing step. The curvature is also smoothly convex, which is
what I call "well-behaved" (this will be further explained in the next set of cases, the poorly-behaved
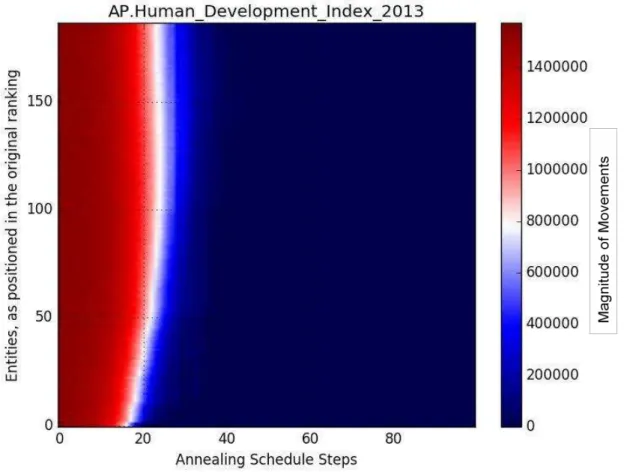
4.2.3 Case 3:
The last analyzed ranking that fits in my description as well-behaved is the Human Development
Index (HDI) of 2013. This index is generated annually by the United Nations, and the intention of the
United Nations Development Programme (UNDP) is to promote change through writing and research,
to help enhance economic and human wealth across countries. The idea is to aggregate nation’s
longevity, education and income dimensions through the use of a geometric mean of normalized
indices of each dimension. There are a total of 3 dimensions, 4 indicators and 187 countries into
consideration. Figure 5 displays the graph corresponding to the HDI.
The idea that complexity and the ranking are being handled seriously, and with caution to avoid the
disadvantages of rankings, is present in the technical notes of the HDI of 2013 (Nations, 2013).
How to read this graph:
Quasi-simultaneous convergence would be considered the best case scenario for rankings since it
means that each entity has a definite place in the ranking positioning. According to this idea, of the
studied cases the HDI is the one that has the best convergence. Consequently, this is an example of how
a ranking can actually coherently capture and inform consumers.
In summary, all the rankings in this category, considering the graphical and brief quality content
analysis of the websites, suggest that rankings that maintain a well-behaved convergence, given by
smoothness and convexity.
4.3 Real Rankings: transition to “poorly-behaved” cases
In this section I explore six real rankings that, differently from the previous section, have no defined
pattern of evolution of convergence. The shape of the poorly-behaved ranking cases is rather “chaotic”
and “fractal”.
4.3.1 Case 1:
The next case is provided by The Financial Times: a ranking of business schools in the Global MBA
program category. The idea of this organization in providing different types of rankings annually is to
allow consumers to assess the best management programs available, as the description in their website
claims. Figure 6 presents the simulated annealing algorithm applied to the Financial Times ranking of
2013, considering its 20 indicators for each of the 100 MBA schools.
The report and the methodology are only available for subscribers of The Financial Times platform.
Therefore, the transparency of the ranking is reduced since important information is not at hand.
Although they do permit a copy of key points in the Methodology, the indicators and criteria are only
Figure 6: Simulated Annealing applied to Financial Times Rankings of 2013
How to read this graph:
Here, convergence seems to have a different qualitative behavior. The positioning of the entities
occurs in different moments which imply that some entities are harder to nail down than others. This
was recurrent during the different annealing steps; the spikes in the graph give the impression of a
“chaotic” ranking. Based on the difficulty in finding the best solution for many cases among the
entities, I speculate that the ranking is not properly amenable to a clear-cut, precise, linear ordering of
4.3.2 Case 2:
The Failed States Index5 (FSI) is an annual ranking provided by The Fund for Peace (FFP) non-
profit organization. The main objective of this organization is to contribute to the world with
sustainable security, by providing tools that allow decision makers to assess and mitigate conflict
peacefully. According to the FSI report of 2013 (Haken et al., 2013), the index comprises three
dimensions, 12 indicators, with a total of 88 sub-indicators. The assessment accounted for 177
countries. Figure 7 displays the results of the simulation using the FSI.
Figure 7: Simulated Annealing applied to Failed States Index
How to read this graph:
Similar to the previous case, the FSI is converging fast and in a fractal manner. I hypothesize, in
conformity to the previous set of cases, that the number of indicators with different weights are part of
the reason why the convergence is “chaotic”. Some indicators can level out the effect of others.
5
4.3.3 Case 3:
Considering peace and prosperity in one side and violence and conflict in the other, the Global
Peace Index (GPI) issued by the Institute of Economics and Peace (IEP), tries to assess the level of
peacefulness from 162 countries through the use of 23 indicators. Each indicator is part of one of three
dimensions: i) the level of safety and security in society, ii) the extent of domestic and international
conflict, and iii) the degree of militarization. Figure 8 presents the results from the simulation for the
GPI.
Figure 8: Simulated Annealing applied to Global Peace Index
How to read this graph:
The GPI falls in the same category as the Financial Times Ranking 2013 (Figure 6) and the FSI
(Figure 7). One more time the ranking presented converges rapidly and is “chaotic” in nature. The
spikes in the figure point to a problems in finding the global optimal solution. As in the previous case,
4.3.4 Case 4:
In order to allow Nations to create an environment for innovation to take place and, then, to push
economic growth, Cornell University, INSEAD, and the World Intellectual Property Organization
(WIPO), and their Knowledge Partners worked together to annually publish the Global Innovation
Index (GII). The index aims to capture the essence of innovation and provide the tools that can assist
decision-makers in composing policies to promote long-term output growth, improved productivity,
and job growth. The GII of 2013, which the simulation graph is presented in Figure 9, is compounded
of 84 indicators and 142 entities (countries).
Figure 9: Simulated Annealing applied to Global Innovation Index of 2013
How to read this graph:
The most noticeable difference between Figure 9 and the prior figures is that the process lasts for a
4.3.5 Case 5:
Focusing on measuring, analyzing and comparing policies and regulation applied to companies
around the world - as well as their impact, the Doing Business Project is supported by the World Bank.
The objective is to offer decision-makers and other consumers a basis to understand and to improve the
environment of business. For the year of 2013, 185 economies were considered and covered by 10
indicators related to the ease of doing business in the referred area.
Figure 10: Simulated Annealing applied to Doing Business Ranking of 2013
How to read this graph:
Similar to the GII (Figure 9), the Doing Business Ranking of 2013 (Figure 10) had more steps until
the system offered a global solution, when compared to the other graphs in this section (Figures 6, 7
4.3.6 Case 6:
Published by the ShanghaiRankings Consultancy, the Academic Ranking of World Universities
(ARWU) is a ranking developed by researchers at The Center for World-Class Universities of Shanghai
Jiao Tong University (CWCU)6. The main objective of the organization is to create a tool to support the
consultancy to government and universities, through the generation of databases of research
universities and also to function as a clearinghouse of literature on world-class universities. The
ranking is updated annually and for the year of 2012 they were taking into account six indicators and
more than 1000 universities were ranked, although only 500 were published. Figure 11 presents the
graph for the ARWU top 100 entities across six indicators.
Figure 11:Simulated Annealing applied to Academic Rankings of World Universities of 2012
6
How to read this graph:
Despite apparently different from the other graphs in this section, the ARWU of 2012 differs from
the others only in the fact that some entities converged almost immediately while another portion took
longer to allocate, as evidenced by the spikes in Figure 11. Also, this was the graph that started with the
highest initial temperature (as shown in the label in the far right of the graph), so the expectation is to
have more movement in the choice of entities in the beginning. The scarcity of movement for the major
part of entities provides the idea that most entities fall perfectly in their positioning. Nevertheless, since
the ranking should be understood as a system, that is only validated if the whole fits perfectly into
5. DISCUSSION
This work has achieved two goals:
i) First, it is demonstrated that there is a qualitative difference in the convergence process of
rankings.
ii) Moreover, as far as I am aware, no study has used simulated annealing as tool towards
understanding the convergence process of the solution a problem. This is interesting because, even
computationally easy problems like rankings yield a wide variety of different convergence patterns.
The aforementioned goals imply some other questions: why do some rankings converge in a fractal
manner? In other words, why do some entities converge earlier than others? Are some entities
converging prematurely? If not, why so some particular entities demand more work for simulated
annealing to achieve convergence? What does this mean in regards to the quality of the ranking, if
anything? These are open questions that I plan to study in the future.
The study is most focused in the qualitative behavior of rankings, as opposed to precise measures of
how “poorly-behaved” a particular ranking is. Since the graphs for the two named categories of rankings are different and in accordance to the shape of the convergence, the differences can be
understood as “rankness”- the quality of sticking to the rankings characteristics. Mainly, the rankness is related to the idea that in a ranking each entity has a defined place in the hierarchy, thus this would
result in a more smooth convergence, since entities would fit into place in a smooth manner. While
well-behaved rankings originate convergence graphs with smooth and slight concavity, poorly-behaved
rankings, in the other hand, present graphs with “chaotic”, spiky like, appearance.
It is not my intention to develop a full theory, or even a model, of the aforementioned behaviors. In
fact, in the spirit of Asimov:
The most exciting phrase to hear in science, the one that
heralds new discoveries, is not “Eureka” but “That’s
funny...” Isaac Asimov (1920–1992)
I suggest that this behavior is “funny” and it has not been brought to light elsewhere--at least as far as I can tell--, although it certainly deserves more research and attention before the field could move on
I cannot affirm the existence of a relation between quality of convergence and the merit of a
ranking, regarding its respect to ranking characteristics or its weaknesses. However, as literature
indicates and reports, rankings do present disadvantages that can be causing these different patterns of
convergence, though it is not in the scope of the present study.
5.1 Limitations
As a heuristic method, Simulated Annealing does not guarantee an optimal solution (in this case,
since the objective was to analyze how flawed rankings might be its use was valid). Also, regarding the
method used, graphical analyses, there was not a real parameter to indicate the real magnitude of the
curvature from the simulated annealing graphs.
Another important limitation refers to the use of the cost function based on Euclidean distance and
the assumption that all real cases had normalized the scales previous to the formation of the overall
ranking. The Euclidean distance is volatile to magnitude, and so, the results could be reflection of the
numbers in the data, not real overall distance, if the data was not previously treated. In this case,
another distance could have been implemented, for instance, the Mahalanobis distance, which take
correlation of dataset into account and is scale-invariant.
Although the definition of characteristics of rankings is straightforward, there is still need for more
studies in defining it in order to establish the concept.
Finally, the right ordering of entities not necessarily, a rapid and smooth convergence does not mean
that what is being measured is something important or linked to the purpose of the ranking. Although in
this work there was partly an effort to analyze it, it was not in the main goal of the study.
5.2 Future Research
In consideration to the limitation of using a cost function based on Euclidean Distance, a future
study could be replicating the process presented in the present study, but using the Mahalanobis
distance instead.
A following study would show the comparison between the published (i.e. real ranking) and the
resulting ranking from the Simulated Annealing procedure. This could more easily generate an insight
For future research I would also like to compare the results obtained herein with those obtained, for
instance, by simulated annealing in the TSP (The Salesman Person problem). Since any convex set of
points creates a TSP with one local minima (e.g., the global one), I know how the convergence process
behaves within the most simple problem (i.e. TSP). I would also be able to compare that simplest form
to those of "real" TSPs and, of higher interest, how those analyses compare to the ones conducted in
rankings.
Having demonstrated these different convergence patterns, an obvious extension to this study would
consider the creation of a metric to define the quality of convergence. This could be done by first
creating a filter, like those employed in computer vision, to detect edges in the images, and afterwards
creating a unique measure of the "ruggedness" of the convergence process. One can hope that such a