Universidade Federal de Minas Gerais
Programa de Pós-Graduação em Engenharia Metalúrgica e de Minas
Tese de Doutorado
“
Preparação e avaliação in vitro de nanofibras
Gelatina/Policaprolactona com estrutura casca-núcleo obtidas por
eletrofiação co-axial
”
Autor: Ildeu Helênio Lazarini Pereira
Orientador: Prof. Rodrigo Lambert Oréfice, Dr.
Co-orientadora: Profa. Eliane Ayres, Dra.
Universidade Federal de Minas Gerais
Programa de Pós-Graduação em Engenharia Metalúrgica e de Minas
Ildeu Helênio Lazarini Pereira
PREPARAÇÃO E AVALIAÇÃO IN VITRO DE NANOFIBRAS
GELATINA/POLICAPROLACTONA COM ESTRUTURA
CASCA-NÚCLEO OBTIDAS POR ELETROFIAÇÃO CO-AXIAL
Defesa de tese a ser apresentada ao Curso de Pós-Graduação em Engenharia
Metalúrgica e de Minas da Universidade Federal de Minas Gerais
Área de Concentração: Ciência dos Materiais
Orientador: Prof Rodrigo Lambert Oréfice, Dr.
Co-orientadora: Profa. Eliane Ayres, Dra.
Belo Horizonte
Escola de Engenharia da UFMG
Dedico este trabalho aos meus pais. Mesmo
ausentes fisicamente, me ensinaram as lições
AGRADECIMENTOS
Entre matérias isoladas, mestrado e doutorado, oito anos se foram sem mesmo que eu
pudesse perceber. As realizações são infinitas e as propostas futuras foram
completamente alteradas com o passar destes anos. Tenho orgulho desta etapa e de tudo
que hoje quero para minha vida. Posso dizer que vivo intensamente e não me arrependo.
Viver é uma arte, e a arte faz parte da minha vida. Todos os pontos se tornam infinitos,
basta questionar. Tese é questionar, disciplinar, organizar e, muitas vezes, se sentir
perdido. A sensação do término é de estar pronto para começar. Valeu a pena!
E, neste período e em todos os campos, levamos uma multidão conosco. Muitos andam
juntos, outros atravessam, outros atrapalham, outros impedem, outros amam,
compartilham e se deixam envolver. Posso ver de tudo, eu vi de tudo! Mas o
crescimento é certeiro.
Agradeço a Deus por ser quem eu sou e estar sempre pronto para questionar e aprender
com humildade. Muito obrigado!
Meus pais, minha dedicatória é eterna.
Ao Renato Buratto, sem ele o caminho seria ardiloso demais. Sem palavras para sempre
te agradecer! Ao Isaías Renato Buratto (Dzemba), Carmen Buratto, Stella e Gil, Felipe
e Wally, muito obrigado por tanto carinho.
Ao meu orientador, Rodrigo Lambert Oréfice, uma profunda admiração. Seria
impossível agradecer todo o cuidado durante tantos anos. Impressionante! Você tem e
disfruta do dom de ser professor e pesquisador. Meus parabéns e meu muito obrigado!
À Eliane Ayres, eu agradeço por tudo! Ela foi tudo que um aluno e um amigo precisa
uma redoma de proteção que nos conforta e nos faz acreditar que somos capazes. Do
fundo do meu coração, não sei como te agradecer, e isto é inquestionável!
A todos os amigos e colegas do laboratório, muito obrigado por uma convivência tão
fácil!
Ao Professor Alfredo de Miranda Góes, Ana Cláudia Chagas e equipe, um muito
obrigado do fundo do coração!
Aos professores franceses Guy Schlatter, Anne Hebraud, Luc Averous e todos os
colegas e amigos franceses, esta experiência foi maravilhosa e única. Muito obrigado!
Maria Aparecida Pacheco e Nelson Azevedo. Muito obrigado por me salvarem em todas as situações, vocês são sensacionais!
À Profa. Rosário E. S. Bretas, muito obrigado por me ajudar sempre prontamente!
À Maria Cristina Monteiro de S. Costa, amor eterno! À Celeste Costa, muito obrigado pelo meu primeiro livro de engenharia, “Ciência dos Materiais”! Foi realmente o início.
Sônia Lara, pra sempre vou te amar! Impressionante como você sempre está presente!
Roni Roland, André Bernardi e Rô, Gra, Lalá, Agnaldo e Vera, Agda Aline Rocha de Oliveira, vocês são muito especiais!
À minha família, e todos os que fazem parte da minha vida com um sentimento bom e
Sumário
ÍNDICE DE FIGURAS ... II ÍNDICE DE TABELAS ... IV RESUMO ... V ABSTRACT... VI
1 INTRODUÇÃO ... 1
2 OBJETIVOS ... 8
2.1 OBJETIVO GERAL: ... 8
2.2 OBJETIVOS ESPECÍFICOS: ... 8
3 INFLUENCE OF SOLUTION AND PROCESSING PARAMETERS IN ELECTROSPINNING OF SINGLE POLY(Ε-CAPROLACTONE) (PCL) NANOFIBERS AND CO-AXIAL PCL/GELATIN NANOFIBERS ... 9
3.1 INTRODUCTION ... 10
3.2 MATERIALS AND METHODS ... 12
3.3 RESULTS AND DISCUSSION ... 14
3.4 CONCLUSIONS ... 37
4 ELABORATION AND CHARACTERIZATION OF COAXIAL ELECTROSPUN POLY(Ε -CAPROLACTONE)/GELATIN NANOFIBERS FOR BIOMEDICAL APPLICATIONS ... 40
4.1 INTRODUCTION ... 41
4.2 MATERIALS AND METHODS ... 43
4.3 RESULTS AND DISCUSSION ... 46
4.4 CONCLUSIONS ... 64
5 IN VITRO BIOCOMPATIBILITY AND OSTEOGENESIS OF MINERALIZED ELECTROSPUN CO-AXIAL POLY(Ε-CAPROLACTONE) (PCL)/GELATIN NANOFIBERS .. 67
5.1 INTRODUCTION ... 68
5.2 MATERIALS AND METHODS ... 71
5.3 RESULTS AND DISCUSSION ... 78
5.4 CONCLUSIONS ... 92
Índice de Figuras
FIGURE 3.1:FTIR SPECTRUM OF PCL NANOFIBER MATS.SAMPLE USED:PCL-20. ... 16
FIGURE 3.2:GRAPH SHOWING FIBER DIAMETER VS. APPLIED VOLTAGE FOR 10,12 AND 14% SOLUTIONS OF PCL IN TFE.SAMPLES USED:PCL-12,PCL-13,PCL-14,PCL-15,PCL-20,PCL-21,PCL-22, PCL-23,PCL-28,PCL-29,PCL-30 AND PCL-31.DISTANCE FROM NEEDLE TO COLLECTOR OF 12 CM AND FEED RATE OF 0.8 ML/HR.ERROR BARS ARE ± STANDARD DEVIATION OF SAMPLE POPULATION. ... 17
FIGURE 3.3:MEV OF THE PCL NANOFIBER MATS:(A)PCL-12;(B)PCL-15;(C)PCL-20;(D)PCL-23;(E) PCL-28 AND (F)PCL-31.(MAGNIFICATION 103X) ... 18
FIGURE 3.4:GRAPH SHOWING FIBER DIAMETER VS. APPLIED VOLTAGE FOR 10,12 AND 14% SOLUTIONS OF PCL IN TFE.SAMPLES USED:PCL-16,PCL-17,PCL-18,PCL-19,PCL-24,PCL-25,PCL-26, PCL-27,PCL-32,PCL-33,PCL-34 AND PCL-35.DISTANCE FROM NEEDLE TO COLLECTOR OF 15 CM AND FEED RATE OF 0.8 ML/HR.ERROR BARS ARE ± STANDARD DEVIATION OF SAMPLE POPULATION. ... 19
FIGURE 3.5:MEV OF THE PCL NANOFIBERS MATS:(A)PCL-16;(B)PCL-19;(C)PCL-24;(D)PCL-27;(E) PCL-32;(F)PCL-35.(MAGNIFICATION 103X) ... 20
FIGURE 3.6:COMPARASION OF THE FIBER DIAMETER USING DISTANCE BETWEEN THE TIP AND THE COLLECTOR OF 12 CM (LEFT) AND 15 CM (RIGHT) FOR VOLTAGES OF 18/0,20/0,22/0 AND 25/0. SAMPLES USED:18/0:PCL-12,PCL-20,PCL-28(12 CM) AND PCL-16,PCL-24,PCL-32(15 CM); 20/0:PCL-13,PCL-21,PCL-29(12 CM) AND PCL-17,PCL-25,PCL-33(15 CM);22/0:PCL-14, PCL-22,PCL-30(12 CM) AND PCL-18,PCL-26,PCL-34(15 CM);25/0:PCL-15,PCL-23,PCL-31 (12 CM) AND PCL-19,PCL-27,PCL-35(15 CM). ... 22
FIGURE 3.7:GRAPH SHOWING AVERAGE FIBER DIAMETER VS. SOLUTION CONCENTRATION OF PCL IN TFE. SAMPLES USED:(A)PCL-70,PCL-75 AND PCL-80;(B)PCL-71,PCL-76 AND PCL-81;(C)PCL-35. ... 23
FIGURE 3.8:GRAPH SHOWING FIBER DIAMETER VS. SOLUTION CONCENTRATION OF PCL IN ACETIC ACID/FORMIC ACID 1:1(% V/V).SAMPLES USED:PCL-3,PCL-5,PCL-7, AND PCL-10.APPLIED VOLTAGE OF 25/0, DISTANCE FROM NEEDLE TO COLLECTOR OF 14 CM AND FEED RATE OF 0.4 ML/HR. ERROR BARS ARE ± STANDARD DEVIATION OF SAMPLE POPULATION. ... 25
FIGURE 3.9:RHEOGRAMS FOR PCL SOLUTION (15% WT) AFTER DIFFERENT TIMES. ... 28
FIGURE 3.10:RHEOGRAMS FOR GELATIN SOLUTION (15% WT) AFTER DIFFERENT TIMES. ... 29
FIGURE 3.11:VISCOSITY FOR GELATIN SOLUTION (15% WT) AFTER 1 HOUR. ... 30
FIGURE 3.12:VISCOSITY/SHEAR RATE RELATIONSHIP FOR PCL SOLUTION (15% WT) AFTER DIFFERENT TIMES. ... 30
FIGURE 3.13:VISCOSITY/SHEAR RATE RELATIONSHIP FOR GELATIN SOLUTION (15% WT) AFTER DIFFERENT TIMES. ... 31
FIGURE 3.14:VISCOSITY VERSUS TIME FOR GELATIN AND PCL SOLUTION (15% WT). ... 32
FIGURE 3.15:TIME OF RESIDENCE IN THE SOLVENTS VERSUS RELATIVE VISCOSITIES OF THE CORE AND SHELL SOLUTIONS. ... 33
FIGURE 3.16:MEV OF CO-AXIAL PCL/GELATIN NANOFIBERS IN ACETIC ACID/FORMIC ACID (1:1 V/V):THE ARROW HIGHLIGHTS THE PCL CORE OF CO-AXIAL FIBER.SAMPLE USED PCL/G-134. (MAGNIFICATIONS:(A)103X AND (B)5.103X) ... 35
FIGURE 3.17:MET OF CO-AXIAL PCL/GELATIN NANOFIBERS IN ACETIC ACID/FORMIC ACID (1:1 V/V):THE ARROW HIGHLIGHTS THE PCL CORE OF CO-AXIAL FIBER.SAMPLE USED PCL/G-134. ... 36
FIGURE 4.1:SCHEME OF THE ELECTROSPINNING SETUP. ... 41
FIGURE 4.2:SCANNING ELECTRON MICROSCOPE PHOTOGRAPHS OF ELECTROSPUN GELATIN NANOFIBERS FOR VARIOUS CONCENTRATIONS (MAGNIFICATION OF 103):(A)9%,(B)7%,(C)5% AND (D)4%.THE APPLIED SOLUTION VOLTAGE AND THE TIP-TO-COLLECTOR DISTANCE WERE 30 KV AND 10 CM, RESPECTIVELY.SAMPLES USED:GEL-41,GEL-48,GEL-43 AND GEL-58. ... 48
FIGURE 4.3:FIBER DIAMETER VS. APPLIED VOLTAGE FOR THE 4 AND 5% SOLUTIONS OF GELATIN IN TFE. SAMPLES USED:GEL-58,GEL-61,GEL-62,GEL-64,GEL-65 AND GEL-67. ... 49
FIGURE 4.4:FIBER DIAMETER VS. NEEDLE-TO-COLLECTOR DISTANCE AT A FIXED VOLTAGE FOR THE 5% SOLUTION OF GELATIN IN TFE.SAMPLES USED:GEL-50,GEL-51 AND GEL-52.THE ERROR BARS ARE THE ± STANDARD DEVIATIONS OF THE SAMPLE POPULATION. ... 50
FIGURE 4.6:SCANNING ELECTRON MICROSCOPE PHOTOGRAPHS OF ELECTROSPUN COAXIAL PCL/GELATIN NANOFIBERS FOR PCL SOLUTION CONCENTRATIONS OF:(A)12%(W/W) AND (B)7%(W/W) WITH A FEED RATE OF 0.2 ML/HR FOR BOTH SOLUTIONS AND A VOLTAGE OF 30 KV.SAMPLES USED:(A) PCL/G-89 AND (B)PCL/G-93.(MAGNIFICATION OF 5.103). ... 55 FIGURE 4.7:TEM OF THE CORE-SHELL MORPHOLOGY OF THE PCL/GELATIN NANOFIBERS OBTAINED BY
ELECTROSPINNING THE 7%(W/W)PCL/TFE SOLUTION (CORE) AND THE 5%(W/W) GELATIN/TFE
SOLUTION (SHELL).THE FEED RATES OF THE CORE SOLUTION AND SHELL SOLUTION WERE 0.2 ML/HR AND THE APPLIED VOLTAGE WAS 30 KV.SAMPLE USED:PCL/G-93 ... 56 FIGURE 4.8:FTIR SPECTRA OF UNCROSSLINKED COAXIAL PCL/GELATIN NANOFIBERS (A) BEFORE WASHING
AND (B) AFTER WASHING AND (C) OF SINGLE GELATIN NANOFIBERS (CONTROL).SAMPLES USED: PCL/G-93 AND PCL/G-44 ... 57 FIGURE 4.9:FTIR SPECTRA OF COAXIAL PCL/GELATIN NANOFIBERS CROSSLINKED WITH GTA:(A) BEFORE
WASHING AND (B) AFTER WASHING.SAMPLE USED:PCL/G-93 ... 58 FIGURE 4.10:SCANNING ELECTRON MICROSCOPE PHOTOGRAPHS OF COAXIAL PCL/GELATIN NANOFIBERS
CROSSLINKED WITH GTA.SAMPLE USED:PCL/G-93(MAGNIFICATION OF 5.103). ... 59 FIGURE 4.11:DSC CURVES (COOLING AND 2ND
SCAN HEATING) OF:(A)GTA CROSSLINKED PCL/GELATIN COAXIAL NANOFIBERS AND (B)GTA CROSSLINKED GELATIN NANOFIBERS (CONTROL).SAMPLES USED:PCL/G-129 AND PCL/G-44 ... 60 FIGURE 4.12:TEM OF COAXIAL NANOFIBERS:(A) BEFORE EXTRACTION (CONTROL) AND (B) AFTER
EXTRACTION OF THE PCL CORE USING DICHLOROMETHANE.SAMPLE USED:PCL/G-129 ... 61 FIGURE 4.13:SCANNING ELECTRON MICROSCOPE PHOTOGRAPHS OF ELECTROSPUN COAXIAL PCL/GELATIN
NANOFIBERS AT VOLTAGES OF:(A)25/0 AND (B)30/0.THE PCL SOLUTION CONCENTRATION OF 12% (W/W) AND A FEED RATE OF 0.2 ML/HR WERE USED FOR THE PCL SOLUTION AND 0.3 ML/HR FOR THE
GELATIN SOLUTION.SAMPLES USED:(A)PCL/G-85 AND (B)PCLG-88(MAGNIFICATION OF 5.103). 61 FIGURE 4.14:SCANNING ELECTRON MICROSCOPE PHOTOGRAPHS OF ELECTROSPUN COAXIAL PCL/GELATIN
NANOFIBERS FOR DIFFERENT FEED RATES OF THE PCL SOLUTION:(A)0.4 ML/HR (B)0.3 ML/HR.THE
PCL SOLUTION CONCENTRATION OF 7%(W/W), A GELATIN SOLUTION FEED RATE OF 0.6 ML/HR AND A VOLTAGE OF 30 KV WERE USED.SAMPLES USED:(A)PCL/G-127 AND (B)PCL/G-129.
(MAGNIFICATION OF 5.103). ... 63 FIGURE 5.1:CO-AXIAL PCL/GELATIN NANOFIBERS CROSSLINKED WITH GLUTARALDEHYDE PRIOR TO
MINERALIZATION.(A)SEM AND (B)TEM.PCL IN TFE(7%W/W; CORE), FLOW RATE OF 0.3 ML/HR;
AND GELATIN IN TFE SOLUTION (5%W/W; SHELL), FLOW RATE OF 0.6 ML/HR.VOLTAGE:30/0 KV;
DISTANCE BETWEEN THE NEEDLE TIP AND THE COLLECTOR:15 CM; RELATIVE HUMIDITY:37.5%;
TEMPERATURE:21.5 ºC. ... 79 FIGURE 5.2:SEM MICROGRAPHS SHOWING THE SURFACE OF THE CO-AXIAL PCL/GELATIN NANOFIBERS
AFTER COATING WITH SBF10 FOR 2H:(A)5000X MAGNIFICATION;(B)10000X MAGNIFICATION. ... 81 FIGURE 5.3:EDS SPECTRUM FOR COATED CO-AXIAL PCL/GELATIN NANOFIBERS AFTER MINERALIZATION.
... 82 FIGURE 5.4:XRD PATTERN OBTAINED FOR SBF10-COATED CO-AXIAL PCL/GELATIN NANOFIBERS. ... 83 FIGURE 5.5:PEAK AT 31.7° EXPANDED FROM THE XRD PATTERN AND USED IN THE SCHERRER EQUATION.
... 85 FIGURE 5.6:FTIR SPECTRUM OF MINERALIZED CO-AXIAL PCL/GELATIN NANOFIBERS. ... 86 FIGURE 5.7:MTT PROLIFERATION ASSAYS PERFORMED 7,14 AND 21 DAYS AFTER HASCS WERE SEEDED
AND CULTURED IN THREE SPECIFIC MEDIA: BASAL MEDIUM, OSTEOGENIC MEDIUM AND ENDOTHELIAL DIFFERENTIATION MEDIUM.THE RESULTS ARE EXPRESSED AS THE MEAN ±SD;(*) INDICATES A SIGNIFICANT DIFFERENCE AT P<0.05 FOR BASAL X OSTEOGENIC MEDIUM;(Φ) INDICATES A
SIGNIFICANT DIFFERENCE AT P<0.05 FOR BASAL +PCL/GELATIN X OSTEOGENIC +PCL/GELATIN,(Δ)
P<0.05 BASAL +PCL/GELATIN X ENDOTHELIAL +PCL/GELATIN. ... 88 FIGURE 5.8:ALP ACTIVITY ASSAYS PERFORMED 7,14 AND 21 DAYS AFTER HASCS WERE SEEDED AND
CULTURED IN TWO SPECIFIC MEDIA: BASAL MEDIUM AND ENDOTHELIAL DIFFERENTIATION MEDIUM. THE RESULTS ARE EXPRESSED AS THE MEAN ±SD;(*) AND (Φ) INDICATE A SIGNIFICANT DIFFERENCE AT P<0.05. ... 90 FIGURE 5.9:CONFOCAL IMAGES OF THE EXPRESSION OF THE VWF FACTOR OF HASCS AFTER 21 DAYS
CULTURED ON THE ELECTROSPUN PCL/GELATIN MATS IN:(A) BASAL MEDIUM (CONTROL) AND (B)
Índice de Tabelas
Resumo
Neste estudo, nanofibras de policaprolactona (PCL) e de gelatina foram produzidas pela técnica de eletrofiação, e a associação destes dois polímeros formando uma estrutura casca-núcleo foi conseguida pela técnica de eletrofiação co-axial. Nanofibras com esta estrutura são ótimas candidatas para uso na Engenharia de Tecidos, pois são capazes de mimetizar a estrutura da matriz extra-celular, e, neste caso, combinando a bioatividade da gelatina (polímero natural) com a biodegradabilidade e melhores propriedades mecânicas da policaprolactona (polímero sintético). A hidrofilia da gelatina a torna solúvel em meio aquoso, por isso, para utilizá-la como biomaterial, uma reticulação das cadeias foi feita com glutaraldeído. Técnicas, como Infravermelho porTtransformada de Fourier (FTIR) e microscopias de Transmissão e Varredura revelaram a morfologia das fibras obtidas após mudanças nos parâmetros
Abstract
In this study, nanofibers containing polycaprolactone (PCL) and gelatin were produced by electrospinning. The combination of these two polymers in a core-shell structure was achieved by using a coaxial electrospinning technique. Nanofibers with this type of structure are good candidates for Tissue Engineering, since they are able to mimetize the structure of the extracellular matrix by combining the bioactivity of gelatin (natural polymer) with the biodegradability and high mechanical properties of polycaprolactone (synthetic polymer). Gelatin was submitted to a crosslinked reaction with glutaraldehyde in order to reduce its solubility in aqueous solutions Techniques such as FTIR, Transmission and Scanning Microscopies showed the morphology of the nanofiber obtained after changes in solution and electrospinning parameters were performed. In this work, it was also demonstrated the possibility of biomimetically
1
Introdução
A Nanotecnologia está crescendo rapidamente e nos afetará em alguma fase de nossas
vidas. Pesquisas extensas estão sendo atualmente feitas nesta área para melhorar nossa
qualidade de vida, sendo um atraente caminho para abordagens na área biomédica como
regeneração tecidual, curativos e liberação controlada de fármacos.
Com o aumento numeroso da população idosa, a procura por enxertos ósseos tem
gerado uma escassez na disponibilidade de tecidos doadores músculo-esqueletais [1].
Auto-enxertos apresentam muitas desvantagens para os pacientes, como o aumento no
tempo de cirurgia, limitada quantidade de osso e dor no local doador [2]. Isto tem
estimulado muito o interesse por materiais que possam ser substitutos de tecido ósseo.
Na Engenharia de Tecidos propõe-se a criação de um novo tecido para substituir em
parte ou mesmo totalmente o tecido lesado. Muitos destes órgãos são estruturas fibrosas
em escala nanométrica ou mesmo milimétrica. Quanto mais a estrutura artificial
construída se assemelhar ao natural, melhores serão as respostas orgânicas.
Nanofibras podem servir de substrato para crescimento de tecidos devido à grande área
superficial e poros interconectados em uma estrutura tridimensional. Elas podem
mimetizar a forma fibrilar da matriz extracelular (MEC), que é um complexo de
poliproteínas e polissacarídeos numa estrutura nanométrica [3]. Uma matriz de
nanofibras deve também permitir a infiltração e proliferação celular [4].
A recuperação de tecidos requer uma função reparativa celular que é sustentada em uma
rede tridimensional ao redor e dentro da matriz do biomaterial. Isto ocorre através de
atividades celulares como adesão, migração, crescimento e diferenciação celular. Já foi
demonstrado que a adesão e a taxa de proliferação de células aumentam em matrizes
nanofibrosas quando comparado a filmes planos porosos de polímeros [5]. Origem
biodegradável que sirva como matriz extra-celular até a neoformação tecidual são três
elementos básicos que se interagem para o sucesso da Engenharia de Tecidos em casos
de cirurgia óssea reconstrutiva [1].
A demanda por novas nanoestruturas em biomateriais tem gerado um grande
desenvolvimento técnico-cientifico nos últimos anos. Na eletrofiação, nanofibras
poliméricas são produzidas como resultado de forças elétricas repulsivas que superam a
tensão superficial do líquido polimérico carregado. Basicamente, o sistema de
eletrofiação consiste em três partes: um gerador de alta tensão, uma seringa contendo a
solução polimérica e um coletor [6]. Quando a intensidade do campo elétrico é
aumentada, as cargas induzidas na superfície do líquido se repelem entre si criando uma
instabilidade de cargas. Estas forças repulsivas agem em direção oposta a da tensão
superficial, que resulta na extensão da gota na ponta da agulha numa forma cônica
(Cone de Taylor) [7]. Quando estas forças repulsivas superam a tensão superficial do
líquido, esta gota se alonga e se transforma em um jato estável que vai em direção ao
coletor de carga oposta. Neste trajeto do jato, o solvente da solução evapora e fibras são
formadas no coletor.
Parâmetros da solução (viscosidade, condutividade, tensão superficial, peso molecular
do polímero e constante dielétrica), do processamento (campo elétrico, distância
agulha-coletor e taxa de infusão) e do ambiente (humidade e temperatura) influenciam e
direcionam o processo de Eletrofiação [4].
O uso efetivo de matrizes nanofibrosas poliméricas para engenharia de tecidos não está
baseado somente na construção das fibras, mas também nas características dos materiais
usados. Em particular, o processo de fabricação de nanofibras através de eletrofiação
usando polímeros biodegradáveis sintéticos e naturais torna possível a construção de
estruturas que se assemelham a elementos da matriz extracelular, além de melhorar a
função de regeneração tecidual in vitro. Estudos com culturas celulares mostraram que a
matriz é densamente povoada rapidamente por células que promovem uma infiltração
celular na estrutura fibrilar. Além disso, a técnica de eletrofiação proporciona uma
Nanofibras biocompatíveis e biodegradáveis são produzidas rotineiramente pela técnica
de eletrofiação com uma enorme variedade de polímeros sintéticos e naturais, assim
como compósitos contendo material inorgânico [9]. Os polímeros sintéticos geralmente
criam a estrutura mecânica necessária, como resistência mecânica e degradação
controlada. Já os polímeros naturais são mais biocompatíveis.
Dentre os polímeros sintéticos rotulados normalmente como biocompatíveis e
biodegradáveis, a poli(caprolactona) (PCL) tem recebido uma atenção considerável. É
um polímero hidrofóbico semi-cristalino com um grupo éster polar. Devido ao seu alto
grau de cristalinidade e hidrofobia, o PCL degrada lentamente, mas não possui a mesma
bioatividade de polímeros naturais [10].
Muito pertinente seria então criar estruturas nanométricas onde se combinem materiais
sintéticos e naturais. O uso de polímeros naturais é importante porque estes são
extremamente biocompatíveis, carregando proteínas especificas com grupamentos como
RGD (arginina, glicina e ácido aspártico) com capacidade inerente de adesão celular [6].
Dentre os biopolímeros naturais, o colágeno, rico em RGD, que é um componente da
matriz dérmica com fibras na dimensão de 50-500 nm, tem sido largamente usado como
poliproteína na engenharia de tecidos pela excelente biocompatibilidade e
não-imunogenicidade, mas as propriedades mecânicas ainda não foram alcançadas como as
requeridas pela matriz extracelular [11].
A gelatina, biopolímero natural formado a partir da hidrólise controlada do colágeno,
possui a mesma sequência de proteínas (RGD), tem mais baixa antigenicidade do que o
colágeno, além de ser de baixo custo. Ela pode ser retirada de tecido animal como pele,
músculo ou osso [11]. Entretanto a gelatina degrada rapidamente em contato com
fluidos corporais, necessitando de um tratamento de reticulação para não limitar sua
utilização como matriz para regeneração tecidual [12].
Recentemente, um sistema de eletrofiação utilizando seringas com capilares coaxiais foi
estrutura casca-núcleo [13]. O emprego desta tecnologia avançada de eletrofiação
coaxial proporciona inúmeros benefícios. Por exemplo, os materiais do núcleo podem
fornecer determinadas propriedades requeridas pelo tecido a ser reparado, ao passo que
os materiais da casca podem ser projetados para incluir propriedades adicionais, tais
como biocompatibilidade ou propriedades hidrofílicas.
A principal vantagem da nanoestrutura núcleo-casca obtida pela técnica de eletrofiação
coaxial é o potencial para obter uma combinação de propriedades de diferentes tipos de
materiais. Esta técnica é interessante não só no desenvolvimento de nanofibras
multifuncionais, mas também matrizes com diferentes taxas de degradação em
diferentes períodos de uso no corpo humano. A performance mecânica de nanofibras,
com específicas concentrações de polímeros no núcleo e na casca, produzidas por tal
processo, geralmente é melhor do que aquelas produzidas somente com um polímero
[14]. Esta técnica também é estudada para a produção de nanofibras com liberação
controlada de fármacos, onde o polímero da casca impede a liberação inicial acelerada
do fármaco encapsulado no polímero do núcleo [15].
A incorporação de minerais, como fosfato de cálcio nas nanofibras eletrofiadas é um
excelente caminho para a fabricação de matrizes para a Engenharia de Tecido ósseo [9].
O osso é constituído de uma fase mineral com 60-70% de hidroxiapatita carbonatada
cristalina e de uma matriz orgânica rica em fibras de colágeno [16]. Compósitos
poliméricos contendo Hidroxiapatita podem aprimorar o crescimento de osteoblastos
[17]. Tendo em vista que a associação entre hidroxiapatita e colágeno são os mais
promissores substitutos dos ossos [16] e que a presença de gelatina facilita o
recobrimento homogêneo das nanofibras por fosfato de cálcio, várias técnicas têm sido
desenvolvidas para incorporar minerais em matrizes poliméricas a fim de ajudar na
indução de diferenciação óssea [18].
Neste contexto, esta pesquisa pretende elucidar características de nanofibras que
associam polímeros sintéticos e naturais, PCL e gelatina, respectivamente, processadas
através da técnica de eletrofiação coaxial em uma estrutura núcleo-casca. Pretende-se
beneficiar a reparação óssea. A construção destas nanoestruturas tridimensionais
citocompatíveis in vitro e in vivo as tornaria perfeitamente capaz de funcionar como
matrizes para crescimento celular, além de serem capazes de se degradar conjuntamente
à reparação tecidual.
Os objetivos específicos e da tese em geral são apresentados no capítulo 2. Os
resultados desta Tese serão descritos e discutidos nos capítulos 3, 4 e 5. No terceiro e
quarto capítulos serão retratadas a produção de nanofibras de Policaprolactona e
gelatina obtidas pela técnica de Eletrofiação e a produção de nanofibras coaxiais destes
mesmos polímeros obtida pela técnica de Eletrofiação coaxial. Estas produções foram
realizadas em conjunto com a Universidade de Strasbourg – França, no contexto do
projeto CAPES – Cofecub. Estudos preliminares in vitro de citotoxicidade destas
nanofibras coaxiais após cobertura com fosfatos de cálcio serão mostrados no terceiro
capítulo, assim como indícios de osteogênese e angiogênese em células-tronco
cultivadas nestas nanofibras. Os estudos biológicos foram feitos em parceria com o
laboratório do Prof. Alfredo Góes de Miranda (Instituto de Ciências Biológicas -
UFMG). Com exceção dos capítulos de introdução, objetivos e conclusão (capítulo 6), o
Referências
1. Yang F, Wolke JGC, Jansen JA. Biomimetic calcium phosphate coating on electrospun poly (ε -caprolactone) scaffolds for bone tissue engineering. Chem. Eng. J 2008; 137:154-161.
2. Phipps MC, Clem WC, Grunda JM, Clines GA, Bellis SL. Increasing the pore sizes of bone-mimetic electrospun scaffolds comprised of polycaprolactone, collagen I and hydroxyapatite to enhance cell infiltration. Biomaterials 2012; 33:524-534.
3. Kim SH, Shin C, Min SK, Jung SM, Shin HS. In vitro evaluation of the effects of electrospun PCL nanofibers mats containing the microalgae Spirulina (Arthrospira) extract on primary astrocytes. Colloids and Surfaces B: Biointerfaces 2012; 90:113-118.
4. Chakrapani VY, Gnanamani A, Giridev VR, Madhusoothanan M, Sekaran G. Electrospinning of Type I collagen and PCL nanofibers using acetic acid. Journal of Applied Polymer Scienve 2012; 125:3221-3227.
5. Kim YJ, Park MR, Kim MS, Kwon OH. Polyphenol-loaded polycaprolactone nanofibers for effective growth inhibition of human cancer cells. Materials Chemistry and Physics 2012; 133:674-680.
6. Bhardwaj N, Kundu SC. Electrospinning: A fascinating fiber fabrication technique. Biotechnol. Adv 2010; 28:325-47.
7. Baji A, Mai YW, Wong SC, Abtahi M, Chen P. Electrospinning of polymer nanofibers: Effects on oriented morphology, structures and tensile properties. Compos. Sci. Technol 2010; 70:703-18.
8. Chong EJ, Phan TT, Lim IJ, Zhang YZ, Bay BH, Ramakrishna S, Lim CT. Evaluation of electrospun PCL/gelatin nanofibrous scaffold for wound healing and layered dermal reconstitution. Acta Biomaterialia 2007; 3:321-30.
9. Li X, Xie J, Lipner J, Yuan X, Thomopoulos S, Xia Y. Nanofiber scaffolds with gradations in mineral content for mimicking the tendon-to-bone insertion site. Nano Letters 2009; 9(7):2763-2768.
10. Woodruff MA, HutmacherDW. The return of a forgotten polymer-Polycaprolactone in the 21st century. Prog. Polym. Sci 2010; 35(10):1217-56.
11. Ki CS, Baek DH, Gang KD, Lee KH, Um IC, Park YH. 2005 Characterization of gelatin nanofiber prepared from gelatin–formic acid solution. Polymer 2005; 46:5094-102.
12. Wu SC, Chang WH, Dong GC, Chen KY, Chen YS, Yao CH. Cell adhesion and proliferation enhancement by gelatin nanofiber scaffolds. Journal of Bioactive and Compatible Polymers 2011; 26(6):565-577.
13. Zhao P, Jiang H, Pan H, Zhu K, Chen W. Biodegradable fibrous scaffolds composed of gelatin coated poly(ε-caprolactone) prepared by coaxial electrospinning. Journal of Biomedical Materials Research 2007; 83:372-382.
15. Meinel, AJ, Germershaus O, Luhmann T, Merkle H, Meinel L. Electrospun matrices for localized drug delivery: current Technologies and selected biomedical applications. European Journal of Pharmaceutics and Biopharmaceutics 2012; 81:1-13.
16. Bigi A, Boanini E, Panzavolta S, Roveri N, Rubini K. Bonelike apatite growth on hydroxyapatite-gelatin sponges from simulated body fluid. 2002; 59:709-714.
17. Campos DM, Anselme K, Soares GDA. In vitro biological evaluation of 3D hydroxyapatite/collagen (50/50 wt. (%)) scaffolds. Material Research 2012; 15(1):151-158. 18. Tas AC, Bhaduri SB. Rapid coating of Ti6Al4V at room temperature with a calcium phosphate
2
Objetivos
2.1Objetivo geral:
Preparação e avaliação in vitro de nanofibras Gelatina/Policaprolactona com estrutura
casca-núcleo obtidas por eletrofiação co-axial para uso em Engenharia de Tecidos.
2.2Objetivos específicos:
Obtenção de nanofibras de Policaprolactona pela técnica de eletrofiação.
Obtenção de nanofibras de Gelatina pela técnica de eletrofiação.
Obtenção de nanofibras de Gelatina/Policaprolactona em estrutura casca-núcleo
pela técnica de eletrofiação co-axial.
Caracterização e análise das nanofibras após mudanças nos parâmetros da
solução e de processamento.
Análise da mineralização da superfície das nanofibras com estrutura
casca-núcleo após cobertura por hidroxiapatita.
Avaliação preliminar de citotoxicidade destas nanofibras.
Avaliação precoce de diferenciação angiogênica e osteogênica de células-tronco
3
Influence of solution and processing parameters in
electrospinning of single Poly(
ε
-Caprolactone) (PCL)
nanofibers and co-axial PCL/Gelatin nanofibers
Abstract. In the electrospinning process, polymer nanofibers with submicron-scale
diameters are formed when a droplet of a viscoelastic polymer solution is subjected to a high-voltage electrostatic field. In this paper, we report the experimental work on the electrospinning process in which the influence of different process and solution parameters were evaluated. The effect of the electrospinning solvent on poly(ε -caprolactone) (PCL) fiber morphology was evaluated. The replacement of 2, 2,
2-trifluoroethanol (TFE) with a mixture of acetic acid and formic acid significantly reduced the diameter of the fibers. Solutions of PCL and gelatin in acetic acid/formic
acid were electrospun in fibers by co-axial electrospinning. The ratio of the viscosities
ηcore/ηshell was found to be of critical importance to achieve stable core–shell nanofibers.
3.1Introduction
Electrospinning has been widely used for the fabrication of polymeric nanofibers [1].
The basic electrospinning setup includes a polymer solution or melt reservoir and a
grounded collector with a high-voltage between them. When the voltage is high enough
to overcome the surface tension of the polymer solution/melt, a charged jet is generated
towards the grounded collector and the solvent evaporates/melt solidifies along the jet
to form solid thin fibers [2].
Numerous studies have shown that the optimal electrospinning configuration and
operational conditions differ drastically from one polymer to another, with process
parameters (applied electric field, needle-to-collector distance, flow rate, type of
collector) and solution properties (viscosity, surface tension, conductivity) being the
main factors influencing the transition of a polymer solution into ultrafine fibers [3]. In
this paper, some of these parameters have been explored, particularly the effect of
replacing 2, 2, 2-trifluoroethanol (TFE) by a mixture 1:1 (v/v) of acetic acid and formic
acid in the solution for electrospinning.
Polycaprolactone (PCL) is a polyester with a semicrystalline linear structure and
excellent mechanical strength. It is non-toxic in nature and found to be cyto-compatible
with several body tissues, making it an ideal material for tissue engineering [4]. PCL
degrades, in the first instance, by random chain scission of the ester groups via
hydrolysis [5]. Polymers capable of undergoing hydrolytic degradation initially absorb
water, hydrating the molecular chains. The type of functional group presented along the
length of the polymer chain affects the rate of water absorption, its subsequent
hydrolysis and, ultimately, its rate of degradation. Thus, the hydrophobic nature of the
PCL backbone leads to a much slower degradation than most of the other biodegradable
synthetic polymers. To overcome this shortcoming, PCL-based co-axial nanofibers, in
which a polymer with faster degradation rate is used as either the core or shell of the
In this study, the effects of some parameters involved in the electrospinning of
polycaprolactone nanofibers, as well as of gelatin/polycaprolactone coaxial nanofibers,
on the morphology of the fibers were investigated. Gelatin, a protein derived from
partial hydrolysis of collagen, was chosen because of its biological origin,
biocompatibility, bioresorbability, non-immunogenicity, biodegradability and
3.2Materials and Methods
3.2.1 Materials
The materials used for nanofiber fabrication were poly(ε-caprolactone) (PCL)
(Sigma-Aldrich, St. Louis, MO, USA, Mn = 80,000 g/mol), gelatin powder (type A from
porcine skin, gel strength approx. 300 g Bloom) (Sigma-Aldrich, St. Louis, MO, USA),
2,2,2-trifluoroethanol (TFE) (99%) (Sigma-Aldrich, St. Louis, MO, USA), acetic acid
(98-100%) (Riedel de Haën) and formic acid (99.8%) (Sigma Aldrich). All the
chemicals were used without any further treatment.
3.2.2 Electrospinning of PCL nanofibers
To prepare spinnable solutions, the PCL was dissolved in TFE under stirring for 24 h.
Alternatively, PCL was dissolved in a 1:1 (v/v) mixture of acetic acid and formic acid.
The experimental setup used for electrospinning process consisted of an adjustable DC
power supply (Gamma High Voltage Research, USA), a syringe pump in which the
syringe was connected to a stainless steel needle (D=2 mm) and a static collector
wrapped with aluminum foil. During the electrospinning process, the solution was
ejected from the tip of the positively charged needle to generate ultrafine fibers on the
collector that was connected to the ground with a zero or a negative polarity. Different
PCL concentrations ranging from 10% to 17% w/w were prepared and electrospun at
different feed rates. Electrospinning parameters such as applied voltage and distance
from the tip of the needle to the collector were varied. All experiments were conducted
at room temperature and below 40% relative humidity. After the electrospinning
process, the nanofibrous cloth was carefully peeled off from the collector and stored in a
sealed desiccator for further investigations.
3.2.3 Co-axial electrospinning of PCL/gelatin nanofibers
The two polymer solutions were independently fed through concentrically configured
needles. The outer and inner diameters of the needles were 2.0 and 1.5 mm,
respectively. The solution concentrations of PCL and gelatin in acetic acid/formic acid
1:1 (v/v) were maintained at 15% w/w. Both PCL and gelatin solutions were delivered
collector wrapped with aluminum foil. Both polymer solutions were electrospun by
combining different feed rates. The needle was positively charged with voltages of 25 or
30 kV. The collector was connected to the ground with a zero polarity. The distance
from the tip of the needle to the collector was maintained at 15 cm. All experiments
were conducted at room temperature and below 40% relative humidity. After the
electrospinning process, the nanofibrous membrane was carefully peeled off from the
collector and put into a sealed desiccator to further investigations.
3.2.4 Characterization of electrospun mats
Morphology and diameter of the nanofibers were analyzed by scanning electron
microscopy (SEM) (JEOL JSM 5600, Japan) at an accelerating voltage of 15 kV.
Samples for SEM were mounted on metal stubs and coated with gold using a sputter
coater (JEOL JFC-1200 fine coater, Japan). Non-woven nanofiber mats were analyzed
with 50 individual measurements of nanofiber diameters taken from SEM micrographs
using image analysis software (Image J, National Institutes of Health, USA). This was
repeated for a single electrospun fiber mat fabricated under a single set of constant
conditions to calculate the average nanofiber diameter and standard deviation.
The nanofibrous mats were also characterized by attenuated total reflectance Fourier
transform infrared (ATR-FTIR), using a Golden Gate single reflection ATR in a Bruker
IFS-spectrometer at a resolution of 4 cm−1 and 256 co-added scans. The spectra were
collected between 400 and 4,500 cm-1.
A Physica MCR 301 Rheometer (Anton Paar, Austria) equipped with a cone and plate
(CP 50-1) was used for viscosity measurements. Shear measurements were performed
in a range of shear rates from 0.05 to 90 s−1.
Transmission electron microscopy (TEM) (TOPCON 002B) at 200 kV was used to
observe the core-shell structure of the fibers. The samples for the TEM observation
were prepared by directly depositing the as-spun fibers onto copper grids. The samples
3.3Results and Discussion
3.3.1 Nanofibers of PCL in TFE
Optimization of the electrospinning processing conditions for each particular
polymer/solvent is crucial to obtain electrospun fibers with characteristics that meet
specific application needs [1]. The effect of variations in many parameters, such as the
applied voltage, the solution flow rate and the needle-to-collector distance at different
concentrations on the fiber morphology were analyzed. Table 3.1 shows the various
parameters used and their effect on fiber diameter when TFE was used as solvent for
PCL.
Table 3.1: Electrospinning conditions for PCL solutions in TFE
Sample C%(wt) U (kV) d (cm) FR D (nm) SD (nm)
PCL-12 10 18/0 12 0.8 170 94
PCL-13 10 20/0 12 0.8 140 33
PCL-14 10 22/0 12 0.8 200 94
PCL-15 10 25/0 12 0.8 160 69
PCL-16 10 18/0 15 0.8 300 301
PCL-17 10 20/0 15 0.8 180 147
PCL-18 10 22/0 15 0.8 140 57
PCL-19 10 25/0 15 0.8 160 90
PCL-20 12 18/0 12 0.8 460 36
PCL-21 12 20/0 12 0.8 590 29
PCL-22 12 22/0 12 0.8 610 43
PCL-23 12 25/0 12 0.8 950 350
PCL-24 12 18/0 15 0.8 340 319
PCL-25 12 20/0 15 0.8 200 141
PCL-26 12 22/0 15 0.8 230 156
PCL-27 12 25/0 15 0.8 400 326
PCL-28 14 18/0 12 0.8 690 372
PCL-30 14 22/0 12 0.8 780 322
PCL-31 14 25/0 12 0.8 1120 287
PCL-32 14 18/0 15 0.8 550 352
PCL-33 14 20/0 15 0.8 530 391
PCL-34 14 22/0 15 0.8 610 444
PCL-35 15 15/-15 15 0.8 970 427
PCL-69 7 10/-10 15 0.2 Failed
PCL-70 7 15/-15 15 0.2 100 30
PCL-71 7 20/-20 15 0.2 110 39
PCL-72 7 30/0 15 0.2 110 46
PCL-73 7 15/-20 15 0.2 120 44
PCL-74 12 10/-10 15 0.2 Failed
PCL-75 12 15/-15 15 0.2 450 285
PCL-76 12 20/-20 15 0.2 330 300
PCL-77 12 30/0 15 0.2 430 343
PCL-78 12 15/-20 15 0.2 450 386
PCL-79 15 10/-10 15 0.2 Failed
PCL-80 15 15/-15 15 0.2 870 369
PCL-81 15 20/-20 15 0.2 680 526
PCL-82 15 30/0 15 0.2 560 398
PCL-83 15 15/-20 15 0.2 690 577
PCL-114 7 30/0 15 0.2 Failed
C% (wt): solution concentration of PCL
d (cm): distance from needle to collector
U (kV): Voltage
FR: PCL solution feed rate (mL/h)
D (nm): Average fiber diameter
ATR-FTIR analysis was conducted to characterize the PCL nanofibers. Figure 3.1
shows the FTIR spectra of PCL nanofibrous mats. This includes 2951 cm-1 (asymmetric
CH2 stretching), 2951 / 2865 cm-1 (CH2 stretching), 1722 cm-1 (carbonyl stretching),
1293 cm-1 (C–O and C–C stretching), 1239 cm-1 (asymmetric COC stretching) and 1176
cm-1 (symmetric COC stretching) [8].
Figure 3.1: FTIR spectrum of PCL nanofiber mats. Sample used: PCL-20.
The effect of voltage on electrospun fiber morphology was investigated at different PCL
solution concentrations (Figure 3.2). A crucial element in the electrospinning process is
the voltage applied to the solution. According to Bhardwaj et al. [1], fiber formation
occurs only after the threshold voltage is obtained. This induces the necessary charges
on the solution along with electric field and initiates the electrospinning process.
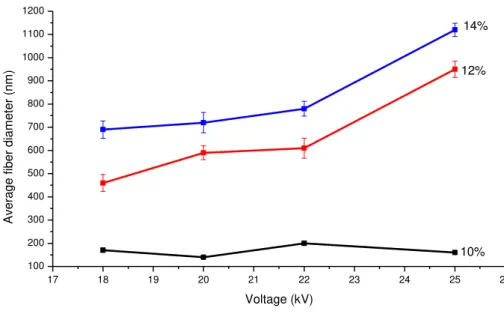
Figure 3.2: Graph showing fiber diameter vs. applied voltage for 10, 12 and 14%
solutions of PCL in TFE. Samples used: PCL-12, PCL-13, PCL-14, PCL-15, PCL-20,
PCL-21, PCL-22, PCL-23, PCL-28, PCL-29, PCL-30 and PCL-31. Distance from
needle to collector of 12 cm and feed rate of 0.8 mL/hr. Error bars are ± standard
deviation of sample population.
Studies have suggested that when higher voltages are applied, there is more polymer
ejection, which facilitatesthe formation of a larger diameter fiber [1]. This effect can be
observed in Figure 3.2, although most of the studies have found the opposite effect [1].
As can be seen in Figure 3.2, the effect of voltage on fiber diameter is more pronounced
at higher concentrations. Thus, the voltage influences the fiber diameter, but the
polymer solution concentration has a much more profound effect on it. Figure 3.3 (a-d)
shows SEM images of some nanofibers used in Figure 3.2, confirming the accentuated
effect of solution concentration on the fiber morphology. The strong dependence of
fiber diameter on material concentration has been reported by a number of studies for
other materials [10-12]. In the electrospinning process, for fiber formation to occur, a
minimum solution concentration is required. It has been found that solutions below 800
cP are too dilute to undergo chain entanglement and readily breakup into droplets [13].
In this case, a mixture of beads and fibers are obtained as observed in Figure 3.3 (a-b).
However, it is difficult for the applied charged potential to overcome the surface tension
of viscous solutions above 4000 cP [13]. In summary, the diameter of the electrospun
17 18 19 20 21 22 23 24 25 26
fibers correlates directly with polymer concentration. The upper and lower limits for
solution concentration vary greatly and depend on the polymer type, its molecular
weight, temperature and the polymer-solvent interaction.
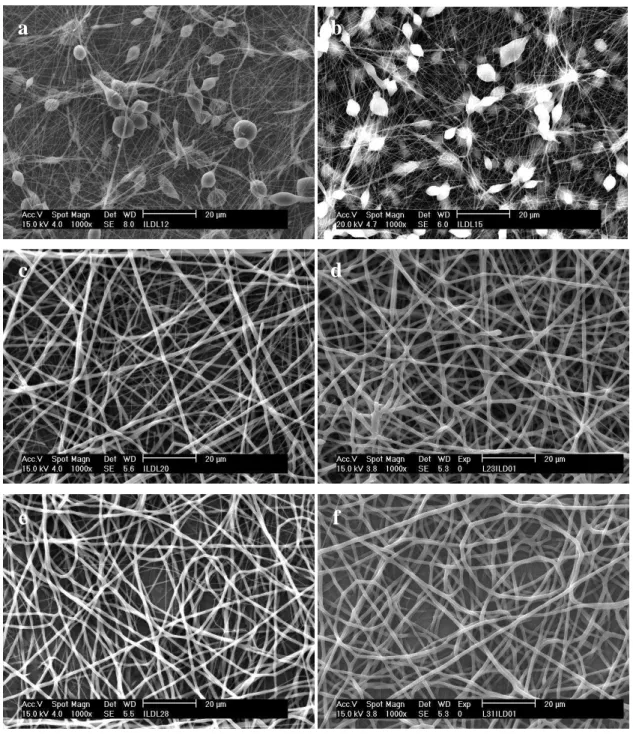
Figure 3.3: MEV of the PCL nanofiber mats: (a) PCL-12; (b) PCL-15; (c) PCL-20; (d)
PCL-23; (e) PCL-28 and (f) PCL-31. (Magnification 103 X)
a
b
c
d
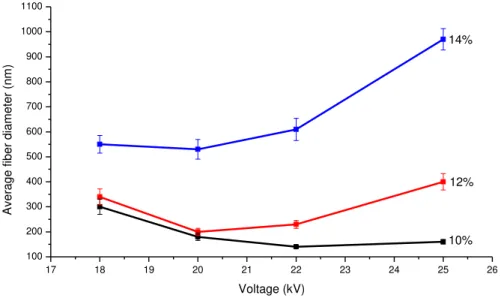
Figure 3.4 shows the effects of voltage on electrospun fiber morphology when the
distance between the tip and the collector was raised to 15 cm at different PCL solution
concentrations. As can be observed in Figure 3.4, in general, the nanofibers
demonstrated the same previous behavior, i.e., larger fibers were formed when the
voltage increased. The SEM micrographs presented in Figure 3.5 present the fibers
when the distance between the tip and the collector was raised to 15 cm, and few
differences from the previous images (Figure 3.3), where the distance was set to 12 cm,
were observed.
Figure 3.4: Graph showing fiber diameter vs. applied voltage for 10, 12 and 14%
solutions of PCL in TFE. Samples used: PCL-16, PCL-17, PCL-18, PCL-19, PCL-24,
PCL-25, PCL-26, PCL-27, PCL-32, PCL-33, PCL-34 and PCL-35. Distance from
needle to collector of 15 cm and feed rate of 0.8 mL/hr. Error bars are ± standard
deviation of sample population.
17 18 19 20 21 22 23 24 25 26
Figure 3.5: MEV of the PCL nanofibers mats: (a) PCL-16; (b) PCL-19; (c) PCL-24; (d)
PCL-27; (e) PCL-32; (f) PCL-35. (Magnification 103 X)
The effect of increasing the distance between the tip and the collector on the
morphology of PCL nanofibers is shown in detail in Figure 3.6. As can be observed in
Figure 3.6, there seems to be a trend of smaller fiber diameters when the distance
between the tip and the collector is raised from 12 cm to 15 cm. In view of this, it is
reasonable to think that thinner fibers are produced using a higher distance, where less
a
b
c
d
solvent remains in the jet and more stretching occurs. However, Dougstani et al. [14] in
their PCL electrospinning experiments with different parameter combinations found that
the mean fiber diameter increased with the distance. According to them, by increasing
the spinning distance, the electric field strength will decrease (E = V/d), resulting in less
acceleration and, hence, less stretching of the jet, leading to thicker fiber formation. It is
likely that the sum of these two opposite effects has an influence on the diameter of the
fibers. However, due to the high sensitivity of the electrospinning process to small
variations, the fiber diameter may be more influenced by one or the other depending on
the experiment. 170 460 690 300 340 550 0 100 200 300 400 500 600 700 800
10 12 14
A v e ra g e f ibe r di a m e te r (nm )
PCL in TFE concentration % (w/w)
Diameter (nm) at 12 cm Diameter (nm) at 15 cm 18/0 140 590 720 180 200 530 0 100 200 300 400 500 600 700 800
10 12 14
A v e ra g e f ibe r di a m e te r (nm )
PCL in TFE concentration % (w/w)
Diameter (nm) at 12 cm Diameter (nm) at 15 cm 20/0
(a)
200 610 780 140 230 610 0 100 200 300 400 500 600 700 800 900
10 12 14
A v e ra g e f ibe r di a m e te r (nm )
PCL in TFE concentration % (w/w)
Diameter (nm) at 12 cm Diameter (nm) at 15 cm
22/0 160 950 1120 160 400 970 0 200 400 600 800 1000 1200 1400
10 12 14
A v e ra g e f ibe r di a m e te r (nm )
PCL in TFE concentration % (w/w)
Diameter (nm) at 12 cm Diameter (nm) at 15 cm
25/0
Figure 3.6: Comparison of the fiber diameter using distance between the tip and the
collector of 12 cm (left) and 15 cm (right) for voltages of: (a) 18/0, (b) 20/0, (c) 22/0
and (d) 25/0 kV. Samples used: 18/0: PCL-12, PCL-20, PCL-28 (12 cm) and PCL-16,
24, 32 (15 cm); 20/0: 13, 21, 29 (12 cm) and 17,
PCL-25, PCL-33 (15 cm); 22/0: PCL-14, PCL-22, PCL-30 (12 cm) and PCL-18, PCL-26,
34 (15 cm); 25/0: 15, 23, 31 (12 cm) and 19, 27,
PCL-35 (15 cm).
In fact, it is very difficult to establish a reliable relation between the various
electrospinning parameters and fiber diameter. An exception is the polymer solution
concentration, which presents a direct response to the fiber diameter. Figure 3.7, for
example, examines the behavior of the fiber diameter with increasing solution
concentration for two different voltages. An opposite result to those of Figure 3.2 and
Figure 3.4 is present in Figure 3.7. With these sets of samples, the mean fiber diameter
decreased with an increase in voltage. As aforementioned, there are two factors (c)
governing the relation between fiber diameter and voltage [1]. In the case of Figure 3.7,
the predominant factor seems to be the increase of electric field strength and larger
electrostatic stretching forces due to the increasing applied voltage that caused the jet to
accelerate more in the electric field, thereby favoring thinner fiber formation.
Figure 3.7: Graph showing average fiber diameter vs. solution concentration of PCL in
TFE. Samples used: (a) 70, 75 and 80; (b) 71, 76 and
PCL-81; (c) PCL-35.
Figure 3.7 also shows that when the voltage is kept constant, the fiber diameter tends to
increase with increase in the flow rate. This result is in agreement with Zhou et al. [15],
who reported that the PCL single-fiber diameter increased from approximately 27 µm at
0.03 mL h-1 to 80 µm at 0.18 mL h-1. The authors attributed this result to the
deterioration of the stability of the jet due to solution dripping, which was noted at
higher flow rates.
3.3.2. Nanofibers of PCL in acetic acid/formic acid (1:1)
In this work, a 1:1 (v/v) combination of acetic acid and formic acid was used as an
alternative solvent to TFE. Among the solvents used for PCL electrospinning, acetic
acid and formic acid are the least toxic [16]. Table 3.2 shows the various parameters
used and their effect on the fiber diameter when this solvent system was used for PCL.
6 7 8 9 10 11 12 13 14 15 16
0 100 200 300 400 500 600 700 800 900
1000 (c)15/-15 kV
0.8 mL/hr (b)20/-20 kV 0.2 mL/hr (a)15/-15 kV 0.2 mL/hr A ve ra g e f ibe r d iam e te r ( n m )
The average fiber diameter plotted versus PCL solution concentration in this solvent
system can be seen in Figure 3.8.
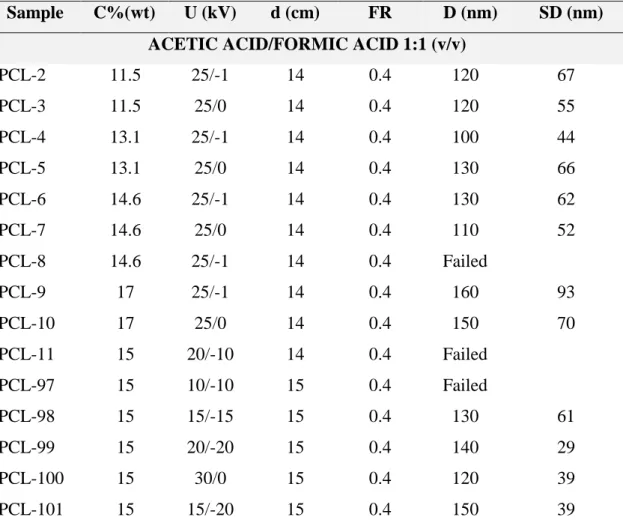
Table 3.2: Electrospinning conditions for PCL solutions in acetic acid/formic acid 1:1 (v/v)
Sample C%(wt) U (kV) d (cm) FR D (nm) SD (nm)
ACETIC ACID/FORMIC ACID 1:1 (v/v)
PCL-2 11.5 25/-1 14 0.4 120 67
PCL-3 11.5 25/0 14 0.4 120 55
PCL-4 13.1 25/-1 14 0.4 100 44
PCL-5 13.1 25/0 14 0.4 130 66
PCL-6 14.6 25/-1 14 0.4 130 62
PCL-7 14.6 25/0 14 0.4 110 52
PCL-8 14.6 25/-1 14 0.4 Failed
PCL-9 17 25/-1 14 0.4 160 93
PCL-10 17 25/0 14 0.4 150 70
PCL-11 15 20/-10 14 0.4 Failed
PCL-97 15 10/-10 15 0.4 Failed
PCL-98 15 15/-15 15 0.4 130 61
PCL-99 15 20/-20 15 0.4 140 29
PCL-100 15 30/0 15 0.4 120 39
PCL-101 15 15/-20 15 0.4 150 39
C% (wt): solution concentration of PCL
d (cm): distance from needle to collector
U (kV): Voltage
FR: PCL solution feed rate (mL/h)
D (nm): Average fiber diameter
Figure 3.8: Graph showing fiber diameter vs. solution concentration of PCL in acetic
acid/formic acid 1:1 (% v/v). Samples used: PCL-3, PCL-5, PCL-7, and PCL-10.
Applied voltage of 25/0 KV, distance from needle to collector of 14 cm and feed rate of
0.4 mL/hr. Error bars are ± standard deviation of sample population.
As can be seen in Figure 3.8, with the exception of the point corresponding to the
concentration of 14.6%, a trend of increase in the diameter with increase in the
concentration of solution was maintained. Compared to TFE, the use of such acids as
solvent gave rise to smaller fiber diameters. According to Raghavan et al. [17], the
solution parameters have the most significant influence on the electrospinning process
and electrospun fiber morphology. The viscosity of the solution and its electrical
characteristics determine the extent of the elongation of the solution. This, in turn, has
an effect on the diameter of the electrospun fiber. Table 3.3 shows the values of
dielectric constant at 25 0C for some solvents [18].
11 12 13 14 15 16 17
110 120 130 140 150 160 Av e ra g e f ib e r d ia m e te r (n m )
Table 3.3: Dielectric constant (25 ºC) for some PCL electrospinning solvents
Solvent Dielectric constant (ε)
Water 87.9
Acetic acid 6.15
Acetone 20.7
N,N-Dimethylformamide (DMF) 36.7
Formic acid 57.5
Methanol 32.7
Methylene chloride (MC) 9.1
Tetrahydrofuran (THF) 7.58
Toluene 2.4
2,2,2-Trifluoroethanol (TFE) 8.55
The behavior showed in Figure 3.8 coincides with the fact that the dielectric constant of
formic acid is much higher than that of TFE, as shown in Table 3.3. In poly(ethylene
oxide) electrospinning, for example, the higher is the dielectric constant of the solvent,
the lower is the fiber diameter [17]. Sawada et al. [19] reported that the average
diameter of the fibers electrospun from PVA aqueous solution was 580 ± 38 nm, which
increased up to 1230 ± 254 nm when using 10 wt% DMF. However, the productivity
defined as ([1 - (amount of polymer which did not come in contact with the collector) /
(amount of polymer ejected from the needle for 30 min)] x 100) of electrospun PVA
fibers increased from 15 to 92% by increasing the content of DMF from 0 to 10 wt%.
Lee et al. [20] have studied the effect of dielectric constant and electrical conductivity
of solution on PCL electrospinning. They found that methylene chloride (MC), which
has intermediate dielectric constant, was a good solvent for PCL but produced large
fiber diameter. Although N, N-dimethylformamide (DMF) is not a solvent for PCL, it
has a high dielectric constant and was used for improving electrospinning process.
According to them, for the MC/DMF solvent systems, as the DMF volume fraction
increased, solution electrical conductivity increased and the diameter of electrospun
PCL fibers decreased conspicuously. Toluene reported as a poor solvent for PCL and
with low dielectric constant did not impart the same effect. For MC/toluene systems,
solution conductivity did not change as toluene increased. The authors interpreted that
When non-conductive polymers such as PCL are used for electrospinning, the charges
are solely accommodated for by the volatile solvent [12]. Therefore, a polymer solution
with higher electrical conductivity would carry more charge, leading to a greater tensile
force, which could lead to an increase in the stretching and splitting of the jet, resulting
in a thinner fiber and broader diameter distribution [21]. In view of this one could
suppose that the high dielectric constant of formic acid along with the polyelectrolyte
character of the acids is responsible for thinner diameter of the fibers when compared
with TFE.
Luong-Van et al. [22] found that the use of methanol, a poor solvent for PCL, improves
the conductance of the polymer solution, which in turn affects the fiber diameter.
According to them, the conductivity of the spinning solution can be altered by the
addition of filler molecules such as ionic salts and drugs. The addition of salts (e.g.,
NaCl and KH2PO4) to polymer solutions have been found to affect the fiber diameter,
with the presence of charged ions leading to fibers with substantially decreased diameter
and with ions of small atomic radii (such as Na+) having the larger effect. This
observation was explained by the presence of the highly charged molecules in the
spinning solution, resulting in an increase in the charge density on the surface of the
ejected polymer jet. The increase in charge density imposes greater elongation and
thinning forces on the jet as it travels through the electric field, resulting in fibers of
smaller diameter.
Moghe et al. [23] describe a method to improve the electrospinnability of PCL to
produce uniform ultra-fine nanofibers with narrow fiber diameter distribution. As
reported by the authors, this was achieved by using a new solvent system that increases
the conductivity of the solution. For this purpose, they used a fugitive salt that
evaporates along with the solvent during electrospinning. Pyridine, an organic base
compound, was used as an additive to accomplish this goal. According to them, when
added to a solution of PCL in glacial acetic acid, pyridine is protonated and forms
pyridinium acetate that evaporates during the electrospinning process. This results in
pure polymeric nanofibers of smaller dimensions and superior uniformity than are
3.3.3. Co-axial nanofibers of PCL/gelatin in acetic acid/formic acid (1:1)
Preliminary studies have shown that PCL/gelatin co-axial nanofibers provide a optimal
solution for overcoming the shortcomings of natural and synthetic polymers, resulting
in a new biomaterial with good biocompatibility and improved mechanical, physical
and chemical properties [8, 24, 25]. The purpose of this work is to obtain PCL/gelatin
co-axial nanofibers in the solvent system acetic acid/ formic acid 1:1 (v/v).
Because PCL and gelatin in solution have a threshold time for electrospinning before
degradation, the rheological behavior of PCL and gelatin solution in these acids was
initially studied. Rheograms for PCL and gelatin (15% wt) after different times are
shown in Figure 3.9 and Figure 3.10, respectively.
Figure 3.9: Rheograms for PCL solution (15% wt) after different times.
0 10 20 30 40 50 60 70
0 20 40 60 80 100 120
Sh e a r st re ss ( P a )
Shear rate (s-1)
Shear stress as a function of shear rate for PCL dissolved after different times in acid
Figure 3.10: Rheograms for gelatin solution (15% wt) after different times.
Both polymer solutions presented rheological behavior close to Newtonian fluids, a
slight shear-thinning was observed suggesting pseudoplastic behavior. Marcotte et al.
[26] have shown that aqueous gelatin (2%) is Newtonian at most temperatures.
According to them, just above the setting point, the viscosity becomes markedly time
dependent, owing to the degree of aggregation taking place, which is accentuated by
higher concentrations and high molecular weights.
The reduction in apparent viscosity with increasing shear rate is an alternative way to
depict pseudoplastic behavior of the polymer solutions as shown in Figures 3.11, 3.12
and 3.13.
0 5 10 15 20 25
0 20 40 60 80 100 120
Sh
e
a
r
st
re
ss
(
P
a
)
Shear rate (s-1)
Shear stress as a function of shear rate for gelatine dissolved after different times in acid
1h
3h
6h
24h
48h
72h
Figure 3.11: Viscosity for gelatin solution (15% wt) after 1 hour.
Figure 3.12: Viscosity/shear rate relationship for PCL solution (15% wt) after different times. 0 0,05 0,1 0,15 0,2 0,25 0,3 0 5 10 15 20 25
0 20 40 60 80 100 120
V is cos it y ( P a .s ) S he a r st re ss ( P a )
Shear rate (s-1)
Shear stress Gelatine after 1h Viscosity Gelatine after 1h
0 0,5 1 1,5 2 2,5
0 20 40 60 80 100 120
V is co si ty ( P a .s )
Shear rate (s-1)
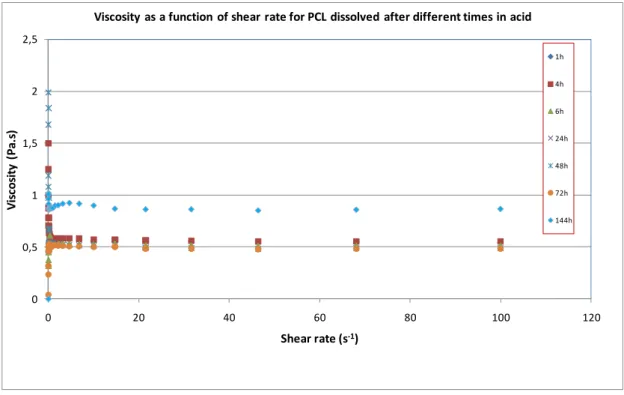
Viscosity as a function of shear rate for PCL dissolved after different times in acid
Figure 3.13: Viscosity/shear rate relationship for gelatin solution (15% wt) after
different times.
The behavior of viscosity ( ) with time is presented for both gelatin and PCL solution in Figure 3.14. As can be seen in Figure 3.14, for gelatin solution, a slight viscosity
thinning with time occurred, whereas for PCL solution, the viscosity was maintained
constant over time, except after 144 h, when an accentuated increase in viscosity was
noted. This was probably due to solvent evaporation. The results in Figure 3.14 proved
that minor degradation of the polymers in solution occurred at least for the first 48 hours
after polymer dissolution.
0 0,1 0,2 0,3 0,4 0,5 0,6 0,7
0 20 40 60 80 100 120
V
is
co
si
ty
(
P
a
.s
)
Shear rate (s-1)
Viscosity as a function of shear rate for gelatine dissolved after different times in acid
1h
3h
6h
24h
48h
72h
Figure 3.14: Viscosity versus time for gelatin and PCL solution (15% wt).
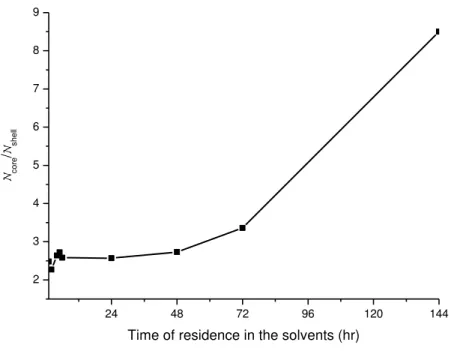
According to Tiwari et al [27], in the case of core-shell electrospinning, the ratio
core/ shell is of critical importance to obtain stable core-shell electrospinning, in addition
to the individual viscosity requirements of core and shell solutions for electrospinning.
For the shell solutions consisting of PLGA 80/20 (in 80:20 chloroform and DMF) and PVA solutions (in water) used in the core, the workable range is core/ shell≥ 0.55. This
range may vary for different polymer pairs, solvent types and interactions between core
and shell solutions. Figure 3.15 shows the graph of the present system (PCL/gelatin 15% wt in acetic acid/formic acid 1:1), in which core/ shell values were plotted against
the time that polymer and solvent remained in contact before electrospinning. Adapting
the Tiwari et al theory to the time of contact between the polymer and solvent to
produce the solution for electrospinning, we can conclude that there should be a
threshold time of polymer/solvent contact that, once exceeded, would result in
unspinnable solutions. As can be seen in Figure 3.15, after 48 hours of contact between
polymer and solvents, the conditions of spinnability were probably no longer suitable due to the high core/ shell.
0 0,1 0,2 0,3 0,4 0,5 0,6 0,7 0,8 0,9 1
0 20 40 60 80 100 120 140 160
V is co si ty ( P a .s ) Time (h) Viscosity (Pa.s) in acid at 100s-1
Figure 3.15: Time of residence in the solvents versus relative viscosities of the core and
shell solutions.
Table 3.4 shows the various parameters used and their effect on fiber diameter when
acid acetic/acid formic (1:1) was used as the solvent system for producing PCL/gelatin
co-axial nanofibers. As can be seen in Table 3.4, the ratio of flow rates between the core
and shell solutions profoundly affected the co-axial electrospinning. Nguyen et al. [28]
focused on fabrication and characterization of porous core/shell structured composite
nanofibers with a core of blended salicylic acid (SA) and poly(ethylene glycol) (PEG)
and a shell of poly(lactic acid) (PLA). According to them, the stable core/shell structure
of composite nanofibers is determined by the stability of the compound jet of two
liquids, which in turn is strongly affected by the feed rates and applied voltage, among
others parameters. Nanofibers obtained at core feed rates of 0.1–0.2 mL/h formed the
core/shell structure, but when the core feed rate was increased to 0.4 mL/h, the PLA
solution was insufficient for encapsulating core solutions. Chakraborty et al [13] stated
that in this case, the resulting core/shell solutions form pendant drops at the needle,
projecting only droplets under electrical gradient.
24 48 72 96 120 144
2 3 4 5 6 7 8 9
N c
o
re
/
N s
h
e
ll
Table 3.2: Electrospinning conditions for co-axial fibers PCL/gelatin
Sample U (kV) FR1 FR2 D (nm) SD (nm)
S1=S2= ACETIC ACID/FORMIC ACID 1:1 (v/v)
PCL/G-116 30/0 0.3 0.13 190 60
PCL/G-117 30/0 0.2 0.2 400 144
PCL/G-118 30/0 0.2 0.3 350 72
PCL/G-119 25/0 0.3 0.13 270 117
PCL/G-120 25/0 0.2 0.2 Failed
PCL/G-121 25/0 0.2 0.3 180 54
PCL/G-132 30/0 0.6 0.6 Failed
PCL/G-133 30/0 0.3 0.3 Failed
PCL/G-134 30/0 0.8 0.8 510 66
PCL/G-135 30/0 0.9 0.9 510 117
PCL/G-136 30/0 0.7 0.8 360 85
PCL/G-137 30/0 0.7 0.7 325 84
Solution concentration of PCL and gelatin: 15% (w/w)
Distance from needle to collector of 15 cm
U (kV): Voltage
FR1: PCL solution feed rate
FR2: Gelatin solution feed rate
D (nm): Average fiber diameter
SD (nm): Standard deviation
Figures 3.16 and 3.17 show SEM and TEM micrographs of co-axial PCL/gelatin
Figure 3.16: MEV of co-axial PCL/gelatin nanofibers in acetic acid/formic acid (1:1
v/v): The arrow highlights the PCL core of co-axial fiber. Sample used PCL/G-134.
(Magnifications: (a) 103 X and (b) 5.103 X)
a
Figure 3.17: MET of co-axial PCL/gelatin nanofibers in acetic acid/formic acid (1:1
v/v): The arrow highlights the PCL core of co-axial fiber. Sample used PCL/G-134.
As can be seen from Figures 3.16 and 3.17, the co-axial morphology is well
3.4Conclusions
It was shown through the electrospinning of PCL solution that such a process is
governed by various parameters. Replacement of the solvent 2, 2, 2-trifluoroethanol
(TFE) with a mixture 1:1 (v/v) of acetic acid and formic acid led to fibers with reduced
diameter. PCL and gelatin solutions with a mixture 1:1 (v/v) of acetic acid and formic
acid as solvent were also co-electrospun. In the case of core-shell electrospinning, the ratio core/ shell is of critical importance in enabling stable core-shell electrospinning.
PCL and gelatin in acid solution are to achieve a required threshold time for