Differential Network Analysis with Multiply
Imputed Lipidomic Data
Maiju Kujala1¤*, Jaakko Nevalainen2, Winfried März3,4,5, Reijo Laaksonen6,7, Susmita Datta8
1Department of Mathematics and Statistics, University of Turku, Turku, Finland,2School of Health Sciences, University of Tampere, Tampere, Finland,3Mannheim Institute of Public Health, Medical Faculty Mannheim, University of Heidelberg, Heidelberg, Germany,4Synlab Academy, Synlab Services GmbH, Mannheim, Germany,5Clinical Institute of Medical and Clinical Laboratory Diagnostics, Medical University of Graz, Graz, Austria,6Zora Biosciences, Espoo, Finland,7Tampere University Hospital, Tampere, Finland, 8Department of Bioinformatics and Biostatistics, University of Louisville, Louisville, Kentucky, USA
¤ Current Address: Dept. of Mathematics and Statistics, Assistentinkatu 7, 20014 University of Turku, Finland
Abstract
The importance of lipids for cell function and health has been widely recognized,e.g., a
dis-order in the lipid composition of cells has been related to atherosclerosis caused cardiovas-cular disease (CVD). Lipidomics analyses are characterized by large yet not a huge number of mutually correlated variables measured and their associations to outcomes are potential-ly of a complex nature. Differential network anapotential-lysis provides a formal statistical method ca-pable of inferential analysis to examine differences in network structures of the lipids under two biological conditions. It also guides us to identify potential relationships requiring further biological investigation. We provide a recipe to conduct permutation test on association scores resulted from partial least square regression with multiple imputed lipidomic data from the LUdwigshafen RIsk and Cardiovascular Health (LURIC) study, particularly paying attention to the left-censored missing values typical for a wide range of data sets in life sci-ences. Left-censored missing values are low-level concentrations that are known to exist somewhere between zero and a lower limit of quantification. To make full use of the LURIC data with the missing values, we utilize state of the art multiple imputation techniques and propose solutions to the challenges that incomplete data sets bring to differential network analysis. The customized network analysis helps us to understand the complexities of the underlying biological processes by identifying lipids and lipid classes that interact with each other, and by recognizing the most important differentially expressed lipids between two subgroups of coronary artery disease (CAD) patients, the patients that had a fatal CVD event and the ones who remained stable during two year follow-up.
a11111
OPEN ACCESS
Citation:Kujala M, Nevalainen J, März W, Laaksonen R, Datta S (2015) Differential Network Analysis with Multiply Imputed Lipidomic Data. PLoS ONE 10(3): e0121449. doi:10.1371/journal. pone.0121449
Academic Editor:Yu Wang, The University of Hong Kong, HONG KONG
Received:September 8, 2014
Accepted:January 31, 2015
Published:March 30, 2015
Copyright:© 2015 Kujala et al. This is an open access article distributed under the terms of the
Creative Commons Attribution License, which permits unrestricted use, distribution, and reproduction in any medium, provided the original author and source are credited.
Data Availability Statement:Data are owned by a third party and are available upon request from the Ludwigshafen RIsk and Cardiovascular Health (LURIC) via Dr. Winfried Maerz (winfried. [email protected]) and requests about lipidomic data can be made to PhD, eMBA, Chief Executive Officer of the Zora Biosciences Reini Hurme (reini. [email protected]).
Funding:This research work was partially supported by National Institutes of Health grant CA 170091–
Introduction
Lipids are important for cell function and health, and they have been proposed to be as impor-tant for life as proteins and genes. In terms of mass, lipids are the most imporimpor-tant constituent
of the human brain, and the second most important of all other soft tissues [1]. Lipid
metabo-lism is related as well with several human diseases, such as diabetes, obesity, cancer, and Alz-heimer’s disease [2]. Currently, nearly 10 000 different lipids are indexed in the most
comprehensive lipid database, LIPID MAPS [3]. Individual lipid species are divided into lipid
classes sharing similar structures and biological functions. Proteins and genes are known to have very specific functions. Lipids as structure builders and fat depots are, however, variable, divergent, and versatile. As such, there are no genes coding for lipids. We obtain lipids for ex-ample from our diet and they are modified and further modified by gene coded enzymes.
Disorder in the lipid composition of cells has been related to cardiovascular disease (CVD) due to atherosclerosis, the leading cause of death in the United States and most developed
Western countries [4]. Early preventive measures depend on accurate identification of patients
with an increased risk of CVD. Even though serum total cholesterol and low-density lipopro-tein (LDL) cholesterol significantly associate with atherosclerosis and have traditionally been
used as a measure of risk, they fail to recognize a substantial proportion of risk patients [5].
Thus, there is a need for more precise understanding of the roles of different lipid species in atherosclerosis beyond LDL cholesterol and HDL (high-density lipoprotein) cholesterol. To
meet this goal, we analyze lipidomic data from the LURIC [6] study which provides a
well-de-fined resource for the study of prognostic importance of CVD related common genetic variants and plasma biomarkers. LURIC database contains full GWAS data and over 2000 biochemical variables in addition to full clinical patient characteristics.
The earlier lipidomic findings based partly on the serum samples of the selected LURIC
sub-jects [7] indicate that alterations in sphingolipid (SL) metabolism leading to changes in the
fatty acid chain length of ceramides are highly relevant to CV risk. The biochemistry of sphin-golipids is currently quite well known, including the elongation processes that leads to mole-cules of different fatty acid chain lengths. Mathematical models describing the functions and
dynamics of the of various metabolic pathways are developing fast [8], but is not easily applied
to the sphingolipidome, as the pathways are complex and are not yet completely understood
[9]. However, several efforts have already provided better understanding about how
sphingoli-pids are made and function, and also helped interpreting and predicting the outcomes of, for
example, genetic mutations [10–12]. On the other hand, the current knowledge covers only the
main components of SL metabolism as it has recently been recognized that SL synthesis is very complex, and that each class of SLs contains many different closely related molecular species
[13]. It has been so far difficult to map with precision how SL metabolism achieves such level
of diversity. It is obvious that there are still central enzymatic steps to be described and metabo-lites to be identified in order to better understand the behavior of SL metabolism in health and disease. For instance, to identify enzymatic activities responsible for the alterations in SL me-tabolism linked to cardiovascular diseases will still require significant technological advances. We believe that improved data analysis tools could help to understand the complexities of SL metabolism, which may play a fundamental role not only in CVD pathophysiology, but also in
many other diseases including for instance diabetes [14] and central nervous system diseases
[15]. SL metabolism is an obvious target for drug discovery and the identification of regulatory
steps and pathways for target discovery programs is important.
With the recent growth of mass spectral techniques for lipid profiling and available lipido-mic high throughput data, the analysis of lipidolipido-mic networks has gained significant interest [16], [17], [18], [19]. Biological association or interaction networks provide information about
data collection and analysis, decision to publish, or preparation of the manuscript.
the essential processes behind different conditions, and help to recognize the important distin-guishing lipids, for example for therapeutic purposes. Here, between-lipid interaction (or asso-ciation) describes the similarity of the concentration levels of two lipids and how they change together. The core of a network analysis is a defined connectivity score that represents the strength of the association or interaction between two particles. At its simplest, the connectivity can be represented with a correlation coefficient. Indeed, previous work on lipidomic networks
by Yetukuri et al. [20] is based on between-lipid correlations.
Here we adopt a model based approach to identify important connections between lipids. Fitting a regression model for each lipid as response at a time, with all the other lipids as pre-dictors, enables us to adjust for additional covariates and seek interactions. High throughput data, such as lipidomic data, includes often large number of variables measured in relatively few patients. Common statistical techniques cannot be directly used in such situations, for ex-ample, an attempt to fit an ordinary least squares regression model on a data set with more var-iables than observations would lead to a saturated model. In such cases, one possible solution
could be the stepwise regression. Datta [21] showed that in a microarray data a latent variable
method, partial least squares (PLS) regression, is a powerful tool for exploring relationships which may translate into biologically meaningful interactions. Later, Pihur, Datta, and Datta
[22] proposed a more systematic approach to the PLS-based network construction and showed
that PLS based networks outperformed those constructed with simple correlations or partial correlations. Finally Gill, Datta, and Datta ([23]) constructed formal statistical tests on differ-ential connectivities and modular structures based on the PLS-scores. This so called differdiffer-ential network analysis is a method to examine differences in network structures under two
biological conditions.
Previous work on differential network analysis was based on a complete case analysis, that is, including only those patients for whom all measurements have been detected. This can lead to a great reduction in the number of patients included, and hence to a serious loss of precision. Due to denoising, left-censored values are a commonplace phenomena for proteomic, metabo-lomic, and lipidomic data from mass spectrometry platforms. They are low-level concentra-tions that are considered too imprecise to be reported as a single number with values known to be somewhere between zero and a known lower limit of quantification (LLOQ). Thus, LLOQ is set to filter random noise from the measurements. Finding a proper way to handle the left-cen-sored values is crucial. For example, the LURIC data set used in this analysis does not include any patients with fully detected lipid profiles and majority of the missing lipid concentrations are caused by left-censoring. If patients with left censored values are systematically removed
from the analysis—as they would in the complete case analysis—the analysis can be severely
bi-ased. Thus, exclusion of the left-censored values produces an upward bias in subsequent mea-sures of location, such as means and medians. Commonly used methods to deal with values below quantification limits are to substitute a fraction of the quantification limit or zero for each non-detect, or single imputation. It is well known that even when there is no systematic pattern of missing values, a complete case analysis accompanied by substitution methods or single imputation is typically biased and the inference invalid. Only the multiple imputation (MI) method, where each missing value is imputed with a set of plausible values, incorporates the uncertainty among imputations into the final inferential procedures.
structures of two subgroups of patients from LURIC data, cases and controls, and identify lip-ids that are related to increased risk of CVD related death.
In the Materials and methods section, we describe the study design, data collection, and the missing value patterns. We propose particular missing data imputation methodology as well as review the methods for construction of the connectivity scores and corresponding networks along with the hypothesis tests to investigate the differences in the network topology between two networks. Results section provides the implementation of the differential network analysis for the multiple imputed LURIC lipidomics data and we conclude the paper with a discussion on the methods and results.
Materials and Methods
Ethics statement
The LURIC study was approved by the ethics review committee at the“Landesärztekammer
Rheinland-Pfalz”.
Study design
The LURIC study is an ongoing prospective study enrolling currently more than 3000 patients
with German ancestry [6]. Patients were recruited between years 1997 and 2002 after arriving
to one of the research hospitals due to symptoms referring to a CVD. After obtaining a written consent, baseline examination was performed including an individual and family history ques-tionnaire and extensive sampling of fasted venous blood. The coronary artery status was evalu-ated by angiography.
Lipidomic profiles were measured from a retrospectively defined subgroup ofn= 445
males, with 258 cases and 187 controls. Detailed description of this lipidomic study, lipid
ex-traction and the mass spectrometry analyses are given in [7]. The main interest lies in
compar-ing the interrelationship of the concentration levels among various lipids between the patients that had a CVD event leading to death during the first three years follow-up (cases) and the ones who survived at least three years (controls). Cardiovascular deaths were defined as sudden cardiac death, fatal myocardial infarction, death due to congestive heart failure, death immedi-ately after intervention to treat CAD, fatal stroke, and other causes of deaths due to cardiac dis-ease. Frequency matching was done to ensure that the case and control groups had the same distributions over strata defined by age, body mass index, statin use and smoking. The number of controls remained smaller than number of cases due to the exclusion of numerous stable dia-betic patients having pre-study events indicating plaque vulnerability.
Data access requests about LURIC data [6] should be addressed to Prof. Dr. Winfried März
([email protected]) and requests about lipidomic data [7] to Dr. Reini Hurme (reini. [email protected]).
Data acquisition
molecule masses into concentrations. The concentrations of molecular lipids are presented as
μM for serum.
Quality control samples were utilized to monitor the overall quality of the lipid extraction and mass spectrometry analyses by removing technical outliers and lipid species that were de-tected below the lipid class based LLOQ.
Missing values and multiple imputation by chained equations
In general, we observe a vector of binary responsesy= (y1,. . .,yn)0indicating whether
the patient was a case or a control, and the log-transformed lipid concentrationsX=
(x1,. . .,xn) of thenpatients. Letxijbe the (log-transformed) concentration of the lipidjfor
patienti(i= 1,. . .,n;j= 1,. . .,p). Typically, a substantial number ofxijare not detected.
Letxobsandxmisdenote the observed and the missing elements inx, respectively.
In this context, there are two types of missingness. First, in the presence of an assigned
LLOQ, denoted by (say)lj, we have values belowljthat are left-censored, also known as
non-de-tects. As LLOQ is set for each platform, it can vary between different lipid species. Another type of missing values yields due to the elimination of observations not fulfilling the quality control standards. It is reasonable to regard these to be missing completely at random. These two types of missing values and their characteristics are taken into account in the imputation algorithm by imputing them in two different ways, as described in the next section.
MI is a statistical technique for handling missing data and its theoretical foundation is well established. MI is widely used with various“omics”-data sets [24–28]. The key idea is to use the conditional distribution of the observed data to generate a set of plausible imputations for the
missing data. In practice, the draws are based on an appropriate posterior distribution [29].
Im-putations are repeatedMtimes, creating multiple data sets which are analysed individually as if
they were complete. Thus, we obtain a set of parameter estimates. Finally, the results are com-bined across all multiply imputed data sets by averaging them, and the standard errors of the estimates are computed as a combination of within-imputation and between-imputation
vari-ances, by so-called Rubin’s rules [29]. These rules incorporate the imputation related
uncer-tainty into the analysis.
From now on, we will omit the indexifor the ease of notation. The construction of an
ap-propriate imputation distribution is critical. Accordingly, an apap-propriate imputation model needs to be specified. In terms of the general notation, this is given by
fðxmisjxobs;y;yÞ:
Here,θrepresents a vector of the regression coefficient parameters consisting of the
inter-cept term and the slope parameters for the other lipids, case/control status and the clinical co-variates. Typically, this will be a multivariate regression model specifying the dependence of the conditional distribution of the missing data on the observed data. It is convenient to con-struct this joint distribution indirectly through a set of univariate conditional regressions, once for each incomplete variable. The choice of the model is flexible depending on the type of the variable to be imputed, e.g. linear regression for continuous variables, and logistic regression for binary variables. This procedure is known as sequential regression imputation strategy, multiple imputation by chained equations (MICE), also known as fully conditional specifica-tion [30], [31].
case/control status of the patient and the clinical covariates). Finally, the missing values in the dependent variable are replaced with draws from predictive distribution given by the regression model. The whole cycle going through all the variables including missing values, with the
im-putations being updated at each round, is repeated until approximate convergence [30], [32].
As the left censored missing values can be distinguished from the values that are missing
completely at random, and the LLOQljis registered, it is essential to incorporate this
knowl-edge into the imputation model. In practice, this brings one additional condition to the imputa-tion algorithm. The imputaimputa-tion is carried out using an acceptance-rejecimputa-tion sampling
principle: for left-censored values, draws from the conditional distribution are accepted only if they fall below the LLOQ. If a candidate value does not meet this condition, it is rejected and a new candidate is drawn sufficiently many times until acceptance. In other words, imputations for left censored values are sampled from the left tail of the appropriate conditional distribu-tion. For the values missing completely at random, all draws are accepted.
The multiple imputations were performed with R-packagemice[33]. It is generally believed
that it is safer to overfit an imputation model (include too many variables in the model) than to underfit (omit an important variable) [34], [35]. For this reason, in addition to all detected lip-ids, information about the case/control status of the patients, age, body mass index, smoking, number of myocardial infarctions, LDL and HDL cholesterol values, total cholesterol, triglycer-ides, apolipoprotein A-I, C-reactive protein, apolipoprotein B, statin use, lipid lowering thera-py, non-statin lipid-lowering treatment, and type II diabetes mellitus was included in the fully conditional specification. The LLOQ is assumed to be known so it does not need to
be estimated.
Stacking the multiple imputed data sets
The differential network analysis can be challenging in the presence of missing values.
Al-though MI solves the missing data problem, how to combine the results fromMindividually
analysed MI data sets remains unclear, as different imputations may result in different net-works. For the purposes of differential network analysis, we applied a stacking-method
pro-posed by Wood et al. [36]. Instead of runningMindividual analyses, we analyse one large data
set withMnrows, resulting from stacking theMmultiple imputed data sets. This results in
each patient being repeatedMtimes in the stacked data set.
For the purposes of the network analysis, the stacked data set is centered for mean zero and scaled for unit variance. Stacking does not affect the sample mean, but decreases the sample variance. For centered data, the standard deviation is
s2
¼ 1
n 1
Xn
i¼1
x2 ij:
If we stack the observationsMtimes, the sample standard deviation of the same variable from
the stacked data is
s2
stack¼
M
Mn 1
Xn
i¼1
x2 i ¼
n 1
n 1
M
s2 :
Consequently, the sample variance obtained from the stacked data can be corrected by
multi-plying it byðn 1
Reconstructing a lipidomic association network using partial least
squares based connectivity scores
The core of the network analysis is a connectivity score,^s
jkbetween the lipidsjandk, which
represents the strength of the association or interaction between two particles. As proposed by
Pihur, Datta, and Datta [22], PLS based connectivity scores are achieved by fittingpPLS
mod-els such that each lipid at a time is predicted with the remainingp−1 lipids. We also adjusted
our models for additional covariates including age, body mass index, use of statins and
smok-ing. Different steps of PLS include first computing user selectable numberv<Northogonal
la-tent factorstðj‘Þfrom the data, and then fitting a linear model
xj ¼
Xv
‘¼1
b‘tðj‘Þþ:
We have usedv= 3 latent variables throughout the analyses. The latent factorstðj‘Þare linear
combinations of lipidsx1,. . .,xj
−1,xj+1,. . .,xpwith PLS regression coefficientsc
ð‘Þ
jk and are
se-quentially constructed. The connectivity score isfinally computed in a symmetrized form
revis-ing the roles of lipidsjandkas
^s
jk¼
Pv
‘¼1
^
bj‘c
ð‘Þ
jk þ
Pv
‘¼1
^
bk‘c
ð‘Þ
kj
2 :
The regression coefficients relating to the additional covariates are not used in computing the
connectivity score.
Modules of lipids
Biological networks have often a modular structure where lipids belonging to different clusters have a weak or no connection between them, while within a cluster lipids are connected by short paths with strong connections. In an unsupervised study, one goal of the network analysis is to identify such modular structures. Modular structures are mainly examined by visual means, but also a mathematical definition of a module is provided by Gill, Datta, and Datta
[23]. Letmbe the minimum module size parameter, and"a certain threshold criteria of the
connectivity scores. If the connectivity score between two lipids is above", lipids are included
in the network. A collection of lipids is called a module if at leastmof them are connected by a
path of lipids such that the connectivity score between all pairs of lipids on that path is at least
". In addition, such a set has to be a maximal collection so that all the connectivity scores be-tween lipids within the module are at least"and outside the module are smaller than".
Differential network analysis
Testing for different modular structures in two networks. Building on the works of Gill,
Datta, and Datta [23], we provide a modified permutation test on association scores resulted
from partial least square regression on stacked multiple imputed lipidomic data.
Let us assume that the two networks have been constructed separately for case and control
samples using association scores based on PLS regression. Given the parametersmand"one
can identify the modular structures of the two networks. Let {Fk1,. . .,FkR
k} be a set of all the
distinct modulesrof size at leastmand with connectivity"in networkk, fork= 1,2. ThenR1is
the number of modules for case network andR2the number of modules for control network.
DenoteL0the collection of all lipids that are present in some module in both networks,
L0 ¼ \
LetFkr(j), fork= 1,2, be the module in networkkthat contains lipidj,j2L0. The test statistic
N ¼1 1
jL0j
X
j2L0
jF1
rðjÞ
TF
2rðjÞj
jF
1rðjÞ
SF
2rðjÞj
;
captures the differences between two modular structures in the two networks.jL0jgives the
number of lipids that belong to some modules in both networks. Let us assume that a given
lipidjbelongs to a module in network 1 which contains lipids {j1,j2,j3} and in network 2 to a
module consisting of lipids {j1,j2,j4,j5}. Then the numerator of the sum in the test statisticNis
2 and the denominator 5. Thus, the test statistic gets values between 0 and 1 where zero indi-cates identical modular structures. An empty sum is to be interpreted as 0.
When implementing the MI method on the data to be analysed, the p-value for the overall modular structure test is obtained using a following permutation scheme.
(i) Multiple impute the original data set of sizenby using chained equations. Compute and
save the test statisticNfor the centered and scaled multiple imputed stacked data.
(ii) Permute the group statuses (case/control) of the patients of the original data set of sizen.
Permutation can be executed for example by first sorting the data so thatn1rows are the
real cases and lastn2rows are the real controls. Then we permute the order of the rows
and subsequentn1first rows are the new cases andn2last rows are the new controls.
(iii) Multiple impute the permuted data set of sizen Mtimes and stack the resultingMdata
sets into a one large data set of sizeMn.
(iv) For each permutationπ, compute and save the test statistic
NðpÞ ¼1 1
jL0ðpÞ j
X
j2L0ðpÞ
jF1
rðjÞðpÞ
\
F2rðjÞðpÞ j jF1rðjÞðpÞ
[
F2rðjÞðpÞ j:
(v) Repeat steps (ii)–(iv)Ptimes.
(vi) Test the null hypothesis H0:N= 0, meaning that the modular structures of the two
net-works are indentical, by computing the p-valuepðNÞ ¼1
P
P
pIðNðpÞ NÞ;where the
sum is taken over allPpermutationsπ.
All network analyses were performed utilizing the functions of thednaR-package and
com-bining them with our own functions for different imputation and permutation schemes. The dna-package can be installed from CRAN. Tests with the additional covariates were fitted with
an updated version of thedna-package, that is not yet publicly available.
Testing for differential connectivity of a single lipid. The differential connectivity of a
single lipidjin two networks can be measured by using a mean absolute distance statistic by
Gill, Datta, and Datta [23],
dðjÞ ¼ 1
p 1
X
j02L;j06¼j
j^s1 jj0 ^s
2 jj0 j;
where the sum is taken over all the remaining lipids in a network, and where^sk
jj0is the
connec-tivity score between lipid pair (j,j0) in networksk= 1,2. The
structures in two networks. It is worth noting, that the test statistics and related p-values for all the lipids can be computed simultaneously using the same set of permutations.
For the purposes of reference, we also performed a marginal analysis separately for fully ob-served and imputed lipids. Lipids including imputed values were analysed by fitting identical
ANCOVA-models to five multiple imputed data sets and combining the results using Rubin’s
rules [29], [37]. For fully observed lipids, a single ANCOVA-model was fitted. Each of the
lip-ids was explained with the case/control status, age, body mass index, statin use, and smoking.
Results
Partial lipidomic profiles of 445 CAD patients were quantified and a total of 237 lipids was de-tected. Of those, 86 lipids were detected in at least 60% of the patients and used throughout the analyses.
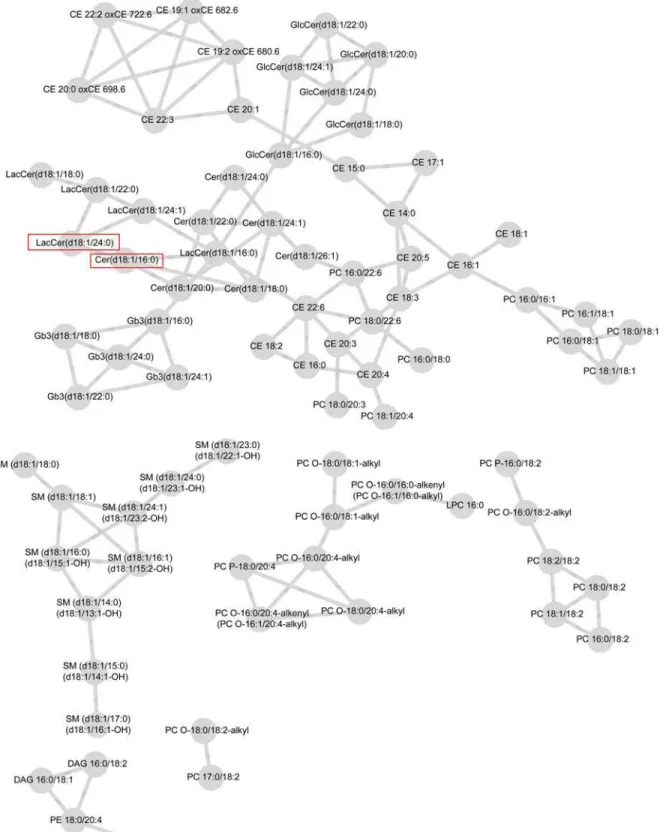
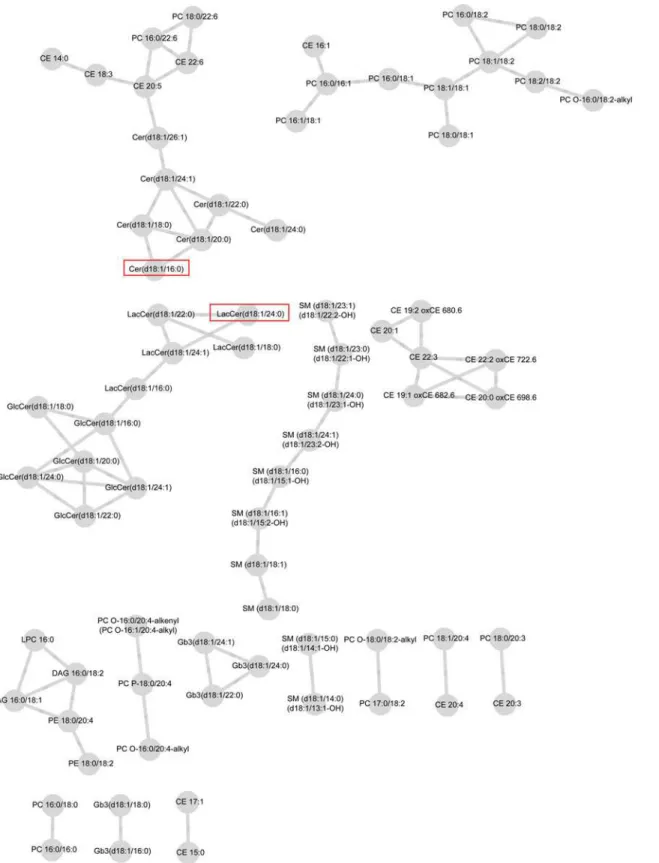
Connectivities were rescaled so that the largest score for each lipid was one in magnitude. For both case and control groups, networks including the connectivities above the selected threshold,"= 0.4, are visualized inFig. 1andFig. 2. These figures are obtained from the Cytos-cape software [38].
The network of case group consists of six modules where as the network for control group has 15 modules. The control group network contains 74 lipids and 78 edges compared to 81 lipids and 118 edges on the case network suggesting, perhaps, higher number of strong connec-tivities in the case network. In both networks, some of the modules are formed solely by lipid species belonging to the same lipid classes which is natural, as they tend to correlate with each
other and have similar biological functions. For example, in the case network (Fig. 1), one
mod-ule consists only of sphingomyelins (SM). In the control network (Fig. 2), part of the SM class,
part of the cholesteryl esters (CE), and part of the globotriaosyl ceramides (Gb3) form their
own modules. These modules are highlighted inFig. 1and2. We observed associations of CE
and phosphatidylcholines (PC) both in the case and the control groups. In the case network, ceramides (Cer), lactosylceramides (LacCer), and glucosylceramides (GlcCer) were closely as-sociated with each other and formed one large module with CE and PC classes. In the control network, we found associations between PC, CE, and Cer classes while LacCer and GlcCer lip-ids isolated in their own module.
Based on the test of differential network modular structures with minimum module size
m= 3 and connectivity threshold"= 0.4, case and control groups did not differ significantly
on 0.05 level (p = 0.236). However, according to our previous experience it is very difficult to show significant difference between overall modular structures between two groups. For the sake of completeness, we performed the differential network analysis for the modules with dif-ferent choices of". The results are presented inTable 1. For multiple imputed data, threshold parameters"= 0.2 and"= 0.25 led to the case and control networks consisting only of one module. Thus, network structures were identical between cases and controls and the test
statis-ticN= 0. On the contrary,"= 0.65 retained only one module consisting of three lipids in the
case network and no modules at all in the control network. In that case, the two networks are fully different and the test statisticN= 1. For higher values," >0.65, networks do not contain
any modules. For any reasonable choice of"(0.2−0.8), the differences in modular structures
remain non-significant.
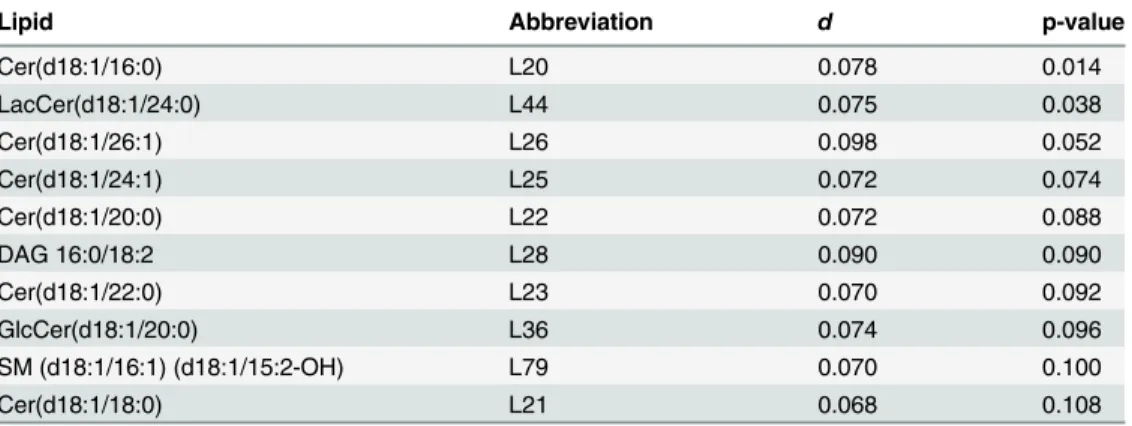
However, differences were detected in terms of the connectivity of each individual lipid in
the two networks. The 10 most differentially connected lipids are listed inTable 2. From those,
Cer(d18:1/16:0) (L20) and Cer(d18:1/24:1) (L25) have previously been related to an increased
risk of CVD death. Two of the lipids inTable 2are significant on 0.05 level: Cer(d18:1/16:0)
Fig 1. Lipid network for case-group with parameter valuesε= 0.4 and minimum modular size = 3.Significant lipids from the test for differential
Fig 2. Lipid network for control-group with parameter valuesε= 0.4 and minimum modular size = 3.Significant lipids from the test for differential
are isolated in the control network into one larger module in the case network. The hub lipids are circled inFig. 1and2.
For comparative purposes of the benefits of MI, it is impossible to do a proper complete case analysis as there are no patients with fully observed lipid profiles. Instead, we selected a subgroup of lipids that were observed at least from 90% of the patients and then selected the complete cases with these lipids fully observed. This resulted in 52 lipids and an effective sam-ple size of 310. Based on the test of differential network structures with minimum module size
m= 3 and connectivity threshold"= 0.4, case and control groups did not differ significantly
on 0.05 level (p = 0.202). The result is very similar to the one obtained by the MI approach. For
any other moderate choice of", the differences in modular structures remain non-significant.
The results indicate similar test results as in the MI approach as shown inTable 1. However,
complete case analysis (not shown) was unable to identify clear modules among case and con-trol networks as lipids seemed to form one large module despite increasing the threshold
Table 1. Test for differential modular structure in the case and control networks for MI LURIC data.For comparison, the same statistics and p-values are given for complete case (CC) data with subgroup of lipids from which 90% of the values were detected.
" N p-value NCC p-value
0.20 0.00 1.000 0.04 0.530
0.25 0.00 1.000 0.11 0.620
0.30 0.02 0.582 0.19 0.722
0.35 0.38 0.510 0.37 0.580
0.40 0.77 0.236 0.81 0.202
0.45 0.72 0.298 0.91 0.164
0.50 0.62 0.522 0.95 0.122
0.55 0.81 0.236 0.92 0.370
0.60 0.88 0.318 0.93 0.312
0.65 1.00 0.000 0.97 0.158
0.70 0.00 1.000 0.93 0.312
0.75 0.00 1.000 0.97 0.158
0.80 0.00 1.000 0.93 0.312
doi:10.1371/journal.pone.0121449.t001
Table 2. The 10 most differentially connected lipids for MI LURIC data based on the test for differential connectivity of individual lipids between case and control groups.
Lipid Abbreviation d p-value
Cer(d18:1/16:0) L20 0.078 0.014
LacCer(d18:1/24:0) L44 0.075 0.038
Cer(d18:1/26:1) L26 0.098 0.052
Cer(d18:1/24:1) L25 0.072 0.074
Cer(d18:1/20:0) L22 0.072 0.088
DAG 16:0/18:2 L28 0.090 0.090
Cer(d18:1/22:0) L23 0.070 0.092
GlcCer(d18:1/20:0) L36 0.074 0.096
SM (d18:1/16:1) (d18:1/15:2-OH) L79 0.070 0.100
Cer(d18:1/18:0) L21 0.068 0.108
parameter". It is noteworthy, that we started with a fewer number of lipids for the complete case analysis compared to the number of lipids after imputation in the MI data. Also, the effec-tive sample size is smaller and thus relationships between lipids are weaker. For example, in the
complete case analysis, after choosing"= 0.4, the case network consists of two modules
includ-ing 35 lipids and control network of 37 lipids in one module. Thus, larger number of the lipids
are one of the advantages of the MI approach. Threshold parameter"= 0.5 resulted in the
low-est p-value in the complete case analysis, but even then both networks consist of single modules with 26 lipids in the case network and 24 lipids in the control network.
In the complete case analysis, testing for the differential connectivity of a single lipid re-sulted in two lipids that were differentially connected between case and control groups, Gb3 (d18:1/24:0) (L32) and LPC 16:0 (L40). LPC 16:0 (L40) did not come up in the previous analy-sis and it includes only two missing values in the original data set. LPC 16:0 (L40) is dropped out in the case group network, but in the control network it is connected to seven other lipids. However, all these connections are weak and the lipid is dropped out of the network, even
when choosing a low value for threshold parameter". In the control group network, Gb3
(d18:1/24:0) (L32) is connected only to one lipid and in the case group network to eight other lipids. Most of the other differentially connected top lipids in this analysis belonged to the cer-amide or glucosylcercer-amide classes. It is noteworthy, that most of the lipids that include left-censored values are left out of the analysis and thus the results may be biased.
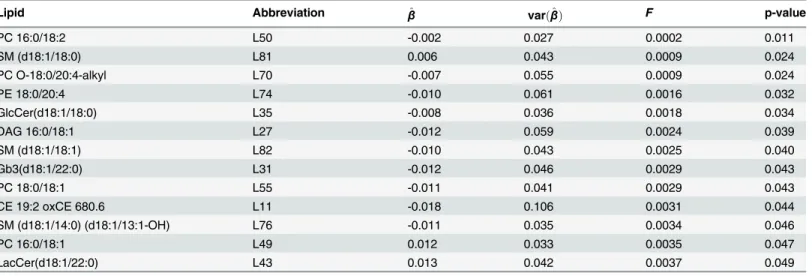
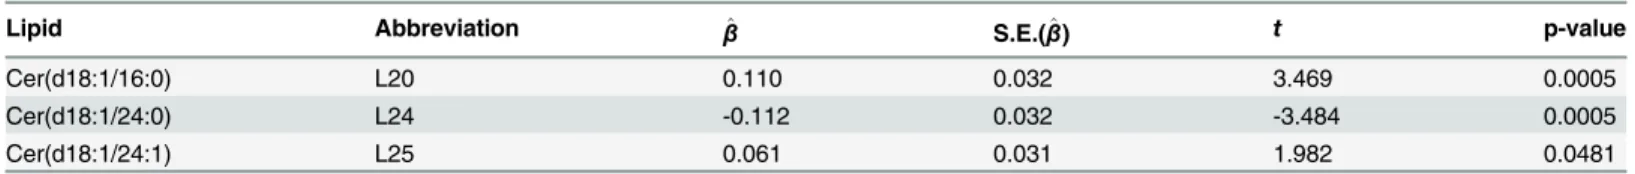
The marginal analysis, using one lipid at a time individually and not in a network, for the MI data gave us 16 lipids that have significantly different mean concentrations between cases
and controls. These lipids are listed in Tables3and4. Marginal analysis found the two same
risk related lipids, Cer(d18:1/16:0) (L20) and Cer(d18:1/24:1) (L25), that had differential con-nections in the case and control networks. LacCer(d18:1/24:0) (L44) is significantly differen-tially connected between case and control networks. Also Cer(d18:1/24:0) (L24) shares a similar structure with several other ceramides that came up in the networks. As a summary,
Table 3. The 13 imputed lipids having significantly different mean concentrations between case and control groups by the marginal analysis imple-mented by using Rubin’s rules.
Lipid Abbreviation β^ varðβ^Þ F p-value
PC 16:0/18:2 L50 -0.002 0.027 0.0002 0.011
SM (d18:1/18:0) L81 0.006 0.043 0.0009 0.024
PC O-18:0/20:4-alkyl L70 -0.007 0.055 0.0009 0.024
PE 18:0/20:4 L74 -0.010 0.061 0.0016 0.032
GlcCer(d18:1/18:0) L35 -0.008 0.036 0.0018 0.034
DAG 16:0/18:1 L27 -0.012 0.059 0.0024 0.039
SM (d18:1/18:1) L82 -0.010 0.043 0.0025 0.040
Gb3(d18:1/22:0) L31 -0.012 0.046 0.0029 0.043
PC 18:0/18:1 L55 -0.011 0.041 0.0029 0.043
CE 19:2 oxCE 680.6 L11 -0.018 0.106 0.0031 0.044
SM (d18:1/14:0) (d18:1/13:1-OH) L76 -0.011 0.035 0.0034 0.046
PC 16:0/18:1 L49 0.012 0.033 0.0035 0.047
LacCer(d18:1/22:0) L43 0.013 0.042 0.0037 0.049
marginal analysis mostly identified the same or related differing lipids as the differential net-work analysis. However, it is interesting to observe that none of the PC or PE lipids, that were differentially expressed in the marginal analysis, turned out to be differentially expressed in the network analysis. Majority of the lipids in the network analysis are from the ceramide class. Ceramides are responsible for mediating cell-stress responses and the regulation of cell death and cell ageing. In this particular experiment the differential nature of ceramides is
quite relevant.
Discussion
Differential network analysis provides a formal statistical methodology to examine differences in lipidomic network structures under two biological conditions and to recognize the impor-tant distinguishing lipids. It responds to the acknowledged need for efficient analytical tools in
the fields of lipidomics [39]. Compared to a lipid specific marginal analysis, a network analysis
provides a tool to consider all the lipids simultaneously. Marginal analysis may identify the key lipids affected within a specific group of patients, but differential network analysis takes this in-formation further by examining all the lipids simultaneously and investigating how they act to-gether. It also allows us to visualize inter-lipid connections and find groups of lipids, so called modules, that are closely connected.
The major contribution of this paper is to provide a recipe to perform differential network analysis on multiple imputed lipidomic data. We showed that this approach coincides well with our complete case analysis among frequently detected lipids, but reduces the possibility of bias and adds network information on less frequently detected lipids. With the proposed multi-ple imputation scheme followed by the customized differential network analysis one can take full advantage of the data in the presence of missing values.
The present data indicated significant network associations between different lipid species within the same lipid classes, but perhaps more importantly, also between different lipid spe-cies originating from different lipid classes. These lipid spespe-cies may contain a highly regulated fatty acid component, the property which is significantly affecting many lipid species across lipid classes. On the other hand, in circulation, the majority of the lipids are carried in different lipoproteins (e.g. HDL or LDL) and therefore the role of HDLs may explain for example the observed association between cholesteryl esters and phosphatidylcholines. Cer(d18:1/16:0) (L20) has an important role in connecting different SL species together. SLs are structurally
very diverse, and ceramides are the backbone of all SL class [40–42]. The structural diversity
of ceramides is based either on their long chain sphingoid base [43] or fatty acid composition
[44], leading to a large variety of ceramides distinguished by specific structural modifications
[13].
The earlier lipidomics findings [7] indicate for the first time that alterations in SL
metabo-lism leading to changes in the fatty acid chain length of ceramides are highly relevant to CV risk. Specific SLs and in particular ceramides with a distinct molecular structure, Cer18:1/16:0
Table 4. The three fully observed lipids having significantly different mean concentrations between case and control groups by the marginal analysis.
Lipid Abbreviation β^ S.E.(β^) t p-value
Cer(d18:1/16:0) L20 0.110 0.032 3.469 0.0005
Cer(d18:1/24:0) L24 -0.112 0.032 -3.484 0.0005
Cer(d18:1/24:1) L25 0.061 0.031 1.982 0.0481
(L20) and Cer18:1/18:0 (L21), are associated with CV risk while for instance Cer18:1/24:0 (L24) appears to be protective. Remarkably, the Cer18:1/16:0 to Cer18:1/24:0 ratio seems a
bet-ter predictor of clinical outcome than traditional risk factors such as LDL cholesbet-terol [7].
Im-portantly, in this study, tests for differentially connected individual lipids succeeded in
identifying Cer18:1/16:0 as a key metabolite for increased CV outcome risk. This observation is consistent with earlier findings and demonstrates the usefulness of the differential network analysis with the complex lipidomic data. Regardless the field of research, the network analysis approach and the implementation routines designed for this case study may as well be extend-ed to other types of molecular data, such as the microarray gene expression and protein expression data.
Given the high prevalence of CAD associated mortality, prevention of fatal and non-fatal myocardial infarctions in CAD patients is a clinical challenge. The average annual mortality
rate is generally between 1–3% and the annual rate of non-fatal events is 1–2% among stable
CAD patients. However, at individual patient level the outcome event risk may vary consider-ably and, therefore, risk estimation tools are needed for better care and treatment optimization. To this date serum total cholesterol and LDL cholesterol are considered to be the markers of ar-teriosclerosis and its clinical manifestations such as acute coronary events. However, it has been shown in previous studies that LDL cholesterol levels fail to recognize a substantial
pro-portion of patients at high risk for coronary events [5,7]. Thus, there is a need for
understand-ing the roles of many other lipid species in arteriosclerosis beyond LDL cholesterol and HDL
cholesterol. Tarasov et al. [7] performed a study on prospective clinical samples of CAD
pa-tients for evaluating the value of different molecular lipids separately to establish their causal relationship with CAD. However, the lipids act in consort. We are not aware of any study where all the lipids are considered together simultaneously in a network setup in order to iden-tify the differences in two network structures. The current results in ideniden-tifying Cer18:1/16:0 as a key metabolite for increased cardiovascular outcome risk may help us to develop improved risk assessment tools for physicians and help developing new drugs with better
clinical outcome.
Differential network analysis is based on statistical tests such as differential connectivity of a lipid in the presence of other lipids in two networks. Finding precise calibration for multiple hypotheses correction in such tests becomes problematic with the network setup. All the exist-ing multiple hypotheses correction procedures assume that the multiple tests are independent (or weak dependent) of each other. In the network setup that cannot be assumed. However, these tests perform well in simulation studies and real data analysis. Also the end result may de-pend on what association measure and threshold are being used to construct the network.
Guided by simulation studies in Gill et al [23] and Pihur et al [22], we have used PLS based
scores in this work.
The computation demand of the permutation tests using PLS scores for overall difference between the two networks and differences between individual lipids is substantial due to re-peating the multiple imputation step for each permuted data set. We conducted the analyses using a high-performance distributed-memory cluster. The computing time for each of the 500 imputation-permutation steps takes about twenty minutes, which makes parallel computing highly useful in this context. Without the parallel computing the computation time for one per-mutation test would be several days, where as the parallel computing decreases the total time to less than one hour.
As an alternative to the PLS model to find the association measures for the network
con-struction one could use penalized sparse regression models such as adaptive elastic net [45].
adaptive elastic net followed by a differential network analysis with a permutation test which provided similar result as the PLS based connectivity scores.
Acknowledgments
This work was conducted in part using the Cardinal Research Cluster (University of Louisville,
Kentucky, USA). Assistance with thedna-package provided by Dr. Ryan Gill is greatly
appreciated.
Author Contributions
Conceived and designed the experiments: JN SD RL. Performed the experiments: MK RL. Ana-lyzed the data: MK. Contributed reagents/materials/analysis tools: RL WM SD. Wrote the paper: MK SD JN RL WM.
References
1. Mouritsen OG. Life - as a matter of fat. The emerging science of lipidomics. Heidelberg Germany: Springer-Verlag; 2005.
2. Wenk MR. The emerging field of lipidomics. Nature Reviews, Drug Discovery. 2005; 4:594–610. doi: 10.1038/nrd1776PMID:16052242
3. Sud M, Fahy E, Cotter D, Brown A, Dennis EA, Glass CK, et al. LMSD: LIPID MAPS Structure Data-base. Nucleic Acids Research. 2007; 35:D527–D532. doi:10.1093/nar/gkl838PMID:17098933 4. WHO. World health statistics 2009. WHO Press, Geneva; 2009.
5. Sachdeva A, Cannon CP, Deedwania PC, LaBresh KA, Smith SCJ, Dai D, et al. Lipid levels in patients hospitalized with coronary artery disease: an analysis of 136,905 hospitalizations in Get With The Guidelines. American heart journal.2009; 157(1):111–117. doi:10.1016/j.ahj.2008.08.010PMID: 19081406
6. Winkelmann B, Mäarz W, Boehm BO, Zotz R, Hager J, Hellstern P, et al. Rationale and design of the LURIC study - a resource for functional genomics, pharmacogenomics and long-term prognosis of car-diovascular disease. Pharmacogenomics. 2001; 2(1 Suppl 1: ):S1–73. doi:10.1517/14622416.2.1.S1 PMID:11258203
7. Tarasov K, Ekroos K, Suoniemi M, Kauhanen D, Sylvanne T, Hurme R, et al. Molecular Lipids Identify Cardiovascular Risk and Are Efficiently Lowered by Simvastatin and PCSK9 Deficiency. Journal of Clinical Endocrinology and Metabolism. 2014; 99(1):E45–E52. doi:10.1210/jc.2013-2559PMID: 24243630
8. Aldridge BB, Burke JM, Lauffenburger DA, Sorger PK. Physicochemical modelling of cell signalling pathways. Nature Cell Biology. 2006; 8(11):1195–1203. doi:10.1038/ncb1497PMID:17060902 9. Merrill AH. Sphingolipid and Glycosphingolipid Metabolic Pathways in the Era of Sphingolipidomics.
Chemical Reviews. 2011; 111(10):6387–6422. doi:10.1021/cr2002917PMID:21942574
10. Alvarez-Vasquez F, Sims KJ, Hannun YA, Voit EO. Integration of kinetic information on yeast sphingoli-pid metabolism in dynamical pathway models. Journal of Theoretical Biology. 2004; 226(3):265–291. doi:10.1016/j.jtbi.2003.08.010PMID:14643642
11. Alvarez-Vasquez F, Sims KJ, Cowart LA, Okamoto Y, Voit EO, Hannun YA. Simulation and validation of modelled sphingolipid metabolism in Saccharomyces cerevisiae. Nature. 2005; 433 (7024):425–30. doi:10.1038/nature03232PMID:15674294
12. Gupta S, Maurya MR, Jr AHM, Glass CK, Subramaniam S. Integration of lipidomics and transcriptomics data towards a systems biology model of sphingolipid metabolism. BMC Systems Biology. 2011; 5(26). 13. Hannun YA, Obeid LM. Many ceramides. Journal of Biological Chemistry.2011; 286:27855–27862. doi:
10.1074/jbc.R111.254359PMID:21693702
14. Turpin SM, Nicholls HT, Willmes DM, Mourier A, Brodesser S, Wunderlich CM, et al. Obesity-Induced CerS6-Dependent C16:0 Ceramide Production Promotes Weight Gain and Glucose Intolerance. Cell Metabolism. 2014; 20(4):678–686. doi:10.1016/j.cmet.2014.08.002PMID:25295788
16. Gopalacharyulu PV, Lindfors E, Miettinen J, Bounsaythip CK, Oresic M. An Integrative Approach for Bi-ological Data Mining and Visualization. International Journal of Data Mining and Bioinformatics. 2008; 2:54–77. doi:10.1504/IJDMB.2008.016756PMID:18399328
17. Oresic M. Bioinformatics and computational approaches applicable to lipidomics. European Journal of Lipid Science and Technology. 2009; 111:99–106. doi:10.1002/ejlt.200800144
18. Steuer R, Kurths J, Fiehn O, Weckwerth W. Observing and interpreting correlations in metabolomic net-works. Bioinformatics. 2003; 19:1019–1026. doi:10.1093/bioinformatics/btg120PMID:12761066 19. Steuer R. On the analysis and interpretation of correlations in metabolomic Data. Briefings in
Bioinfor-matics. 2006; 7:151–158. doi:10.1093/bib/bbl009PMID:16772265
20. Yetukuri L, Katajamaa M, Medina-Gomez G, Seppanen-Laakso T, Vidal-Puig A, Oresic M. Bioinfor-matics strategies for lipidomics analysis: characterization of obesity related hepatic steatosis. BMC Systems Biology. 2007; 1(12). doi:10.1186/1752-0509-1-12PMID:17408502
21. Datta S. Exploring relationships in gene expressions: a partial least squares approach. Gene Expres-sion. 2001; 9(6):249–255. PMID:11763996
22. Pihur V, Datta S, Datta S. Reconstruction of genetic association networks from microarray data: a par-tial least squares approach. Bioinformatics. 2008; 24(4):561–568. doi:10.1093/bioinformatics/btm640 PMID:18204062
23. Gill R, Datta S, Datta S. A statistical framework for differential network analysis from microarray data. BMC Bioinformatics. 2010; 11(95). doi:10.1186/1471-2105-11-95PMID:20170493
24. Jornsten R, Wang HY, Welsh WJ, Ouyang M. DNA microarray data imputation and significance analy-sis of differential expression. Bioinformatics. 2005; 21(22):4155–4161. doi:10.1093/bioinformatics/ bti638PMID:16118262
25. Stacklies W, Redestig H, Scholz M, Walther D, Selbig J. pcaMethods - a bioconductor package provid-ing PCA methods for incomplete data. Bioinformatics Applications note. 2007; 23(9):1164–1167. doi: 10.1093/bioinformatics/btm069
26. Aittokallio T. Deadata with missing values in large-scale studies: microarray data imputation and be-yond. Briefings in Bioinformatics. 2009; 11(2):253–264. doi:10.1093/bib/bbp059PMID:19965979 27. Lee M, Kong L, Weissfeld l. Multiple imputation for left-censored biomarker data based on Gibbs
sam-pling method. Statistics in Medicine. 2012; 31(17):1838–1848. doi:10.1002/sim.4503PMID:22359320 28. Bijlsma S, Bobeldijk I, Verheij ER, Ramaker R, Kochhar S, Macdonald IA, et al. Large-Scale Human
Metabolomics Studies: A Strategy for Data (Pre-) Processing and Validation. Analytical Chemistry. 2006; 78(2):567–574. doi:10.1021/ac051495jPMID:16408941
29. Rubin DB. Multiple Imputation for Nonresponse in Surveys. New York USA: John Wiley and Sons; 2004.
30. Raghunathan TE, Lepkowksi JM, Hoewyk JV, Solenbeger P. A multivariate technique for multiply im-puting missing values using a sequence of regression models. Survey Methodology. 2001; 27:85–95. 31. VanBuuren S. Multiple imputation of discrete and continuous data by fully conditional specification.
Sta-tistical Methods in Medical Research. 2007; 16:219–242. doi:10.1177/0962280206074463
32. Azur MJ, Stuart EA, Frangakis C, Leaf PJ. Multiple imputation by chained equations: what is it and how does it work? International journal of methods in psychiatric research. 2011; 20(1):40–49. doi:10.1002/ mpr.329PMID:21499542
33. VanBuuren S, Groothuis-Oudshoorn K. mice: Multivariate Imputation by Chained Equations in R. Jour-nal of Statistical Software. 2011; 45(3):1–67.
34. Rubin DB. Multiple imputation after 18+ years (with discussion). Journal of the American Statistical As-sociation. 1996; 91:473–489. doi:10.1080/01621459.1996.10476908
35. Meng XL. Multiple-imputation inferences with uncongenial sources of input (with discussion). Statistical Science. 1994; 10:538–573.
36. Wood AM, White IR, Royston P. How should variable selection be performed with multiply imputed data? Statistics in Medicine. 2008; 27:3227–3246. doi:10.1002/sim.3177PMID:18203127
38. Shannon P, Markiel A, Ozier O, Baliga NS, Wang JT, Ramage D, et al. Cytoscape: a software environ-ment for integrated models of biomolecular interaction networks. Genome Research. 2003; 13:2498–
2504. doi:10.1101/gr.1239303PMID:14597658
39. Niemela PS, Castillo S, Sysi-aho M, Oresic M. Bioinformatics and computational methods for lipido-mics. Journal of Chromatography. 2009; 877:2855–2862. PMID:19200789
40. Futerman AH, Hannun YA. The complex life of simple sphingolipids. EMBO Reports. 2004; 5:777–782. doi:10.1038/sj.embor.7400208PMID:15289826
41. Hannun YA, Obeid LM. Principles of bioactive lipid signalling: Lessons from sphingolipids. Nature Re-views Molecular Cell Biology. 2003; 9:139–150. doi:10.1038/nrm2329
42. Spiegel S, Milstien S. Sphingosine-1-phosphate: An enigmatic signalling lipid. Nature Reviews Molecu-lar Cell Biology. 2003; 4:397–407. doi:10.1038/nrm1103PMID:12728273
43. Pruett ST, Bushnev A, Hagedorn K, Adiga M, Haynes CA, Sullards MC, et al. Biodiversity of sphingoid bases (“sphingosines”) and related amino alcohols. Journal of lipid research. 2008; 49:1621–1639. doi: 10.1194/jlr.R800012-JLR200PMID:18499644
44. Merrill AHJ, Wang MD, Park M, Sullards MC. (glyco)sphingolipidology: An amazing challenge and op-portunity for systems biology. Trends in Biochemical Sciences. 2007; 32:457–468. doi:10.1016/j.tibs. 2007.09.004PMID:17928229