ISSN 0104-6632 Printed in Brazil
www.abeq.org.br/bjche
Vol. 32, No. 02, pp. 465 - 473, April - June, 2015 dx.doi.org/10.1590/0104-6632.20150322s00003459
Brazilian Journal
of Chemical
Engineering
ACIDIC REMOVAL OF METALS FROM
FLUIDIZED CATALYTIC CRACKING
CATALYST WASTE ASSISTED BY
ELECTROKINETIC TREATMENT
R. B. G. Valt
1*, A. N. Diógenes
4, L. S. Sanches
1, N. M. S. Kaminari
1,
M. J. J. S. Ponte
2and H. A. Ponte
31
Federal University of Paraná, (UFPR), Laboratory of Environmental Technology, PO Box 19011, Zip Code 81531-990, Curitiba - PR, Brazil.
Phone: + (55) (41) 33613197; Fax: + (55) (41) 33613197 E-mail: [email protected]
2Federal University of Paraná, (UFPR), Department of Mechanical Engineering, (DEMEC), Curitiba - PR, Brazil. 3
Federal University of Paraná, (UFPR), Department of Chemical Engineering, Curitiba - PR, Brazil.
4Positivo University, (UP), Department of Mechanical Engineering, Curitiba - PR, Brazil.
(Submitted: April 22, 2014 ; Revised: September 3, 2014 ; Accepted: September 4, 2014)
Abstract - One of the main uses of catalysts in the oil industry is in the fluidized catalytic cracking process, which generates large quantities of waste material after use and regeneration cycles and that can be treated by the electrokinetic remediation technique, in which the contaminant metals are transported by migration. In this study, deactivated FCC catalyst was characterized before and after the electrokinetic remediation process to evaluate the amount of metal removed, and assess structural modifications, in order to indicate a possible use as an adsorbent material. The analyses included pH measurement and the concentration profile of vanadium ions along the reactor, X-ray microtomography, X-ray fluorescence, BET analysis and DTA analysis. The re-sults indicated that 40% of the surface area of the material was recovered in relation to the disabled material, showing an increase in the available area for the adsorption. The remediation process removed nearly 31% of the vanadium and 72% of the P2O5 adhering to the surface of the catalyst, without causing structural or
ther-mal stability changes.
Keywords: Electrokinetic remediation; Metal; Vanadium; Nickel.
INTRODUCTION
The catalysts used in the process of thermal and catalytic cracking of petroleum accelerate chemical reactions by promoting the breakage and rearrange-ment of the oil molecules to generate new product fractions. Fluidized catalytic cracking (FCC) is one of the major processes used in the refining industry (Biswas and Maxwell, 1990), and it converts oil fractions of low value, such as heavy oil, to
high-value products in great market demand, such as auto-motive gasoline and liquified petroleum gas.
Catalytic cracking uses heat, pressure, and an acid catalyst to promote the breakdown of large hydrocar-bon molecules into smaller, lighter molecules. After a few cycles of use and regeneration, however, the metals present in the oil accumulate on the catalyst surface, causing its deactivation.
metals. The most common are vanadium, nickel, sodium and iron (Escobar et al., 2008). The presence of Ni, V and other trace elements, such as Fe, Zn, Pb, Cu, Cd, Cr, Co, As, Sb, Te, Hg, Au or Ag, is common in crude oils around the world (Cerqueira et al., 2008). According to Escobar et al. (2005), the deacti-vation of the zeolite by vanadium may occur on ei-ther a temporary or permanent basis. In the case of temporary deactivation, the vanadium is adsorbed on the surface of the solid, thereby neutralizing the acid sites. In the permanent case, the zeolite structure is attacked by vanadic acid. The interaction of vana-dium with the cations of rare earth elements present in the catalyst can also occur, again destroying the zeolite structure. With regard to nickel, the literature indicates that nickel itself has no effect on the loss of zeolite surface area but that nickel-rare earth element interactions contribute to the attenuation of vana-dium passivation by rare earth elements.
According to Han et al. (2000), cracking reac-tions are catalyzed by a mixture of catalyst particles that have seen low usage (low amounts of contami-nant and high activity) and particles from a regenera-tor that have seen high usage (high amount of con-taminant and low activity). After the catalyst has exhausted its activity, it is deemed to be “deacti-vated” and is therefore thermodynamically stable.
After use, these catalysts become potential pollut-ants due to three basic factors according to Trimm (1999): the heavy metal content, the presence of highly carcinogenic compounds found in coke de-posits lodged in their surfaces and the high acidity of these materials. These materials are among the worst contaminants released from oil refineries, and their acidity far exceeds that of soil.
Due to this hazard, research is justified into new methodologies that can remove metals and that can make them less dangerous or, at least, useable for other applications, preventing the formation of both environmental and human contamination source.
Electrokinetic remediation techniques (EKR) pro-vide for the recovery of contaminated areas by re-moving, reducing or eliminating the concentration of contaminants such as nickel and vanadium. This technique was used originally by Yeung and Accar (Yeung et al., 1997; Puppala et al., 1997; Acar et al., 1995; Yeung et al., 2011) to treat soils contaminated with metals and is based on applying a direct current of low intensity or a low electrical potential differ-ence through electrodes in the soil. Other studies (Acar et al., 1995; Yeung, 2011; Yang and Lin, 1998; Alshawabkeh et al., 1999; Pamukcu et al., 2004; Wang et al., 2007; Guaracho et al., 2009; Ma et al.,
2010, Elicker et al., 2014) related to EKR have illus-trated its feasibility and effectiveness in treating soil in situ without having to remove it from the site, thus making the process cost-effective compared with other methods. According to Li et al. (2012), EKR techniques can also be applied in mine tailings, sew-age sludge, and marine sediments because electroki-netic techniques may be applied in any permeable medium that is ionically conductive.
Thus, this research aims to recover the metals present in the deactivated catalyst, especially vana-dium and nickel, preserving the structure of the cata-lyst for future use as an adsorbent material.
MATERIALS AND METHODS
FCC Catalyst
The studied material consisted of a petroleum fluid catalytic cracking catalyst with its catalytic activity exhausted. The material is a zeolite Y, con-sisting primarily of alumina and silica oxides, with a three-dimensional structure saturated with several heavy metals, mainly nickel and vanadium.
Experimental Procedures
The electrokinetic remediation process was ac-complished in a reactor consisting of an electrode chamber at each end and a compartment containing the catalyst to be remediated. The removal of metals occurs mainly through the electromigration and elec-troosmosis that take place upon applying an electric field between the two electrodes with the addition of an electrolyte stream from the anode to the cathode chamber.
The electrochemical system used for electroki-netic remediation (Figure 1) followed the design developed by Yeung et al. (1997) and adapted by Baptista (2005) and Creplive (2008). The system comprises a compartment with electrolyte (A) feed-ing the anode chamber (F), a peristaltic pump (B), an electrokinetic reactor (C), a compartment of con-taminated electrolyte (D) removed from the cathode chamber (G) and a power supply (E).
Figure 1: Electrokinetic reactor used for electrokinetic remediation.
Three holes were made in the body of the reactor for the insertion of porous Teflon ® tubing to allow the withdrawal of electrolyte samples. The distances of the holes from the anode were 3.5 cm (P1), 10.5 cm (P2) and 17.5 cm (P3). Electrolyte samples in the porous pipes were collected at the time of application of potential in the system and after 2, 4, 8, 16, 24, 32, 40 and 48 hours of treatment, to monitor the pH value and vanadium ion content profile.
The electrolyte was a 1.0 mol.L-1 sulfuric acid so-lution (pH=0) that percolated through the system as a 100 mL.min-1 flow for 48 hours with the application of an electrical potential difference of 11 V. The same procedure was performed without the applica-tion of electric potential for evaluaapplica-tion of the elec-trokinetic process. After this treatment, in both cases, the material was washed with 2 L of distilled water and dried in an oven at 45 °C for 10 hours.
The dried material was sent to X-ray microtomo-graphy, X-ray fluorescence, BET surface area and differential thermal analysis.
Analytical Methods
The pH profile throughout the reactor was deter-mined by indicator paper (Merck Acidilit ®) in the pH range of 0.5 to 5, with graduations of 0.5. The concentration profile of vanadium ions removed along the reactor was determined by sampling the electro-lyte during the experiment. The analyses were per-formed by polarography using a MetrohmPensalab MVA-1.
The X-ray microtomography (SkyScanmodel1072) and X-ray fluorescence (XRF) analyses were per-formed on catalyst samples before and after electrokinetic treatment to evaluate the amount of metal remaining in the material.
The microtomography produced images of sam-ple slices with a 5.78 µm spatial resolution. This setting was used for the two acquisitions to compare the results across gray levels in the reconstructed image. Image processing was performed using the MicroImage® software. The software ParaView® was used for visualization. XRF analysis was per-formed on a Phillips PW 2400 X-ray spectrometer after preparing pressed pellets of the catalyst.
BET surface area analysis and differential thermal analysis (DTA) were used to assess changes in the structure of the catalyst caused by electrokinetic treatment.
Regarding the BET surface area analysis, the de-activated and remediated catalysts were character-ized by the measurement of adsorption-desorption isotherms of nitrogen at its normal boiling point (77 K). The isotherms were performed by using the automatic gas sorption analyzer AUTOSORB-1. Differential thermal analysis (DTA) was performed on a Mettler Toledo TGA/SDTA851 unit. The samples were placed in an open alumina oven and heated from 30 to 700 °C in a nitrogen atmosphere (100 mL.min-1) with a temperature ramp of 20 °C.min-1 and then from 700 °C to 1200 °C, also in an atmosphere of nitrogen, with a temperature ramp of 5 °C.min-1.
RESULTS AND DISCUSSION
Catalyst Characteristics
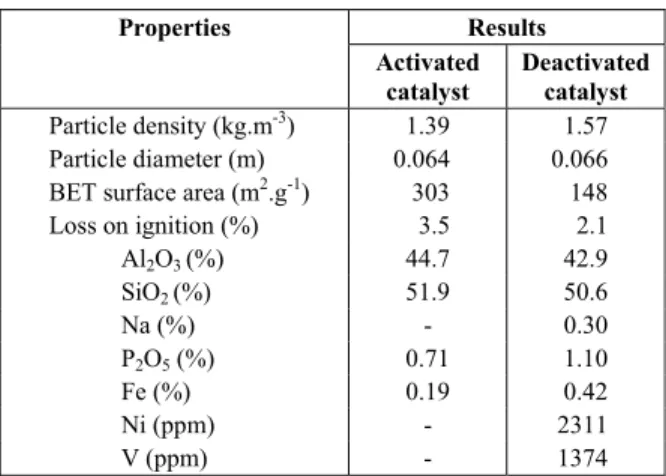
The characteristics of the activated and deacti-vated catalyst are listed in Table 1.
Table 1: Properties of the deactivated catalyst.
Results Properties
Activated catalyst
Deactivated catalyst
Particle density (kg.m-3) 1.39 1.57
Particle diameter (m) 0.064 0.066
BET surface area (m2.g-1) 303 148
Loss on ignition (%) 3.5 2.1
Al2O3 (%) 44.7 42.9
SiO2 (%) 51.9 50.6
Na (%) - 0.30
P2O5 (%) 0.71 1.10
Fe (%) 0.19 0.42
Ni (ppm) - 2311
V (ppm) - 1374
The results in Table 1 showed an increase in den-sity of the deactivated catalyst due to the impreg-nated substances on the surface after use. The diame-ter of the particles increased, since the smaller cata-lyst particles were removed before the use in the FCC process. The Si/Al (wt/wt) ratios of 1.161 for the activated catalyst and 1.179 for disabled catalyst show a small decrease in thermal stability of the material after use (Cruciani, 2006).
The quantities of phosphorus pentoxide and iron increased after use, as well as the contents of the elements Na, Ni and V, that were not found in the fresh catalyst (Mathieu et al, 2014).
It was also observed that the surface area de-creased by about 50% due to occupying the material pores by coke and heavy metals.
Variations of pH
The pH profile along the reactor is provided in Figure 2. Controlling pH throughout the reactor is important because lower pH values favor the
desorp-tion of the adsorbed metals on the catalyst (Elicker et al., 2014) and also promote the dissolution of the precipitated contaminants (Giannis et al., 2010).
Variations in pH occur because the application of direct electric current through electrodes immersed in aqueous water induces electrolysis reactions on the electrodes. Normally, this process yields a front of acid oxidation caused by water and the release of H+ ions from the anode. As the solution used is al-ready acid, this variation is not noted. Likewise, at the cathode an OH- alkaline ion front from water reduction reaction is created. The acid front moves toward the cathode by electroosmosis, ionic migra-tion transport processes and flux convecmigra-tion. The alkaline front is directed to the anode by ionic diffu-sion and migration. Because the mobility of H+ is almost two times higher than the effect of OH- and electroosmosis retards the diffusion and migration of the alkaline front, the acid front becomes predomi-nant along the reactor, except for the areas near the cathode (Acar et al., 1995; Yang and Lin, 1998; Alshawabkeh et al., 1999; Yeung, 2011).
Figure 2 shows that the initial pH of the electrolyte throughout the reactor after 24 hours of rest was 2.5 due to equilibrium between the electro-lyte and catalyst. During the experiment, the reactor was fed through the anode chamber with electrolyte (H2SO4, 1.0 mol.L
-1
, pH = 0), which also explains the low pH in regions near the anode. Higher pH values were observed at points near the cathode chamber (17.5 cm) due to the reduction of water and generation of hydroxyl ions in the region.
As electrolyte flows through the reactor, the acid front decreases the pH in the remaining regions until 24 h of applied electrical potential. After 32 hours of applied electrical potential, the pH was 1.5 in regions closer to the cathode, and this value increased to 2.0 by the end of the experiment.
3.5 17.5
,50 1,0 1,50 2,0 2,50 3,0 3,50
0 2 4 8 16 24 32 40 48
2.50
0.50 3.00
3.50
1.50 1.75
2.00 3.25
2.25 3.50
3.00
2.50
2.00
1.50
1.00
pH
Time (h)
10.5
3.50
3.00
2.50
2.00
1.50
1.00
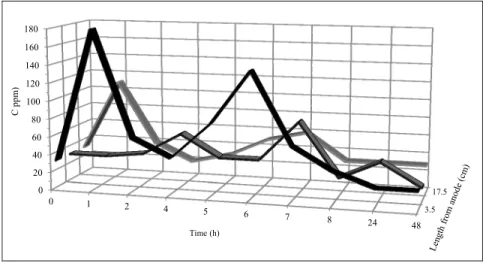
Monitoring the Removal of Vanadium Ions
The removal of vanadium ions throughout the re-actor was monitored to evaluate the efficiency of the remediation process because this metal is one of the main contaminants of deactivated catalyst. Figure 3 shows the concentration profile of vanadium ions present in the electrolyte removed along the reactor for the purposes of the experiment. It can be ob-served from Figure 3 that, after 1 hour of applied potential, the concentration of vanadium ions re-moved at point 1 was 179 ppm and the concentration at point 3 was 110.5 ppm. In addition to the acidity caused by the low pH of the electrolyte itself, ac-cording to Giannis et al. (2012), once the pH near the anode drops due to an acidic front, a tendency to-ward the greater removal of vanadium ions at point 1 may be expected, as occurred throughout the experi-ment. The removal of vanadium ions increases as the reaction surface pH decreases, as well as after 6 h of remediation. A peak in the concentration of vana-dium ions removed at this point was observed, caused by the acidity of the electrolyte. As this acid-ity was consumed, the amount of removed vanadium ions decreased, reaching a minimum at 24 h, a trend that continued until the end of the experiment.
The solution sample at point 2 (10.5 cm) showed a lower removal of vanadium ions (30.5 ppm), which is explained by the higher pH value at this point. Despite the change in pH that occurred at this point during the experiment, the amount of vanadium ions removed can be considered constant, except for the concentration peaks at 4 h, 7 h and 24 h caused by the formation of an acidic front.
Regarding the results obtained at point 3 (17.5 cm), the cathode was observed to have a greater influence on the catalyst. This region showed a concentration
profile different from those observed for the other two points (1 and 2), with a maximum of removal at 6 hours of experiment, a result of the displacement of the acidic front from the anode to the cathode, and a minimum value after 8 h of experiment.
During the remediation process, 0.74 KWh was consumed per kilogram of catalyst treated, which indicates a low specific energetic consumption. The total effluent generated was 5.23 L per kilogram of catalyst treated, containing metallic ions removed by the process. There is an opportunity for future re-search on this topic by investigating procedures for the selective precipitation of metals contained in the effluent generated during the process of EKR.
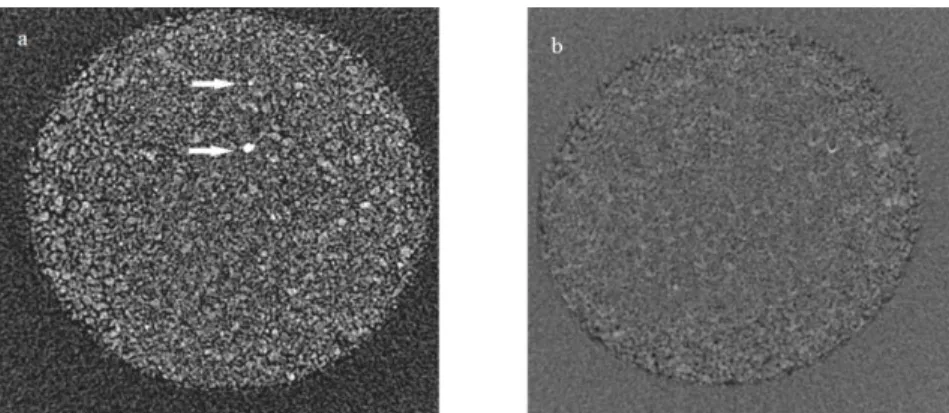
Analysis of Metal Present in the Catalyst
Figure 4 presents two images obtained by X-ray microtomography, performed to qualitatively evalu-ate the metal removed from the catalyst. Figure 4(a) represents the deactivated catalyst. The arrows indi-cate the presence of metal particles in this sample. The metal, which has higher attenuation coefficients relative to the catalyst, presents whiter shades (255 in the gray-tone matrix) than the rest of the sample. Figure 4(b) presents an image of the remediated cata-lyst. Note the absence of gray tones close to white spots, which indicate low amounts of metal.
The results of X-ray microtomography of the de-activated and remediated catalysts are shown qualita-tively in Figure 5, generated by reconstructing images in three dimensions and subsequently targeting threshold gray levels. Each edge of the reconstructed cubes is 0.3 mm in length.
Comparing the two images in Figure 5, it appears that electrokinetic remediation promoted the removal of material with a higher attenuation coefficient, such
3.5 17.5 0
20 40 60 80 100 120 140 160 180
0 1 2 4
5 6 7
8 24
48
C ppm
)
Time (h)
Figure 4: X-ray microtomographic section: a) deactivated catalyst b) reme-diated catalyst.
(a) (b)
(a) (b)
Figure 5: X-ray microtomography: a) deactivated catalyst b) remediated
catalyst.
as metal, as indicated by the dark shades of gray. In Figure 5(b), the arrow indicates the amount of unre-moved high-attenuation-coefficient material. It is not possible, however, to affirm that the removed mate-rial was metal because no dual-energy technique was adopted (Remeysen and Swennen, 2008).
The main information obtained from the X-ray microtomography analysis was that a material with high attenuation coefficient was removed, been com-patible with heavy metals (Hubbell and Seltzer, 2004). It was possible, however, to use XRF to vali-date the visual observation results of X-ray microto-mography.
The results of the analysis of metal content in the catalyst after EKR treatment are shown in Table 2. The amount removed from each substance in relation to the deactivated catalyst was calculated by sub-tracting the removal caused by an acid wash without an applied potential. Thus, it was possible to evaluate
the real removal of heavy metals promoted by the potential applied in the system.
Table 2: Results of RXF analysis of metal content in the catalyst after the EKR.
Substance Catalyst with acid
wash without applied potential
Remediated catalyst
% Removal
Al2O3 (%) 42.64 40.9 4.07
SiO2 (%) 50.19 49.7 0.98
Na (%) 0.29 0.18 38.64
P2O5 (ppm) 1.08 0.31 70.92
Fe (%) 0.41 0.33 19.65
Ni (ppm) 2302 2267 1.52
V (ppm) 1344 949 29.37
and sodium (Na), with 38.64% removal. Because sodium can disable zeolite and reduce the octane of gasoline, it is necessary to manage its presence on the catalyst (Tangstad et al., 2000). Despite the pres-ence of P2O5 in the initial formulation of the catalyst,
its amount increases after the contact of the catalyst with oil. Then, it is removed by the remediation process. There was a slight reduction in the amount of aluminum and silicon present in the catalyst after remediation, but the Si/Al (wt/wt) proportion in-creased to 1.21 after the remediation, showing a small thermal stability gain, as indicated by the dif-ferential thermal analysis discussed below.
The nickel levels presented a low removal level (1.52%). As mentioned in other reports (Lappas et al., 2001; Escobar et al., 2008; Pinto et al., 2010), the mobility of metal in the catalyst is a very impor-tant behavior, and nickel ions are less mobile than vanadium ions and remain fixed in the same checal environment. Vanadium ions, however, only mi-grated from the surface of the catalyst, resulting in a 29.37% removal of this metal.
It is noteworthy that the XRF analysis is comple-mentary to the X-ray microtomography technique because the former identifies the metals that were removed, whereas the latter shows the spatial distri-bution of the materials that were removed. Thus, it is possible to affirm that the materials with high at-tenuation coefficients, which were detected by X-ray microtomography, follow the same trend as the met-als detected by the XRF technique.
Damage Assessment on the Catalyst Structure
Damage to the catalyst structure was assessed by BET analysis and differential thermal analysis (DTA).
The BET tests demonstrated an effective recovery of porosity after electrokinetic treatment, resulting in an increase of active surface area. The deactivated catalyst showed a surface area of 148 m².g-1 and the remediated catalyst 208 m².g-1; therefore, 40% of the surface area was recovered compared to the deacti-vated material.
This surface area recovery may be divided be-tween internal and external areas, with a greater in-crease observed for the external surface area (111.1%) compared to the inner surface area of the catalyst (7.4%), indicating that the remediation proc-ess is more active at the outer surface of the material.
There was also a 45% increase in the volume of the catalyst pores after the treatment with sulfuric acid. Likewise, there were increases in the average pore diameter (12.4%), the total nitrogen adsorption capacity (40%) and the adsorption capacity of nitro-gen in micropores (98%).
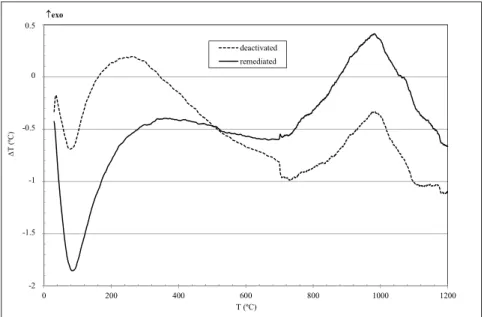
As described in the methodology, differential thermal analysis was intended to evaluate the ther-mal decomposition of the remediated and deactivated catalyst and to assess the stability of the material with respect to heating after the remediation process. Figure 6 presents the zeolite thermograms obtained from the DTA analysis.
-2 -1,5 -1 -0,5 0 0,5
0 200 400 600 800 1000 1200
Δ
T (
ºC)
T (ºC)
↑exo
deactivated remediated 0.5
0
-0.5
-1
-1.5
-2
The results of the DTA analysis indicate the oc-currence of two phenomena: an endothermic signal with two temperature peaks and an exothermic signal having only one temperature peak. The first endo-thermic peak occurred at 85 °C for both samples and is attributed to the loss of water molecules from the cavities of the zeolite or other volatile species that may be present. The largest peak amplitude for the remediated catalyst can be explained by the greater amount of moisture present in the material after remediation, despite the drying process.
A second endothermic peak with poorly defined characteristics has been mentioned in the literature (Trigueiro et al., 2002) and occurs between 300 and 800 °C. The peak is usually related to the loss of hy-droxyl groups from the zeolite structure. For the samples analyzed, this peak occurred at 720 °C for the deactivated catalyst and at 715 °C for the remedi-ated catalyst. According to Chandwadkar and Kul-karni (1980), lower dehydration temperatures are expected for zeolites with higher Si/Al ratios, as occurred with the remediated catalyst. It was also found that, for the remediated catalyst, the second endothermic peak showed a higher amplitude, or greater absorption of energy during the phase transi-tion, indicating a greater presence in the material of hydroxyl groups.
A third peak, which is exothermic and located be-tween 1000 and 1150 ° C (Gonçalves et al., 2010), is assigned to the collapse of the zeolite structure or a restructuring new phase and can be considered as a measure of the thermal stability of the zeolite. For the deactivated material, this peak occurred at 967 °C; for the remediated material, the peak occurred at 984 °C. The amount of energy liberation during the collapse of the Y zeolite structure can be indicated by the area of the exothermic signal. Its intensity was assumed to be proportional to the integrity of the three-dimensional structure in the catalyst.
Thus, the three peaks that occurred close to the values mentioned in the literature (Trigueiro et al., 2002; Gonçalves et al., 2010) point to no significant change in the thermal stability of the material due to the remediation process.
CONCLUSIONS
The study performed here shows that both the pH and the applied potential influence the amount of metal removed from the catalyst, as indicated by the pH profile and concentration profile of vanadium ions removed along the reactor, with a greater amount of vanadium ions being removed from the region near the anode.
The removal of metals was also indicated by the results of X-ray fluorescence, reaching a value of 30.93% for vanadium present in the catalyst, a mate-rial of great economic value that also made the catalyst a more aggressive environmental contaminant.
X-ray microtomography obtained an image that showed the removal of the materials with higher attenuation coefficients that are present on the outer surface of the catalyst particles. These materials are consistent with metals, as indicated by X-ray fluores-cence.
BET surface area analysis showed an increase in surface area, which most likely occurred by the re-lease of pores that had been blocked by metal parti-cles and also indicated that surface mass transport was enhanced compared to mass transport within the pores. Differential thermal analysis showed that elec-trokinetic remediation did not affect the thermal sta-bility of the material.
The results presented in this paper confirm the importance of conducting further studies to obtain maximum metal removal with the lowest economic cost in order to determine whether the process is an efficient technique for decontaminating catalysts.
ACKNOWLEDGEMENTS
Human Resources Program of the National Petro-leum Agency (PRH/ANP), National PetroPetro-leum Agency (ANP), Laboratory Analysis of Minerals and Rocks (LAMIR), FINEP, CTPETRO, Federal University of Parana (UFPR).
REFERENCES
Acar, Y. B., Gale, R. J., Alshawabkeh, N. A., Marks, R. E., Puppala, S., Bricka, M. and Parker, R., Electrokinetic remediation: Basics and technol-ogy status. J. Hazard. Mater., 40, p. 117-137 (1995). Alshawabkeh, A. N., Yeung, A. T. and Bricka, M. R.,
Practical aspects in-situ electrokinetic extraction. J. Environ. Eng., p. 125, 27-35 (1999).
Baptista, A., Evaluation of the potential recovery of metals from equilibrium catalysts by electroki-netic remediation technique. Master´s Thesis, Federal University of Parana (2005).
Biswas, J. and Maxwell, I. E., Recent process and catalyst related developments in fluid catalytic. Appl. Catal. A, 63, p. 197-258 (1990).
Cerqueira, H. S., Caeiro, G., Costa, L. and Ribeiro F. R., Desactivation of FCC catalyst. J. Mol. Catal. A, Chem., 292, p. 1-13 (2008).
behaviour of modified faujasites. J. Therm. Anal., 19, p. 313-320 (1980).
Creplive, M., Removal of vanadium from thermo-dynamically stable catalysts. Master´s Thesis, Federal University of Parana (2008).
Cruciani, G., Zeolites upon heating: Factors govern-ing their thermal stability and structural changes. J. Phys. Chem. Solids, 67, p. 1973-1994 (2006). Elicker, C., Sanches Filho, P. J. and Castagno, K. R.
L., Electroremediation of heavy metals in sewage sludge. Braz. J. Chem. Eng., 31(2), p. 365-371 (2014).
Escobar, A. S., Pereira, M. M. and Cerqueira, H. S., Effect of iron and calcium over USY coke forma-tion. Appl. Catal., A, 339, p. 61-67 (2008). Escobar, A. S., Pereira, M. M., Pimenta, R. D. M.,
Lau, L. Y. and Cerqueira H. S., Interaction between Ni and V with USHY and rare earth HY zeolite during hydrothermal deactivation. Appl. Catal., A, 286, p. 196-201 (2005).
Giannis, A., Pentari, D., Jing, Y. W. and Gidarakos, E., Application of sequential extraction analysis to electrokinetic remediation of cadmium, nickel and zinc from contaminated soils. J. Hazard. Mater., 184, p. 547-554 (2010).
Gonçalves, M. L. A., Vieira, M. D., Mota, D. A. P., Cerqueira, W. P. and Teixeira, A. R. F., Differential thermal analysis of a zeolite Y crystalline structure in a catalyst. J. Therm. Anal. Calorim., 101, p. 965-971 (2010).
Guaracho, V. V., Kaminari, N. M. S., Ponte, M. J. J. S. and Ponte, H. A., Central composite experi-mental design applied to removal of lead and nickel from sand. J. Hazard. Mater., 172, p. 1087-1092 (2009).
Han, I. S., Chung, C. B. and Riggs, J. B., Modeling of a fluidized catalytic cracking process. Comput. Chem. Eng., 24, p. 1681-1687 (2000).
Hubbell, J. H. and Seltzer, S. M., Tables of X-ray mass attenuation coefficients and mass energy-absorption coefficients from 1 keV to 20 MeV for elements Z = 1 to 92 and 48 additional substances of dosimetric interest, NISTIR 5632. Available in: <http://www.nist.gov/pml/data/xraycoef/index.cfm> (Accessed: April 2, 2015).
Lappas, A. A., Nalbandian, L., Iatridis, D. K., Voutetakis, S. S. and Vasalos, I. A., Effect of metals poison-ing on FCC products yields: studies in an FCC short contact time pilot plant unit. Catal. Today, 65, p. 233-240 (2001).
Li, D., Xiong, Z., Nie, Y., Niu, Y. Y., Wang, L. and Liu, Y. Y., Near focusing phenomenon caused by the
high anolyte concentration in the electrokinetic remediation of chromium(VI)-contaminated soil. J. Hazard. Mater., 229-230, p. 282-291 (2012). Ma, J. W., Wang, F. Y., Huang, Z. H. and Wang, H.,
Simultaneous removal of 2,4-dichlorophenol and Cd from soils by electrokinetic remediation com-bined with activated bamboo charcoal. J. Hazard. Mater., 176, p. 715-720 (2010).
Mathieu, Y., Corma, A., Echard, M. and Bories, M., Single and combined Fluidized Catalytic Cracking (FCC) catalyst deactivation by iron and calcium metal–organic contaminants. Appl. Catal., A, 469, p. 451-465 (2014).
Pamukcu, S., Weeks, A., Wittle, J. K., Enhanced re-duction of Cr (VI) by direct electric current in a contaminated clay. Environ. Sci. Technol., 38, p. 1236-1241 (2004).
Pinto, F. V., Escobar, A. S., Oliveira, B. G., Lam, Y. L., Cerqueira, H. S., Louis, B., Tessonnier, J. B., Su, D. S. and Pereira M. M., The effect of alumina on FCC catalyst in the presence of nickel and vana-dium. Appl. Catal., A, 388, p. 15-21 (2010). Puppala, S. K., Alshawabkeh, N. A., Acar, Y. B.,
Gale, R. J. and Bricka, M., Enhanced electroki-netic remediation of high sorption capacity soils. J. Hazard. Mater., 55, p. 203-220 (1997).
Tangstad, E., Myhrvold, E. M. and Myrstad, T., A study on the effect of sodium chloride deposition on an FCC catalyst in a cyclic deactivation unit. Appl. Catal., A, 193, p. 113-122 (2000).
Trigueiro, F. E., Monteiro, D. F. J., Zotin, F. M. Z. and Aguiar, E. F. S., Thermal stability of Y zeo-lites containing different rare earth cations. J. Alloy. Compd., 344, p. 337-341 (2002).
Trimm, D. L., Deactivation, regeneration and dis-posal of hydroprocessing catalysts. Stud. Surf. Sci. Catal., 53, p. 41-60 (1989).
Wang, J. Y., Huang, X. J., Kao, J. C. M. and Stabnik-ova, O., Simultaneous removal of organic con-taminants and heavy metals from kaolin using an upward electrokinetic soil remediation process. J. Hazard. Mater., 144, p. 292-299 (2007).
Yang, G. C. C., Lin, S. L., Removal of lead from a silt loam soil by electrokinetic remediation. J. Hazard. Mater., 58, p. 285-299 (1998).
Yeung, A. T., Milestone developments, myths and fu-ture directions of electrokinetic remediation. Sep. Purif. Technol., 79, p. 124-132 (2011).