Analysis of Inter cluster movement based on geometric
probability and regression
Rajee.A.M1, Sagayaraj Francis.F2 1
Department of CSE, Pondicherry Engineering College Puducherry 605014, India
2
Department of CSE, Pondicherry Engineering College Puducherry 605014, India
Abstract
This paper proposes an approach to study the behavior of clustering system, when unclustered data comes to the existing clustered setup. With the introduction of a new data point to the system, there is a possible occurrence of migration of points between clusters, resulting in re-clustering of the setup. An attempt was made to assess the inter cluster movement scenario, with geometric probabilistic approach and regression model, studying the possibility of migration initiated by the new data point which may be located at varying distance from the cluster center and simultaneously increasing the size of the clusters and dimension of the clustering data. A comparative study on the results obtained by both these models was framed and the results reveal lower relative error, which increases with increasing size and the dimension of the clustering system. Keywords: Data clustering, Geometric probability, Inter cluster movement, Probability of Migration, Regression Analysis.
1. Introduction
Clustering is the process of organizing objects into groups, whose members are similar in some way. A cluster is therefore a collection of objects which are
“similar” between them and are “dissimilar” to the objects belonging to other clusters. Cluster member are those data points belonging to the cluster.
Consider a clustered system built with well separated K clusters C1, C2, ---, CK. The system is static when no additional data enters the clustered setup. Suppose, when a new entrée comes, the centroids of the cluster gets changed and other data members gets reassigned to the nearest cluster, thereby signifying in the possible movement of data points between clusters. This is known as inter cluster movement or inter cluster migration. Technically, with the induction of a new input at d Euclidean distance to any of the closest cluster centers c1,
c2, ---, cK, there may be possible movement of data from one cluster to another, which is obviously triggered by the new entrée. An approach to predict this occurrence of inter cluster migration will result in the reduction of number of times re-clustering is done on the dataset. This paper uses the concept of geometric probability along with prediction analysis using regression to predict the afore mentioned cluster dynamics. This approach gives a special zest to the clustering system analysis, with a different diversified enhancement of the system.
The terms inter cluster movement and inter cluster migration stated throughout this paper proposes the movement of data points between clusters. The term distance mentioned throughout this paper represents the Euclidean distance of the new point to the closest cluster center cK. A cluster Ci is closest (or synonymously nearest) to cluster Cj if the Euclidean distance between their centers is smallest among each of the cluster pairs in the clustering system. We therefore refer Ci is closest to Cj and vice versa.
2. An overview of Geometric probability and
regression analysis
2.1 Geometric Probability
A probability is a number from 0 to 1 that represents the chance that an event will occur. Assuming that all outcomes are equally likely, an event with a probability of 0 cannot occur. An event with a probability of 1 is certain
to occur, and an event with a probability of 0.5 is just as likely to occur as not.
Measureof geometric mod el representing desired outcomesin theevent P(E)
Measureof geometric mod el representing alloutcomesin thesamplespace
(1) Geometric probability is better demonstrated by its practice in game application. A common game is darts. 2.2 Regression Analysis
Regression analysis uses data to identify relationships among variables and use these relationships to make predictions. The variable that is to be predicted (Yc) is called the dependent (or response) variable. The variable X is called the independent (or predictor, or explanatory) variable. The simple regression model is based on the equation for a straight line: Yc = A + BX
Where:
Yc = The calculated or estimated value for the dependent (response) variable
A = The Y intercept, the theoretical value of Y when X = 0
X = The independent (explanatory) variable
B = The slope of the line, the change in Y divided by the change in X, the value by which Y changes when X changes by one.
For a given data set, A and B are constants. They do not change as the value of the independent variable changes.
3. Related works
Regression analysis is used in clustering particularly in K Means in finding the appropriate number of clusters and testing the efficacy of K Means and other clustering algorithms. Various data sets including time series, heterogeneous data sets were used for clustering and subsequently regression parameters were involved to validate the correctness of the application. Correlation of regression analysis with clustering techniques was adopted by many researchers and few are as presented here.
Hongxing He, Jie Chen, Huidong Jin and Shu-Heng used K Means Clustering algorithm to partition stock price time series data[1]. After clustering, linear regression is used to analyze the trend within each cluster. Hammouda used simple regression technique and tested the accuracy and performance of four different clustering algorithms on various regression parameters including root mean squared error, regression line slope values[2]. Qian and Wu proposed a new regression based algorithm to
determine the number of clusters and other underlying regression parameters[3]. Geeta, Moin and Arvinder considered heterogeneous software engineering data sets and classified into different clusters[4]. A combination of clustering and regression techniques can be used to reduce the potential problem in effectiveness of predictive efficiency due to heterogeneity of the data.
Emre, Ijker and Murat executed simulation model of a system and using K Means algorithm which created a regression model which are known as meta models for each cluster[5]. This approach increases the accuracy of clustering meta model, thereby decreasing sum of squared value. Qin and G.Self proposed a new clustering method, the clustering of regression models (CORM) method employs regression to model gene expression and clusters genes based on their relationship between expression levels and sample covariates[6].
4. Implementation of geometric probability in
predicting inter cluster movement
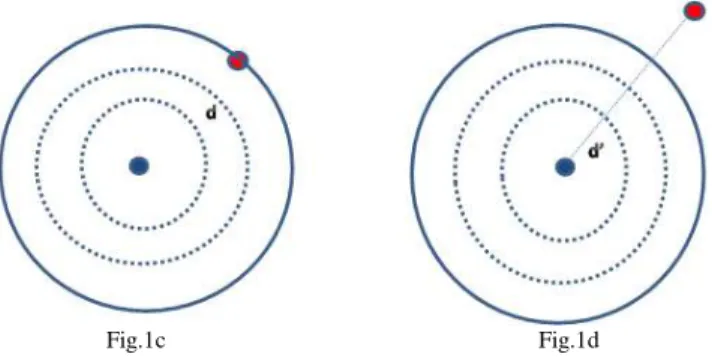
K clusters C1, C2…. CK with corresponding centers c1, c2,…. cK were built and presented as circles for this study. A new data point was introduced with distance d around ck. The new point may either be located as shown in figures 1a, 1b, 1c, 1d or at an arbitrary distance around cK.
The chance of any new point within the boundary of Ck effecting inter cluster migration is apparently nil. Let P(d) be the probability of migration when a new data
point is placed at a distance d. Let P’= [P(d), P(d+), P(d+2), P(d+3),………., P(d+n)] signifies the probability of migration with respect to increase in distance d.
Fig.1c Fig.1d
Fig.1a, 1b, 1c. Data point introduced at distance d from the cluster center. Fig 1d. Occurrence of Inter cluster movement, when the data point comes at
distance d’
Figures 1a, 1b and 1c signify the data point located at increasing distance d from its closest cluster center. The solid circle represents an outermost boundary of the cluster. The dotted circle signifies the possible location of the data point at increasing distance from its closest cluster center.
A data point introduced at a distance d’ as shown in Fig
1d, causes movement of points between the clusters.
Hence at d’, the probability of inter cluster migration is 1. Below d’, the probability ranges from 0 p < 1. A zero probability is achieved when the new data point comes very close to c1.
The geometric probability of occurrence of inter cluster movement is calculated as in (2).
Area of the cluster where the new entree comes
Area of thecluster where the int er cluster movement originally happened with previous data point s
(2) Applying (2), with increasing distance d, we get corresponding probability values as in Table 2.
Table 1: Probability of inter cluster movement at varying distance of the data point
Distance d from cluster center c1
(Xi)
Probability of Migration (in %)
(Yi)
5 0.082195
30 2.959031
50 8.219531
75 18.49395
100 32.87812
150 73.97578
170 95.01778
174.4 100
175 100
180 100
185 100
Inter Cluster Movement starts from the distance 174.4 (shown in bold) in column 1. Hence probability of migration is 100% from 174.4.
The probability (p) of inter cluster movement (0 p 1) increases with increasing distance of the new data point. This is evident from Fig.2 with horizontal axis representing distance and the vertical axis is the probability of migration of data points between clusters. The probability is 0, when the new data point is positioned very close to cK, such that no inter cluster movement occurs. As the new data point moves farther away from ck, the probability increases. At one stage, the
probability is 1, when the distance d’ causing inter cluster
movement is identified and continues to be 1, with
increasing d’.
Fig. 2. Distance versus Probability of migration between clusters.
5. Implementation of regression analysis in
predicting inter cluster movement
The prediction of inter cluster movement is carried out using regression analysis. In Table 1, the Xi column (independent variable) is the distance d from cluster center c1 and Yi column (dependent variable) is the probability of migration based on geometric model. With this input, a regression equation Y= A + BX is established and is used to predict the probability of migration induced by the new data point(Y), given any value of distance from its center(X). After solving A and B, the regression
equation becomes Y=
-19.3453798422621+0.60951798708451X.
6. Experimental results and Analysis
Consider a data point induced at a distance 174 from c1. The probability (P) of inter cluster movement was calculated by executing K Means Clustering algorithm for varying number of clusters. Also, a better prediction of
probability (P’) of inter cluster migration was established
from regression. The variation of experimental probability
(P) from the predicted probability (P’) is computed as
relative error. Table 2 and Fig. 2 gives the result for the data point introduced at a distance 174 from cluster center c1.
Table 2:Experimental probability and predicted probability results for the data point located at distance 174 from c1 with increasing size of the 2
dimensional clusters
Number of Clusters
Observed Geometric Probability (P)
Predicted Probability
from regression
(P’)
Relative Error
2 99.54181 98.128674 1.419641
3 78.75391 76.43655 2.942533
4 52.48694 54.8674 4.535338
5 47.9422 50.7634 5.884586
6 36.23851 38.89174 7.321576
7 28.94238 31.18463 7.74729
8 20.47262 22.571553 10.25239 9 14.428401 16.03273 11.11924
10 10.1761 11.6511 14.49475
Fig. 3. Number of Clusters and the relative variation in probability of migration
From Figure 3, it is obvious from the results that with the increase in size of the clusters, the relative variation in
probabilities of migration (P and P’) also increases.
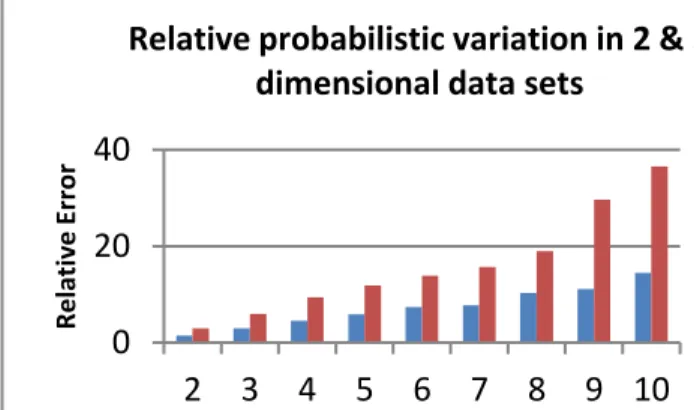
Experiments were also performed on 2 and 3 dimensional data sets for Clusters Ck k = 2, 3, 4… 10. Fig.4 shows the results. The relative variation in the probabilities of migration increases with the increase in the cluster size as evident from Fig.4.
0
20
40
2
3
4
5
6
7
8
9
10
R
e
lativ
e
E
rr
o
r
Cluster size
Relative probabilistic variation in 2 & 3
dimensional data sets
Fig. 4. Probabilistic variation with multi-dimensional data sets
7. Conclusion
One of the behaviors of the clustering system is the movement of points between clusters to accommodate a new entrée. A probabilistic based approach wrapped with the prediction based on regression would emerge as model to forecast this cluster migration, which in turn serves to avoid repeated re-run of clustering algorithm. Thus, this possible clustering system dynamics was viewed within the purview of geometric probability and regression. On experimental results and analysis, it was inferred that an increasing relative error is due to increasing the size of the clusters and dimensions of the data. However, the variations are with significantly acceptable lower error rate and can easily be controlled.
References
[1] Hongxing He, Jie Chen, Huidong Jin and Shu-Heng,
“Trading strategies based on K Means clustering and Regression models”, Computational Intelligence in Economics and Finance”, Volume II, pp,123-134, 2007.
[3] Guoqi Qian and Yuehua Wu, “ Estimation and Selection in
Regression Clustering”, European Journal of Pure and
Applied Mathematics, Vol. 4, No. 4, 2011.
[4] Geeta Nagpal, Moin Uddin, Arvinder Kaur, “Analyzing software effort estimation using k means clustered
regression approach”, ACM SIGSOFT Software Engineering
Notes, Volume 38 Issue 1, January 2013.
[5] Emre Infanoglu, Ijker Akgun, Murat.M.Gunal,
“Metamodeling by using multiple regression integrated K
-means clustering algorithm”, In Proceedings of the
Emerging M&S Applications in Industry & Academia / Modeling and Humanities Symposium EAIA and MatH, 2013
[6] Li-Xuan Qin and Steven G. Self, “On Comparing the Clustering of Regression Models Method with K-means
Clustering”, Memorial Sloan- Kettering Cancer center, Department of Epidemiology and Bio-statistics, Working paper series 2007.
Rajee.A.M received B.E degree in Computer science and engineering from Bharathidasan University, Tamilnadu, India in 2002 and M.Tech degree in Computer engineering from Manonmaniam Sundaranar University, Tamil nadu, India in 2004. She has got 8 years of academic experience in various engineering college. Currently she is a Full time doctoral student in computer science and engineering at Pondicherry Engineering College, Puducherry, India. Her research areas are Data clustering analysis and techniques. She has published 3 research articles in various conferences and won 1 Best Paper Award.