www.atmos-meas-tech.net/8/4785/2015/ doi:10.5194/amt-8-4785-2015
© Author(s) 2015. CC Attribution 3.0 License.
Assessing 5 years of GOSAT Proxy XCH
4
data and
associated uncertainties
R. J. Parker1,2, H. Boesch1,2, K. Byckling1, A. J. Webb1, P. I. Palmer3,4, L. Feng3,4, P. Bergamaschi5, F. Chevallier6, J. Notholt7, N. Deutscher7,11, T. Warneke7, F. Hase8, R. Sussmann8, S. Kawakami9, R. Kivi10, D. W. T. Griffith11, and V. Velazco11
1Earth Observation Science, Department of Physics and Astronomy, University of Leicester, Leicester, UK
2National Centre for Earth Observation, Department of Physics and Astronomy, University of Leicester, Leicester, UK 3School of GeoSciences, University of Edinburgh, Edinburgh, UK
4National Centre for Earth Observation, School of GeoSciences, University of Edinburgh, Edinburgh, UK 5European Commission Joint Research Centre, Institute for Environment and Sustainability, Ispra, Italy 6Lab. des Sciences du Climat et de l’Environnement, CNRS, Gif-sur-Yvette, France
7Institute of Environmental Physics, University of Bremen, Bremen, Germany 8Karlsruhe Institut für Technologie, Karlsruhe, Germany
9Japan Aerospace Exploration Agency (JAXA), Tsukuba, Japan 10Finnish Meteorological Institute, Arctic Research, Sodankylä, Finland 11School of Chemistry, University of Wollongong, Wollongong, Australia Correspondence to:R. J. Parker ([email protected])
Received: 5 May 2015 – Published in Atmos. Meas. Tech. Discuss.: 17 June 2015 Revised: 20 October 2015 – Accepted: 29 October 2015 – Published: 17 November 2015
Abstract.We present 5 years of GOSAT XCH4retrieved
us-ing the “proxy” approach. The Proxy XCH4 data are
val-idated against ground-based TCCON observations and are found to be of high quality with a small bias of 4.8 ppb (∼0.27 %) and a single-sounding precision of 13.4 ppb (∼
0.74 %). The station-to-station bias (a measure of the rela-tive accuracy) is found to be 4.2 ppb. For the first time the XCH4/XCO2ratio component of the Proxy retrieval is
val-idated (bias of 0.014 ppb ppm−1(∼0.30 %), single-sounding
precision of 0.033 ppb ppm−1(∼0.72 %)).
The uncertainty relating to the model XCO2component
of the Proxy XCH4is assessed through the use of an
ensem-ble of XCO2 models. While each individual XCO2 model
is found to agree well with the TCCON validation data (r=0.94–0.97), it is not possible to select one model as the best from our comparisons. The median XCO2value of
the ensemble has a smaller scatter against TCCON (a stan-dard deviation of 0.92 ppm) than any of the individual mod-els whilst maintaining a small bias (0.15 ppm). This model median XCO2is used to calculate the Proxy XCH4with the
maximum deviation of the ensemble from the median used as an estimate of the uncertainty.
We compare this uncertainty to the a posteriori retrieval error (which is assumed to reduce with sqrt(N)) and find typ-ically that the model XCO2uncertainty becomes significant
during summer months when the a posteriori error is at its lowest due to the increase in signal related to increased sum-mertime reflected sunlight.
We assess the significance of these model and retrieval un-certainties on flux inversion by comparing the GOSAT XCH4
against modelled XCH4 from TM5-4DVAR constrained by
4786 R. J. Parker et al.: Assessing 5 years of GOSAT Proxy XCH4data and associated uncertainties
1 Introduction
Atmospheric methane (CH4) contributes significantly to the
Earth’s radiative forcing budget (Myhre et al., 2013), mak-ing it the second most important anthropogenic greenhouse gas after carbon dioxide (CO2). The major sources of
atmo-spheric methane include wetland emission, rice production, enteric fermentation (cattle), termites, biomass burning, fos-sil fuel production, and waste (Bousquet et al., 2006). There remains, however, a large degree of uncertainty on the mag-nitude of these individual sources (Kirschke et al., 2013).
The lifetime of CH4in the atmosphere is mainly controlled
by its reaction with the hydroxyl free radical (OH), resulting in an atmospheric lifetime of approximately 9 years (Prather et al., 2012). Given its long atmospheric lifetime, there is a need for long-term global measurements to fully under-stand how the atmospheric distribution of CH4 is evolving
with time. Indeed, recent unexpected variability in the at-mospheric growth rate of methane has emphasised gaps in our current understanding (Rigby et al., 2008; Dlugokencky et al., 2009; Nisbet et al., 2014).
In order to begin to understand the spatio-temporal distri-bution of atmospheric methane, regular global satellite ob-servations of CH4can be coupled with highly precise but
ge-ographically sparse surface concentration data. Through the combination of both data sources, the large uncertainties re-lated to the upscaling of surface concentration data can be minimised whilst also obtaining information in remote re-gions where surface measurements are not available.
Various studies have demonstrated the utility of such space-borne measurements in determining the regional sur-face fluxes of methane using data from the SCIAMACHY (Bergamaschi et al., 2007, 2009, 2013; Houweling et al., 2014) and Greenhouse gases Observing SATellite (GOSAT) (Fraser et al., 2013; Cressot et al., 2014; Monteil et al., 2013; Alexe et al., 2015) instruments.
The SCIAMACHY instrument operated onboard EN-VISAT and provided a 9-year record (2003–2012) of global methane total column observations (Schneising et al., 2011; Frankenberg et al., 2011). The continuation of this time se-ries of space-based observations was ensured by the launch of the first dedicated greenhouse gas measuring satellite, the Japanese GOSAT, in 2009 (Yokota et al., 2009). GOSAT pro-vides global coverage with a 3-day repeat cycle and was de-signed with the intention of characterising continental-scale sources and sinks.
In a previous work (Parker et al., 2011) we presented the first year of our global short-wave infrared (SWIR) mea-surements of the dry-air column-averaged mole fraction of CH4 (XCH4) from the GOSAT mission using the “proxy”
retrieval approach. This data product has subsequently been developed (Buchwitz et al., 2013) and validated (Dils et al., 2014) as part of the ESA Climate Change Initiative Green-house Gas project and we now report an assessment of the
full 5-year data set for version 5.0 of the University of Le-icester GOSAT Proxy XCH4data product.
This work is motivated by the desire to better understand the uncertainty characteristics of the Proxy XCH4 data for
use within flux inversion systems, especially relating to un-certainties introduced by the model XCO2.
In Sect. 2 we describe the retrieval approach, including details of the updates since the original version of the Uni-versity of Leicester GOSAT Proxy XCH4data (Parker et al.,
2011). In Sect. 3 we compare both the Proxy XCH4and the
XCH4/XCO2ratio against the ground-based validation data.
In Sect. 4 we assess the CO2model component of the Proxy
XCH4for the first time, with Sect. 5 then discussing the
as-sociated uncertainty of the final Proxy XCH4 product and
its utility in constraining surface fluxes within an inversion framework. Finally, we conclude the paper in Sect. 6 and pro-vide recommendations for data users.
2 University of Leicester GOSAT Proxy XCH4
retrieval updates
The University of Leicester GOSAT Proxy XCH4
re-trieval utilises the Orbiting Carbon Observatory (OCO) “full physics” retrieval algorithm, developed for the origi-nal NASA OCO mission to retrieve XCO2(dry-air
column-averaged mole fraction of CO2) from a simultaneous fit of
SWIR O2and CO2bands and has subsequently been
modi-fied to operate on GOSAT spectral data.
Full details of the OCO retrieval algorithm can be found in O’Dell et al. (2012). In short, the retrieval algorithm utilises an iterative retrieval scheme based on Bayesian optimal esti-mation to estimate a set of atmospheric, surface, and instru-ment parameters from the measured spectral radiances, re-ferred to as the state vector. The state vector of our retrieval consists of 20-level profiles for CH4and CO2volume mixing
ratios (vmr), profile scaling factors for H2O vmr, and
temper-ature, surface albedo, and spectral dispersion.
Rather than perform the “full physics” retrieval as typi-cally used for CO2(Connor et al., 2008; Boesch et al., 2011),
an alternative approach is possible for CH4, the so-called
“proxy” method. First used for the retrieval of XCH4from
SCIAMACHY (Frankenberg et al., 2006), this approach uses the fact that there exists CO2 and CH4 spectral signatures
located close together at around 1.6 µm and hence the ma-jority of atmospheric scattering and instrument effects will be similar between the two bands. The ratio of the retrieved XCH4/XCO2should cancel modifications to the length of
the light path that are experienced due to scattering (Butz et al., 2010), with the CO2 effectively acting as a “proxy”
for the unknown light-path enhancements. As CO2is known
to vary much less than CH4, the final XCH4product can be
obtained by multiplying this XCH4/XCO2ratio by a model
CO2value, typically taken from a global chemistry transport
ProxyXCH4=[XCH4] [XCO2]
×ModelXCO2 (1)
The “proxy” retrieval approach has various advantages over the full physics approach (Schepers et al., 2012). Because there is no reliance on an explicit a priori knowledge of the aerosol distribution, the proxy approach is more robust in the presence of aerosols and also far less sensitive to instrumen-tal issues or inconsistent radiometric calibration between the spectral bands than is the case for the full physics approach. Additionally, as moderate scattering from aerosols will be cancelled out and still result in an accurate retrieval of XCH4,
the number of successful soundings for the proxy approach is typically much higher than for the full physics approach which requires far stricter post-filtering. This leads not only to more soundings in general but also to more soundings over regions where very little full physics data may be available, such as in the tropics.
The main disadvantage with the proxy approach is that it is reliant on an accurate, unbiased model XCO2data set to
convert the XCH4/XCO2ratio back into an XCH4quantity;
otherwise errors relating to the model XCO2may be folded
into the final XCH4result. Here we present assessments of
the different uncertainties to determine the importance of this aspect of the Proxy XCH4data.
We process the latest versions of the GOSAT Level 1B files (version 161.160) acquired directly from the NIES Large Volume Data Server and apply the recommended ra-diometric calibration and rara-diometric degradation correction as per Kuze et al. (2014).
For the spectroscopic inputs we use v4.2.0 of the OCO line lists with CH4taken from the Total Carbon Column
Ob-serving Network (TCCON) line lists (version “20120409”). The a priori pressure, temperature, and water vapour is taken from the ECMWF ERA-Interim data (Dee et al., 2011). For the CO2a priori we use the MACC-II CO2inversion (v13r1)
and for the CH4we use the MACC-II CH4inversion
(v10-S1NOAA, using 2012 data for 2013) but here we adjust the stratospheric methane using a specialised full chemistry run (run ID 563) of the TOMCAT stratospheric chemistry model from the University of Leeds (Chipperfield, 1999). This TOMCAT model run has been validated against ACE-FTS observations and was found to provide a more accurate representation of the stratosphere.
The spectral noise is estimated from the standard devia-tion of the out-of-band signal. Spectra over ocean or with a signal-to-noise ratio (SNR) below 50 are removed. Cloud-contaminated scenes are removed by the comparison of a clear-sky surface pressure retrieval from the O2 A-band
to the ECMWF surface pressure for the relevant measure-ment time and location. A scene is determined to be cloudy when the retrieved surface pressure differs by more than 30 hPa from the estimated ECMWF surface pressure. This relatively loose threshold is allowed as the proxy retrieval
approach remains relatively robust in the presence of near-surface clouds. The average difference between our retrieved surface pressure and ECMWF after filtering for cloud is ap-proximately 3 hPa with a standard deviation of below 10 hPa, with the offset from 0 hPa being attributed to spectroscopic uncertainties in the O2cross-sections. The Proxy XCH4
re-trieval is performed for all scenes that are deemed to be suf-ficiently cloud free.
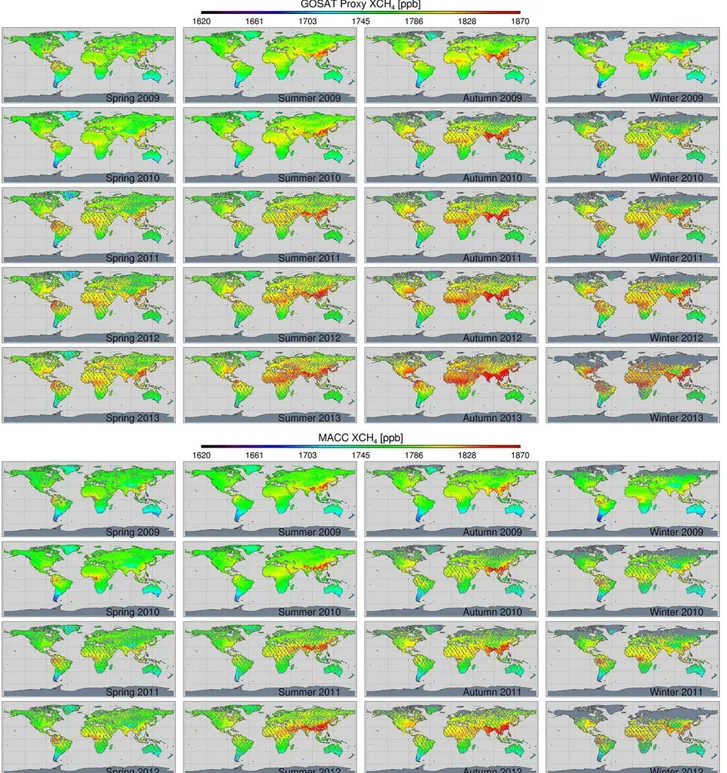
After filtering for signal-to-noise, cloud, and data quality we are left with 1 032 760 XCH4retrievals over land between
April 2009 and December 2013. Figure 1 shows global maps of the Proxy XCH4for each season and compares it to the
MACC-II model XCH4 data. Both model and observation
show the XCH4 variability in time and space, in particular
with the large emissions of methane from wetland and rice cultivation over India and S.E. Asia.
3 Validation of the Proxy XCH4and XCH4/XCO2
ratio
This section presents the validation of the University of Le-icester GOSAT Proxy XCH4 v5.0 data through comparison
to observations from the ground-based TCCON. In addition, for the first time the XCH4/XCO2ratio itself, the core
com-ponent of the Proxy XCH4data, is validated against the
cor-responding TCCON data.
TCCON is a global network of ground-based high-resolution Fourier transform spectrometers recording direct solar spectra in the near-infrared spectral region (Wunch et al., 2011a). The TCCON data are calibrated to World Meteorological Organization (WMO) standards by calibra-tion against aircraft measurements (Wunch et al., 2010). Al-though it should be noted that this aircraft calibration does not measure the whole column, the TCCON data are the stan-dard against which current satellite observations of green-house gases are validated (Cogan et al., 2012; Wunch et al., 2011b; Dils et al., 2014).
To date, all previous validation of satellite greenhouse gas observations against TCCON has used TCCON data that were affected by instrumental biases relating to a laser sam-pling error which resulted in an XCO2error of approximately
0.26 % (1 ppm) (Messerschmidt et al., 2010). Although the corresponding XCH4error was not quantified, it is expected
that it would be of similar magnitude (i.e. 1 part in 400). The latest, recently released, version of the TCCON data (GGG2014) incorporates a correction for the laser sampling errors and any remaining bias is expected to be small.
Figure 2 shows the GGG2014 TCCON XCH4data and the
Proxy XCH4plotted as time series for each TCCON site. The
4788 R. J. Parker et al.: Assessing 5 years of GOSAT Proxy XCH4data and associated uncertainties
Figure 1.Seasonal global maps of the University of Leicester GOSAT Proxy XCH4(top) and the MACC-II (bottom) model XCH4data (v10-S1NOAA). Both model and observation show the XCH4variability in time and space, in particular with the large emissions of methane from wetland and rice cultivation over India and S.E. Asia. Note that GOSAT changed their pointing pattern in August 2010 from five across-track points to three across-track points, resulting in a change in spatial coverage.
Figure 3 (top) shows the correlation between the GGG2014 TCCON XCH4 data and the Proxy XCH4
val-ues within ±5◦of each TCCON site and a temporal coin-cidence of±2 h. It should also be noted that for all TCCON comparisons, the difference inherent in the data due to using different a priori has been compensated for (as discussed in
Rodgers (2000), by replacing the a priori used in the GOSAT retrievals with the TCCON a priori after the retrieval has been performed) which typically increases the GOSAT XCH4data
Figure 2.GGG2014 TCCON XCH4data and the Proxy XCH4plotted as time series for each TCCON site. The mean GOSAT−TCCON dif-ference, the standard deviation of the GOSAT−TCCON difference, the correlation coefficient, and the number of soundings are all provided for each site.
of writing that contain data during the GOSAT time period (2009–2014). This results in 11 TCCON stations ranging from Sodankylä, Finland, at 67.4◦N to Lauder, New Zealand, at 45.0◦S. The correlation between the GOSAT and TCCON data is reasonable/good across all sites, ranging from 0.54 at Karlsruhe to 0.79 at Lauder with an overall correlation coeffi-cient of 0.87 between 22 619 points. The overall bias is found to be 4.8 ppb with an overall single measurement precision of 13.4 ppb (ranging from 8.3 ppb at Darwin to 14.9 ppb at Garmisch). The station-to-station bias, which is an indica-tion of the relative accuracy, is calculated as the standard de-viation of the individual site biases and is found to be just 4.2 ppb.
In addition to the validation of the Proxy XCH4 data,
we also present for the first time the validation of the XCH4/XCO2 ratio. This ratio is the quantity directly
re-trieved from the satellite measurement, is independent of any model XCO2, and has recently itself been used directly
within a flux inversion study (Fraser et al., 2014). The cor-relation coefficient across all stations is found to be 0.88 (ranging from 0.6 at Wollongong to 0.88 at Sodankylä) with a mean bias of 0.014 ppb ppm−1and a single-sounding
pre-cision of 0.033 ppb ppm−1(ranging from 0.20 ppb ppm−1at
Darwin to 0.037 ppb ppm−1at Garmisch). The statistics for
the XCH4/XCO2ratio are therefore comparable to those of
the Proxy XCH4 itself, suggesting that the majority of the
variation is from the satellite retrieval itself and not intro-duced by the model XCO2. The next section investigates this
aspect in more detail.
4 Assessing the CO2model ensemble component
In Sect. 3 the final Proxy XCH4and the XCH4/XCO2
com-ponent were both validated against the TCCON data. In this section we validate the remaining component of the proxy product from Eq. (1), namely the model XCO2.
As discussed in Sect. 2, this update to the University of Le-icester GOSAT Proxy XCH4data uses an ensemble of model
XCO2data to act as the model XCO2component. We utilise
the XCO2from three state-of-the-art global transport models
which all assimilate surface in situ measurements; GEOS-Chem (University of Edinburgh – Feng et al., 2011, v1.50), MACC-II (Chevallier et al., 2010, v14r1) and CarbonTracker (NOAA – Peters et al., 2007, vCT2013B). These model runs have assimilated similar surface measurements but not nec-essarily from all of the same data sets or the same locations. The models also have different spatial resolutions and differ-ent temporal coverage (GEOS-Chem: 2009–2011, 5◦×4◦; CarbonTracker: 2009–2012, 3◦×2◦; MACC-II: 2009–2012, 3.75◦×1.89◦). Where the model does not cover the full GOSAT time period studied here, the data from the previ-ous year are used and adjusted by the NOAA annual growth rate.
The main concern with using modelled XCO2data for the
proxy method is that the additional uncertainty added to the final proxy data product is difficult to determine. Where the model XCO2data are constrained by surface data there can
be a high degree of confidence that the model data are close to representing the true value of CO2; however, it is away
from such regions where there is a possibility of adding ad-ditional biases into the Proxy XCH4data. The TCCON
sta-tions are mostly in regions that are also well constrained by surface in situ measurements and hence the model CO2data
should be well constrained, at least at the surface level, and it is therefore expected to reasonably reproduce the TCCON column data. Figure 4 confirms that this is the case. As the model XCO2is used as a component in the proxy retrievals,
the models are treated as “pseudo-measurements” and vali-dated in the same way as the satellite data in order to maintain consistency with the satellite validation. The model XCO2
4790 R. J. Parker et al.: Assessing 5 years of GOSAT Proxy XCH4data and associated uncertainties
Figure 3.Correlation plot of the Proxy XCH4(top) and the XCH4/XCO2ratio (bottom) data against TCCON ground-based FTS data at 11 TCCON sites. The overall bias, standard deviation (single-sounding precision), correlation coefficient, and total number of soundings are provided. Note that the Lauder TCCON station upgraded the instrument from a Bruker 120 to a Bruker 125 in February 2010 and these two data sets are displayed separately.
TCCON data, with the correlation coefficients ranging from 0.94 (GEOS-Chem) to 0.97 (MACC-II and CarbonTracker). Similarly the precision and bias to TCCON are both found to be small (ranging from 0.97 to 1.3 and 0.07 to 0.27 ppm respectively). The relative accuracies (the standard deviation of the individual site biases) are similar at around 0.5 ppm, with CarbonTracker and GEOS-Chem performing slightly better than MACC-II. Another metric to assess the models is how often they provide the median value of the ensem-ble. CarbonTracker (41 %) and MACC-II (36 %) tend to pro-vide the median value more often than GEOS-Chem (22 %) but this can vary per site with the contribution from MACC-II as low as 27 % at Darwin (and CarbonTracker at 60 %) and conversely as high as 44 % at Wollongong (with Carbon-Tracker only 21 %). This provides further indication that no one model can be determined to be the “best”.
For a more detailed analysis of the performance of the dif-ferent XCO2models please see Table A1 in Appendix A. In
short, none of the models are found to consistently be su-perior over the other models. GEOS-Chem typically has the highest scatter against TCCON but also has the smallest bias at 5 out of 12 of the sites. MACC-II has the smallest bias at seven sites but the highest bias at four of the sites. Carbon-Tracker has the highest bias at seven of the sites but also has the smallest scatter at eight of the sites. Whilst the absolute bias in the calculated median XCO2is typically not quite as
small as the best of the individual models, the scatter in the median is better than (or the same as) the best scatter from any of the individual models at every site except Lauder_120 (where the time series is the shortest) and even there it is only worse than the best model by less than 0.1 ppm.
The above has demonstrated that it is not a simple deci-sion to determine which model most accurately represents the true atmosphere, even in locations where all of the mod-els have been constrained by (often the same) surface mea-surements and high-quality validation data are available. In more remote regions where we neither have validation data nor surface measurements to constrain the models, this in-consistency between the models becomes more pronounced. It is this uncertainty in model XCO2in regions away from the
available validation data that we attempt to address through the use of the XCO2 model ensemble. Each of the three
XCO2 models are sampled at every GOSAT time and
lo-cation and convolved with the scene-specific GOSAT aver-aging kernels. The median value of the three model values is used as the model XCO2 in calculating the final Proxy
XCH4. However, we also define the uncertainty on this
me-dian XCO2 as the maximum of the absolute differences of
each individual model to the median value.
We have already demonstrated that the models all well reproduce the validation data at TCCON sites without any one model identified as being better than the others from our comparisons. Where the models all agree well with each other away from the validation sites, the assumption is that the models are accurately representing the true atmosphere.
Where the models disagree with each other, we do not know which model is correct in the absence of further validation data and in some cases the discrepancy between models can be very large (i.e. >4 ppm). In such cases where no val-idation is possible, the best estimate of the uncertainty in the model XCO2 data is obtained by examining the
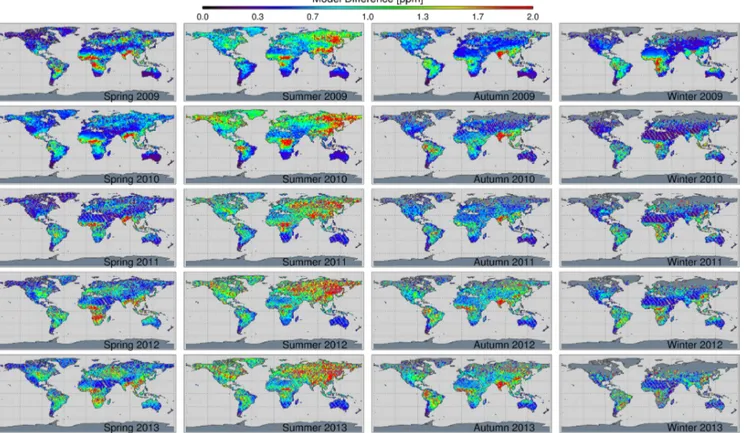
dif-ference of the model data around the median value. Fig-ure 5 shows global maps of this estimated model uncertainty for each season. There are clear spatial/temporal patterns in the distribution of this model uncertainty. During March– May (boreal “spring”), there is a large uncertainty (>2 ppm) over India and the African regions typically associated with biomass burning. There is also a moderate level of uncer-tainty (>1 ppm) over Europe, South America, and for the latter years over North America and Australia. For the sum-mer months (June–August) it is the Eurasian region, extend-ing from the Ural mountains eastwards through Siberia and northern China, where the model uncertainty is largest at over 2 ppm. This is to be expected as in the Northern Hemi-sphere it is the period of greatest photosynthetic activity and the model sensitivity to the underlying mechanisms is likely to be largest. During boreal autumn (September–November), the uncertainty in the Northern Hemisphere is vastly re-duced again, with India being the major region of uncertainty along with South America and regions of biomass burning in Africa. Winter is similar to autumn, with all three models in very good agreement with each other in the Northern Hemi-sphere, with only S.E. Asia showing a moderate level of un-certainty. In the Southern Hemisphere, again South America and southern Africa show moderate uncertainty which ap-pears to be linked to emissions from biomass burning.
This section has shown that the estimated uncertainty of the model XCO2can vary greatly in time and space. When
considering the implication of this uncertainty on flux in-versions of the Proxy XCH4data, the relative importance of
the different uncertainties must be considered. The following section investigates the distribution of the model XCO2
un-certainty and judges its relative importance against the a pos-teriori error from the retrieval itself. Finally, both of these uncertainties are assessed against the difference to modelled XCH4already constrained by surface observations to
deter-mine the utility of the satellite data despite the presence of these uncertainties.
5 Assessing the relative uncertainties
In order to assess the importance of the uncertainty of the model XCO2, we bin the three model fields into 4◦×5◦grid
boxes over 8-day time steps and calculate the maximum dif-ference of the three-model ensemble from the median value to use as an estimate of the uncertainty in the model values. We convert this uncertainty in model XCO2into an
uncer-tainty in XCH4 by multiplying each point by its respective
av-4792 R. J. Parker et al.: Assessing 5 years of GOSAT Proxy XCH4data and associated uncertainties
Figure 5.Seasonal maps of the model difference, defined as the maximum absolute difference of the three-model ensemble from the median. All individual soundings have been averaged into 2◦×2◦grid boxes over each season. The largest uncertainties occur in regions where the CO2variability is expected to be highest and the models are unconstrained by surface measurements.
Figure 6.The Transcom regions over which the 4◦×5◦ gridded data are then averaged in Fig. 7.
erage a posteriori error for the same data. Unlike the more systematic XCO2 model uncertainty, the a posteriori error
should be close to random and hence reduce approximately with the square root of the number of soundings being aver-aged. If the error does not reduce as much, the model XCO2
component would then contribute even less to the total, lead-ing to this assumption belead-ing a “worst case” scenario for the effect of the model XCO2 uncertainty. These 4◦×5◦ grid
boxes are then themselves averaged over the Transcom re-gions (Gurney et al., 2002) as defined in Fig. 6.
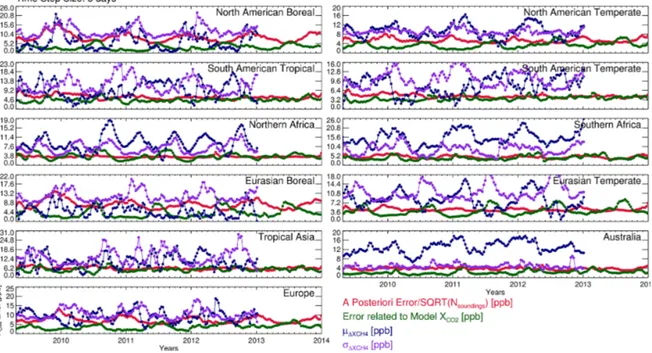
In Fig. 7, the red line shows the mean of the Proxy XCH4
random (a posteriori) error from each 4◦×5◦box averaged over each Transcom region with the green line representing the estimated uncertainty related to the model XCO2. The
majority of regions exhibit a similar trend over time. The a posteriori error peaks in the winter months when the SNR of the measurement is at its lowest and is at a minimum dur-ing the summer months when the SNR is at a maximum. This seasonal effect is more pronounced at higher latitudes which experience a greater degree of variability of sunlight through-out the year. Conversely, the XCO2 model uncertainty
fol-lows biospheric activity with the uncertainty largest during the summer months when the XCO2variability is at a
maxi-mum and reduces to a minimaxi-mum in the winter months when biospheric activity is lower. This leads to the situation where the a posteriori error dominates the model uncertainty in win-ter months but during summer months the model uncertainty can be comparable to, or even exceed, the a posteriori error. Taking the North America Temperate region as an example, during winter the a posteriori error can reach up to 8 ppb with the error from the model XCO2significantly lower with
val-ues less than 2 ppb. In contrast, during the summer months, the a posteriori error reduces to around 5 ppb but the error for the model XCO2 increases to 5 ppb, meaning that both
We have shown that the uncertainty related to the XCO2
model can, particularly in the Northern Hemisphere during summer months, be of comparable magnitude to the a poste-riori retrieval error. However, that in itself does not preclude the data from adding useful information to a CH4flux
inver-sion.
The MACC-II model XCH4(v10-S1NOAA) data have
as-similated NOAA surface measurements at background sites and hence are well constrained in the remote atmosphere (Bergamaschi et al., 2013). Here we calculate the differ-ence between the MACC XCH4model field and the GOSAT
Proxy XCH4data for each GOSAT measurement (referred to
from here as1XCH4). We then aggregate these differences
in the same way as the model XCO2uncertainties. Note that
the MACC XCH4 model data are currently only available
until the end of 2012. As some inversion systems will per-form a simple (e.g. latitudinal) bias correction, the calculated retrieval a posteriori and model XCO2uncertainties can
po-tentially be much lower than the1XCH4value but still not
provide information to the inversion. For this reason, it is also important to consider both the mean (µ1XCH4) and the
standard deviation (σ1XCH4) of the1XCH4. To determine
whether the GOSAT data are capable of providing informa-tion to the inversion, we compare the a posteriori and model XCO2uncertainties to the µ1XCH4 andσ1XCH4 values as
shown in Fig. 7, with the seasonal averages for all of these values presented in Table A2.
It should be noted here that the absolute values are not nec-essarily quantitatively comparable when taking into account how an inversion system will use the two different quantities. The a posteriori error of the retrieved XCH4is an indication
of the weighting that the inversion will give to an observa-tion over the a priori, with a smaller value indicating that the inversion will “trust” the observation more. The1XCH4is
an indication of how much the inversion needs to adjust the fluxes in order to match the observation. However, if the es-timated uncertainties are significantly less than the µ1XCH4
andσ1XCH4values it is expected that the observations should
provide value to the inversion. It should also be noted that this bias term (µ1XCH4) may also reflect systematic biases in
the XCH4 model due to, for example, errors in the vertical
model profile whilst the sigma term (σ1XCH4) may also
re-late to subgrid-scale variations which are unresolved at the model resolution.
For the North American Boreal region, both the µ1XCH4
and σ1XCH4 values are very similar in terms of phase and
magnitude to the a posteriori uncertainty with the σ1XCH4
ranging from an average of 9.6 ppb in summer to 14.5 ppb in winter compared to the a posteriori uncertainty that ranges from 6.6 ppb in summer to 10.8 ppb in winter. This suggests that regardless of the contribution to the uncertainty from the XCO2 model, it would be difficult for the satellite data
to inform the inversion any further than the in situ data al-ready do. However, this is not the case for the North Ameri-can Temperate region where theµ1XCH4 (7.4–11.6 ppb) and
σ1XCH4 (8.4–10.0 ppb) are far larger than the total
uncer-tainty (6.0–6.9 ppb) for much of the year. Both South Amer-ican regions exhibit more complicated behaviour with far less of an apparent seasonality in theµ1XCH4. Instead, for
most years µ1XCH4 is much higher than the uncertainties
(which themselves do not exhibit much seasonality in these regions). However, the year 2010 seems to be an anomalous year where theµ1XCH4 data are much more in agreement
and in this year the difference is of comparable magnitude to the uncertainties with values between 4 and 8 ppb. The
σ1XCH4 does exhibit more seasonality than theµ1XCH4 and
is again considerably higher than the estimated uncertainties (7–20 ppb vs. 5–6 ppb). In combination, this suggests that the GOSAT observations over South America should add consid-erable information to the inversion.
For Northern Africa, both the a posteriori error and the uncertainty related to the XCO2 model are small due to the
high SNR over the Sahara and the low CO2 variability
re-spectively (with seasonal average values ranging from 3.3 to 3.6 ppb for the a posteriori error and from 2.8 to 4.6 ppb for the model XCO2 error). In contrast, the µ1XCH4 (7.2–
12.3 ppb) andσ1XCH4 (4.9–8.4 ppb) values over this region
are relatively large with a high degree of temporal variabil-ity, suggesting that the satellite data should add consider-able value in constraining the inversion over this region. One complication is that GOSAT operates in a “medium gain” mode over the desert and hence may exhibit different in-strumental biases over such regions but, due to the proxy method, any such differences in instrumental biases that re-late to light-path modification should be minimised. South-ern Africa shows similar behaviour with the total uncertainty being low (seasonal averages of 5.1–7.3 ppb) compared to the much largerµ1XCH4 (12.6–19.8 ppb) andσ1XCH4 (5.7–
10.7 ppb) values, again indicating that considerable value is present in the satellite data.
The Eurasian Boreal region behaves similarly to the North American Boreal region. Theµ1XCH4 andσ1XCH4is of
sim-ilar phase and magnitude to the retrieval a posteriori er-ror, suggesting little information will be added to any inver-sion over this region beyond what is available from the in situ measurements. In contrast, theµ1XCH4 values over the
Eurasian Temperate region show a large variability with the differences in winter months much larger than the total un-certainty (9.9 ppb vs. 5.8 ppb), while in summer months the magnitudes become much more similar (5.5 ppb vs. 7.3 ppb). Interestingly, theσ1XCH4values appear to be of similar
mag-nitude (5–20 ppb) but directly out of phase with theµ1XCH4
values. Even during summer months when the a posteriori (4.3 ppb) and model XCO2(5.8 ppb) uncertainties are
com-parable to theµ1XCH4 (5.5 ppb), the high variability in the 1XCH4 values, as indicated by σ1XCH4 values of up to
4794 R. J. Parker et al.: Assessing 5 years of GOSAT Proxy XCH4data and associated uncertainties
Figure 7.Time series for each Transcom region showing the a posteriori retrieval error (red), the estimated uncertainty from the model XCO2 (green), and the mean (navy) and standard deviation (purple) of the difference between the GOSAT and MACC-II XCH4. The a posteriori error is assumed to be a random error and hence reduces with the square root of the number of measurements whilst the XCO2model uncertainty is expected to be a systematic error and hence does not reduce.
The Tropical Asian region, which encompasses parts of In-dia, China, and Indonesia, typically has low values for both the a posteriori (5.6–6.9 ppb) and XCO2model (4.4–6.0 ppb)
uncertainties, with neither exhibiting much seasonal variabil-ity. Theµ1XCH4andσ1XCH4 values however are much more
variable (8.9–11.7 and 9.0–16.8 ppb) and generally much higher than the uncertainties, suggesting that useful informa-tion from the satellite data is present.
The European Transcom region has uncertainties in the satellite data (seasonal averages of 7.6–10.0 ppb) that are of comparable magnitude to theµ1XCH4 values (8.1–10.7 ppb),
especially when considering the combination of the a pos-teriori and model XCO2 uncertainties. However, the
stan-dard deviation of theµ1XCH4 values is highly variable (8.7–
13.2 ppb) which suggests that there is scope for the observa-tional data to aid in constraining the European XCH4fluxes.
Finally, the Australian Transcom region shows very small uncertainties in the satellite data. The uncertainty associated with the model XCO2is comparable to the a posteriori error
during the Australian spring months but even in those cir-cumstances, the µ1XCH4 values are far larger (11.4 ppb vs.
4.7 ppb), demonstrating that the satellite data are capable of providing some information to the inversion over Australia, although this may be limited in its ability to provide spe-cific information on Australian sources as the σ1XCH4
val-ues over this region are similar to the estimated uncertainties with seasonal averages of 4.5–5.2 ppb compared to the total uncertainty values of 4.1–5.0 ppb.
6 Summary and conclusions
We present details of the update to the University of Leicester GOSAT Proxy XCH4v5.0 data set with 5 years of GOSAT
data now processed. The data are validated against the latest ground-based TCCON data and found to agree well with on average a small bias of 4.8 ppb (∼0.27 %), a single-sounding precision of 13.4 ppb (∼0.74 %), and a relative accuracy of 4.2 ppb. For the first time the XCH4/XCO2ratio component
of the proxy retrieval is validated and also found to agree well with TCCON with a bias of 0.014 ppb ppm−1(∼0.3 %) and
a single-sounding precision of 0.033 ppb ppm−1(∼0.72 %).
A major unknown uncertainty in previous Proxy XCH4
products was the uncertainty associated with the model XCO2. In this work we validate three separate
state-of-the-art chemistry transport models against the TCCON data and find that although the models can differ greatly (>4 ppm) away from the TCCON stations, at the validation locations it is difficult to distinguish which model performs better from our comparisons. We therefore decide to use the median of the three models to act as the model XCO2in the
calcula-tion of the Proxy XCH4 and use the maximum difference
to the median as a measure of the uncertainty in the model XCO2. This model uncertainty is found to vary greatly in
time and space but is typically largest over regions associated with biomass burning such as central Africa and in particu-lar over the Eurasian regions during summer months where large uptake in CO2 leads to large differences between the
In order to assess the relative importance of these uncer-tainties, we compare this model XCO2 uncertainty to the
a posteriori retrieval error over the different Transcom re-gions and find typically that where there is seasonality in the uncertainties, it is typically directly out of phase between the two, resulting in the model XCO2uncertainty becoming
sig-nificant during summer months where the a posteriori error is at its lowest. This relates to the fact that more sunlight leads to a reduction in the a posteriori uncertainty (by virtue of providing a greater signal in the SWIR) and at the same time is associated with an increase in photosynthesis and, hence, more potential for differences in the model XCO2.
We assess the significance of these uncertainties on any flux inversion by comparing the mean and standard deviation of the GOSAT−MACC differences (µ1XCH4andσ1XCH4) to
the estimated uncertainties. We find that for the majority of regions the mean and standard deviation of the1XCH4
val-ues are much larger than the estimated uncertainties, even taking into account the uncertainty related to the model
XCO2. Our findings show that useful information will be
provided to the inversions for the majority of regions, with the exceptions being the boreal regions (North American Bo-real and Eurasian BoBo-real) where the uncertainty is of a simi-lar magnitude to theµ1XCH4 andσ1XCH4values. It is
impor-tant to note that the MACC data are already constrained by NOAA background sites.
One final consideration for users of the Proxy XCH4data
who are performing atmospheric inversions is that, should they have their own XCO2model which they believe is
con-sistent with their XCH4model, it may be beneficial to only
take the GOSAT XCH4/XCO2 ratio and apply their own
model XCO2(with appropriate averaging kernels) in order to
minimise transport model errors between the different mod-els. Alternatively the XCH4/XCO2 ratio can also be
4796 R. J. Parker et al.: Assessing 5 years of GOSAT Proxy XCH4data and associated uncertainties
Appendix A: Data sets
The GOSAT Proxy XCH4 data used in this publication
are freely available from http://www.leos.le.ac.uk/GHG/ ghg_cci/CRDP/data_2/ESACCI/GHG/GOSAT/CH4_GOS_ OCPR/5.1/ upon request of a password. An updated version of this data set is now available (version 6.0) covering 2009–2014. Additionally, these data now contain both the raw XCH4 and XCO2 values as well as the uncertainty
associated with the model XCO2.
The TCCON XCH4 and XCO2 data used in this
Table A1.Table showing the comparison statistics between each XCO2model (sampled as per the GOSAT measurements) within±2◦of each TCCON site against the TCCON validation data. The difference (model−TCCON), the standard deviation of the difference, and the correlation coefficient are all provided as is the total number of measurements for each site,N, and the percentage “share” of the median for each model, %. For each of the three models, GEOS-Chem, MACC-II, and CarbonTracker, the best (bold) and worst (italic) value for each metric is highlighted. For the ensemble median data, all values which are better than the best individual model value are highlighted in bold-italic. The lower panel provides overall statistics across all sites. These include the relative accuracy (the standard deviation of the individual site biases), the overall precision (the standard deviation of the GOSAT−TCCON differences), and the overall share that each model contributes to the median ensemble.
2◦×2◦
Coincident criteria GEOS-Chem MACC-II CarbonTracker Ensemble median
TCCON Site N Diff (ppm) SD (ppm) r % Diff (ppm) SD (ppm) r % Diff (ppm) SD (ppm) r % Diff (ppm) SD (ppm) r Sodankylä 584 1.1 1.1 0.97 20 0.9 0.9 0.98 37 1.2 0.9 0.99 42 1.1 0.8 0.99
Bialystok 1429 0.6 1.5 0.95 25 0.4 1.1 0.97 33 0.6 1.0 0.98 44 0.6 1.0 0.97 Karlsruhe 1569 −0.2 1.4 0.92 22 −0.6 1.1 0.95 33 −0.4 1.1 0.95 45 −0.4 1.1 0.95
Orleans 1650 0.3 1.2 0.95 22 0.3 0.9 0.98 33 0.4 0.9 0.97 46 0.3 0.8 0.98
Garmisch 1527 0.8 1.3 0.93 22 0.6 1.3 0.94 34 0.8 1.2 0.95 43 0.7 1.1 0.95
Park Falls 2434 0.4 1.1 0.97 23 0.1 1.0 0.98 38 0.5 1.0 0.98 40 0.3 0.9 0.98
Lamont 7464 −0.2 1.6 0.92 20 −0.1 0.9 0.98 39 0.0 0.9 0.98 41 −0.1 0.9 0.98
Saga 379 −0.6 1.1 0.93 27 −1.0 0.9 0.95 33 −0.3 0.9 0.95 40 −0.6 0.9 0.96
Darwin 2491 0.0 0.8 0.97 12 0.5 0.7 0.97 27 0.4 0.6 0.98 60 0.3 0.6 0.98
Wollongong 2601 −0.1 0.8 0.96 36 −0.1 0.8 0.96 44 0.2 0.9 0.95 21 0.0 0.8 0.96
Lauder_120 124 −0.1 0.9 0.82 27 −0.3 0.7 0.86 44 −0.2 0.8 0.84 29 −0.2 0.8 0.84
Lauder_125 368 0.3 0.4 0.99 30 0.2 0.3 0.99 40 0.4 0.4 0.99 30 0.3 0.3 0.99
Statistics for all sites
Relative accuracy (ppm) 0.48 0.53 0.47 0.48
Overall precision (ppm) 1.3 0.97 0.96 0.92
Total median share (%) 22 36 41
Table A2.Table showing the seasonal averages of the data plotted in Fig. 7 for each of the Transcom regions. The retrieved a posteriori error, the uncertainty related to the model XCO2, their combined total, and the mean and standard deviation of the GOSAT−MACC difference are all provided for each season and for each Transcom region.
Region Season A posteriori Model Total µ1XCH4 σ1XCH4 Region Season A posteriori Model Total µ1XCH4 σ1XCH4
(ppb) (ppb) (ppb) (ppb) (ppb) (ppb) (ppb) (ppb) (ppb) (ppb)
North America spring 7.4 2.2 7.8 6.3 13.0 Eurasian spring 7.1 3.2 8.0 4.5 13.1
boreal summer 6.6 4.9 8.3 2.9 9.6 boreal summer 6.3 7.0 9.5 4.4 9.9
autumn 10.0 2.8 10.5 6.2 11.4 autumn 9.0 3.1 9.6 5.4 11.1
winter 10.8 2.3 11.1 11.5 14.5 winter 9.9 2.5 10.3 5.7 13.9
North America spring 5.1 3.0 6.0 11.2 9.2 Eurasian spring 4.4 3.5 5.7 11.7 9.7
temperate summer 4.6 4.7 6.6 7.4 8.6 temperate summer 4.3 5.8 7.3 5.5 15.0
autumn 5.3 3.1 6.3 7.7 8.4 autumn 4.4 4.1 6.2 6.5 10.2
winter 6.5 2.4 6.9 11.6 10.0 winter 5.2 2.6 5.8 9.9 9.6
South America spring 6.4 4.3 7.8 8.6 11.2 Tropical Asia spring 6.0 6.0 8.5 8.9 12.2
tropical summer 5.3 4.3 6.9 10.8 8.6 summer 6.9 5.0 8.7 10.9 16.1
autumn 5.8 5.2 7.9 10.7 12.6 autumn 6.2 6.0 8.7 11.7 16.8
winter 6.5 4.1 7.8 7.4 15.5 winter 5.6 4.4 7.2 10.9 9.0
South America spring 4.7 3.7 6.1 6.0 10.7 Australia spring 3.9 2.5 4.7 11.4 4.7
temperate summer 4.3 3.4 5.5 9.1 7.4 summer 3.7 1.8 4.1 11.7 4.5
autumn 4.2 3.7 5.7 9.1 9.7 autumn 3.7 2.1 4.3 13.9 5.2
winter 4.7 3.8 6.1 7.2 13.5 winter 4.2 2.5 5.0 15.0 5.2
Northern Africa spring 3.6 3.6 5.2 8.8 7.3 Europe spring 6.7 3.5 7.6 9.2 12.1
summer 3.6 4.6 5.9 7.2 7.4 summer 5.9 5.3 8.0 10.7 8.7
autumn 3.4 3.5 4.9 12.3 8.4 autumn 7.5 3.0 8.2 8.1 8.9
winter 3.3 2.8 4.3 8.0 4.9 winter 9.4 3.1 10.0 9.3 13.2
Southern Africa spring 4.7 4.6 6.7 15.5 9.9
summer 3.7 3.4 5.1 12.6 5.7
autumn 4.8 3.7 6.1 13.5 9.8
4798 R. J. Parker et al.: Assessing 5 years of GOSAT Proxy XCH4data and associated uncertainties
Acknowledgements. We thank Japanese Aerospace Exploration Agency, National Institute for Environmental Studies, and the Min-istry of Environment for the GOSAT data and their continuous sup-port as part of the Joint Research Agreement. R. J. Parker is funded through an ESA Living Planet Fellowship. The work at the Uni-versity of Leicester and UniUni-versity of Edinburgh was supported by funding through the UK National Centre for Earth Observation (NCEO), the Natural Environment Research Council (NERC), and the ESA Greenhouse Gas Climate Change Initiative (GHG-CCI). Part of this work was funded by the NERC Amazonian Carbon Ob-servatory project (NE/J016284/1) and the NERC GAUGE project (NE/K002465/1). This research used the ALICE High Performance Computing Facility at the University of Leicester.
The authors would like to thank Paul Wennberg as the TCCON PI for provision of TCCON data. The European TCCON groups acknowledge financial support by the EU project InGOS. The RAMCES team at LSCE (Gif-sur-Yvette, France) is acknowledged for maintenance and logistical work for the Orléans TCCON site. The University of Bremen acknowledges support from the Senate of Bremen, the EU-project ICOS-INWIRE, and operational funding from the National Institute for Environmental Studies (NIES, Japan). A part of the work at JAXA was supported by the Environment Research and Technology Development Fund (A-1102) of the Ministry of the Environment, Japan. A part of this work has been supported by the European Commission Seventh Framework Programme (FP7/2007–2013) projects MACC under grant agreement 218793 and MACC-II under grant agreement 283576.
Edited by: I. Aben
References
Alexe, M., Bergamaschi, P., Segers, A., Detmers, R., Butz, A., Hasekamp, O., Guerlet, S., Parker, R., Boesch, H., Frankenberg, C., Scheepmaker, R. A., Dlugokencky, E., Sweeney, C., Wofsy, S. C., and Kort, E. A.: Inverse modelling of CH4 emissions for 2010–2011 using different satellite retrieval products from GOSAT and SCIAMACHY, Atmos. Chem. Phys., 15, 113–133, doi:10.5194/acp-15-113-2015, 2015.
Bergamaschi, P., Frankenberg, C., Meirink, J. F., Krol, M., Dentener, F., Wagner, T., Platt, U., Kaplan, J. O., Ko-rner, S., Heinmann, M., Dlugokencky, E. J., and Goede, A.: Satellite chartography of atmospheric methane from SCIA-MACHY on board ENVISAT: 2. Evaluation based on in-verse model simulations, J. Geophys. Res.-Atmos., 112, D02304 doi:10.1029/2005JD006235, 2007.
Bergamaschi, P., Frankenberg, C., Meirink, J. F., Krol, M., Vil-lani, M. G., Houweling, S., Frank, D., Edward, J. D., John, B. M., Luciana, V. G., Andreas, E., and Ingeborg, L.: Inverse model-ing of global and regional CH4emissions using SCIAMACHY satellite retrievals, J. Geophys. Res.-Atmos., 114, D22301, doi:10.1029/2009JD012287, 2009.
Bergamaschi, P., Houweling, S., Segers, A., Krol, M., Franken-berg, C., Scheepmaker, R. A., Dlugokencky, E., Wofsy, S. C., Kort, E. A., Sweeney, C., Schuck, T., Brenninkmeijer, C., Chen, H., Beck, V., and Gerbig, C.: Atmospheric CH4 in the first decade of the 21st century: inverse modeling
anal-ysis using SCIAMACHY satellite retrievals and NOAA sur-face measurements, J. Geophys. Res.-Atmos., 118, 7350–7369, doi:10.1002/jgrd.50480, 2013.
Boesch, H., Baker, D., Connor, B., Crisp, D., and Miller, C.: Global characterization of CO2 column retrievals from shortwave-infrared satellite observations of the Orbiting Car-bon Observatory-2 Mission, Remote Sensing, 3, 270–304, doi:10.3390/rs3020270, 2011.
Bousquet, P., Ciais, P., Miller, J. B., Dlugokencky, E. J., Hauglus-taine, D. A., Prigent, C., Van Der Werf, G. R., Peylin, P., Brunke, E., Carouge, C., Langenfelds, R. L., Lathiere, J., Papa, F., Ramonet, M., Schmidt, M., Steele, L. P., Tyler, S. C., and White, J.: Contribution of anthropogenic and natural sources to atmospheric methane variability, Nature, 443, 439–443, doi:10.1038/nature05132, 2006.
Buchwitz, M., Reuter, M., Schneising, O., Boesch, H., Guer-let, S., Dils, B., Aben, I., Armante, R., Bergamaschi, P., Blu-menstock, T., Bovensmann, H., Brunner, D., Buchmann, B., Bur-rows, J., Butz, A., Chedin, A., Chevallier, F., Crevoisier, C., Deutscher, N., Frankenberg, C., Hase, F., Hasekamp, O., Heymann, J., Kaminski, T., Laeng, A., Lichtenberg, G., Maziere, M. D., Noel, S., Notholt, J., Orphal, J., Popp, C., Parker, R., Scholze, M., Sussmann, R., Stiller, G., Warneke, T., Zehner, C., Bril, A., Crisp, D., Griffith, D., Kuze, A., O’Dell, C., Oshchepkov, S., Sherlock, V., Suto, H., Wennberg, P., Wunch, D., Yokota, T., and Yoshida, Y.: The Greenhouse Gas Climate Change Initiative (GHG-CCI): comparison and quality as-sessment of near-surface-sensitive satellite-derived CO2 and CH4 global data sets, Remote Sens. Environ., 162, 344–362, doi:10.1016/j.rse.2013.04.024, 2013.
Butz, A., Hasekamp, O. P., Frankenberg, C., Vidot, J., and Aben, I.: CH4 retrievals from space-based solar backscatter measure-ments: performance evaluation against simulated aerosol and cirrus loaded scenes, J. Geophys. Res.-Atmos., 115, D24302, doi:10.1029/2010JD014514, 2010.
Chevallier, F., Ciais, P., Conway, T., Aalto, T., Anderson, B., Bous-quet, P., Brunke, E., Ciattaglia, L., Esaki, Y., Fröhlich, M., Gomez, A., Gomez-Pelaez, A., Haszpra, L., Krummel, P., Lan-genfelds, R., Leuenberger, M., MacHida, T., Maignan, F., Mat-sueda, H., Morguí, J., Mukai, H., Nakazawa, T., Peylin, P., Ra-monet, M., Rivier, L., Sawa, Y., Schmidt, M., Steele, L., Vay, S., Vermeulen, A., Wofsy, S., and Worthy, D.: CO2surface fluxes at grid point scale estimated from a global 21 year reanalysis of atmospheric measurements, J. Geophys. Res.-Atmos., 115, D21307, doi:10.1029/2010JD013887, 2010.
Chipperfield, M. P.: Multiannual simulations with a three-dimensional chemical transport model, J. Geophys. Res.-Atmos., 104, 1781–1805, doi:10.1029/98JD02597, 1999.
Cogan, A., Boesch, H., Parker, R., Feng, L., Palmer, P., Blavier, J.-F., Deutscher, N. M., Macatangay, R., Notholt, J., Roehl, C., Warneke, T., and Wunch, D.: Atmospheric carbon dioxide retrieved from the Greenhouse gases Observing SATellite (GOSAT): comparison with ground-based TCCON observations and GEOS-Chem model calculations, J. Geophys. Res.-Atmos., 117, D21301, doi:10.1029/2012JD018087, 2012.
Cressot, C., Chevallier, F., Bousquet, P., Crevoisier, C., Dlugo-kencky, E. J., Fortems-Cheiney, A., Frankenberg, C., Parker, R., Pison, I., Scheepmaker, R. A., Montzka, S. A., Krummel, P. B., Steele, L. P., and Langenfelds, R. L.: On the consistency between global and regional methane emissions inferred from SCIA-MACHY, TANSO-FTS, IASI and surface measurements, Atmos. Chem. Phys., 14, 577–592, doi:10.5194/acp-14-577-2014, 2014. Dee, D. P., Uppala, S. M., Simmons, A. J., Berrisford, P., Poli, P., Kobayashi, S., Andrae, U., Balmaseda, M. A., Balsamo, G., Bauer, P., Bechtold, P., Beljaars, A. C. M., van de Berg, L., Bidlot, J., Bormann, N., Delsol, C., Dragani, R., Fuentes, M., Geer, A. J., Haimberger, L., Healy, S. B., Hersbach, H., Hólm, E. V., Isaksen, L., Kållberg, P., Köhler, M., Matricardi, M., McNally, A. P., Monge-Sanz, B. M., Morcrette, J.-J., Park, B.-K., Peubey, C., de Rosnay, P., Tavolato, C., Thépaut, J.-N., and Vitart, F.: The ERA-Interim reanalysis: configuration and perfor-mance of the data assimilation system, Q. J. Roy. Meteor. Soc., 137, 553–597, doi:10.1002/qj.828, 2011.
Deutscher, N., Notholt, J., Messerschmidt, J., Weinzierl, C., Warneke, T., Petri, C., Grupe, P., and Katrynski, K.: TCCON Data Archive, hosted by the Carbon Diox-ide Information Analysis Center, Oak Ridge Na-tional Laboratory, Oak Ridge, Tennessee, USA, doi:10.14291/tccon.ggg2014.bialystok01.R0/1149277, 2014. Dils, B., Buchwitz, M., Reuter, M., Schneising, O., Boesch, H.,
Parker, R., Guerlet, S., Aben, I., Blumenstock, T., Burrows, J. P., Butz, A., Deutscher, N. M., Frankenberg, C., Hase, F., Hasekamp, O. P., Heymann, J., De Mazière, M., Notholt, J., Suss-mann, R., Warneke, T., Griffith, D., Sherlock, V., and Wunch, D.: The Greenhouse Gas Climate Change Initiative (GHG-CCI): comparative validation of GHG-CCI SCIAMACHY/ENVISAT and TANSO-FTS/GOSAT CO2 and CH4 retrieval algorithm products with measurements from the TCCON, Atmos. Meas. Tech., 7, 1723–1744, doi:10.5194/amt-7-1723-2014, 2014. Dlugokencky, E. J., Bruhwiler, L., White, J. W. C., Emmons, L. K.,
Novelli, P. C., Montzka, S. A., Masarie, K. A., Lang, P. M., Crotwell, A. M., Miller, J. B., and Gatti, L. V.: Observational constraints on recent increases in the atmospheric CH4burden, Geophys. Res. Lett., 36, L18803, doi:10.1029/2009GL039780, 2009.
Feng, L., Palmer, P. I., Yang, Y., Yantosca, R. M., Kawa, S. R., Paris, J.-D., Matsueda, H., and Machida, T.: Evaluating a 3-D transport model of atmospheric CO2 using ground-based, air-craft, and space-borne data, Atmos. Chem. Phys., 11, 2789– 2803, doi:10.5194/acp-11-2789-2011, 2011.
Frankenberg, C., Meirink, J. F., Bergamaschi, P., Goede, A. P. H., Heimann, M., Körner, S., Platt, U., van Weele, M., and Wagner, T.: Satellite chartography of atmospheric methane from SCIAMACHY on board ENVISAT: analysis of the years 2003 and 2004, J. Geophys. Res.-Atmos., 111, D07303, doi:10.1029/2005JD006235, 2006.
Frankenberg, C., Aben, I., Bergamaschi, P., Dlugokencky, E., Van Hees, R., Houweling, S., Van Der Meer, P., Snel, R., and Tol, P.: Global column-averaged methane mixing ra-tios from 2003 to 2009 as derived from SCIAMACHY: trends and variability, J. Geophys. Res.-Atmos., 116, D04302, doi:10.1029/2010JD014849, 2011.
Fraser, A., Palmer, P. I., Feng, L., Boesch, H., Cogan, A., Parker, R., Dlugokencky, E. J., Fraser, P. J., Krummel, P. B.,
Langen-felds, R. L., O’Doherty, S., Prinn, R. G., Steele, L. P., van der Schoot, M., and Weiss, R. F.: Estimating regional methane sur-face fluxes: the relative importance of sursur-face and GOSAT mole fraction measurements, Atmos. Chem. Phys., 13, 5697–5713, doi:10.5194/acp-13-5697-2013, 2013.
Fraser, A., Palmer, P. I., Feng, L., Bösch, H., Parker, R., Dlugo-kencky, E. J., Krummel, P. B., and Langenfelds, R. L.: Estimat-ing regional fluxes of CO2 and CH4using space-borne observa-tions of XCH4: XCO2, Atmos. Chem. Phys., 14, 12883–12895, doi:10.5194/acp-14-12883-2014, 2014.
Griffith, D. W. T., Deutscher, N., Velazco, V. A., Wennberg, P. O., Yavin, Y., Aleks, G. K., Washenfelder, R., Toon, G. C., Blavier, J.-F., Murphy, C., Jones, N., Kettlewell, G., Connor, B., Macatangay, R., Roehl, C., Ryczek, M., Glowacki, J., Cul-gan, T., and Bryant, G.: TCCON Data from Darwin, Aus-tralia, Release GGG2014R0. TCCON Data Archive, hosted by the Carbon Dioxide Information Analysis Center, Oak Ridge National Laboratory, Oak Ridge, Tennessee, USA, doi:10.14291/tccon.ggg2014.darwin01.R0/1149290, 2014a. Griffith, D. W. T., Velazco, V. A., Deutscher, N., Murphy, C.,
Jones, N., Wilson, S., Macatangay, R., Kettlewell, G., Buch-holz, R. R., and Riggenbach, M.: TCCON Data from Wollon-gong, Australia, Release GGG2014R0. TCCON Data Archive, hosted by the Carbon Dioxide Information Analysis Center, Oak Ridge National Laboratory, Oak Ridge, Tennessee, USA, doi:10.14291/tccon.ggg2014.wollongong01.R0/1149291, 2014b.
Gurney, K., Law, R., Denning, A., Rayner, P., Baker, D., Bous-quet, P., Bruhwiler, L., Chen, Y.-H., Clals, P., Fan, S., Fung, I., Gloor, M., Heimann, M., Higuchi, K., John, J., Maki, T., Maksyutov, S., Masarie, K., Peylin, P., Prather, M., Pak, B., Randerson, J., Sarmiento, J., Taguchi, S., Takahashi, T., and Yuen, C.-W.: Towards robust regional estimates of CO2sources and sinks using atmospheric transport models, Nature, 415, 626– 630, doi:10.1038/415626a, 2002.
Hase, F., Blumenstock, T., Dohe, S., Grofl, J., and Kiel, M.: TCCON Data from Karlsruhe, Germany, Re-lease GGG2014R0, TCCON Data Archive, hosted by the Carbon Dioxide Information Analysis Center, Oak Ridge National Laboratory, Oak Ridge, Tennessee, USA, doi:10.14291/tccon.ggg2014.karlsruhe01.R0/1149270, 2014. Houweling, S., Krol, M., Bergamaschi, P., Frankenberg, C.,
Dlugo-kencky, E. J., Morino, I., Notholt, J., Sherlock, V., Wunch, D., Beck, V., Gerbig, C., Chen, H., Kort, E. A., Röckmann, T., and Aben, I.: A multi-year methane inversion using SCIAMACHY, accounting for systematic errors using TCCON measurements, Atmos. Chem. Phys., 14, 3991–4012, doi:10.5194/acp-14-3991-2014, 2014.
Kawakami, S., Ohyama, H., Arai, K., Okumura, H., Taura, C., Fukamachi, T., and Sakashita, M.: TCCON Data from Saga, Japan, Release GGG2014R0. TCCON Data Archive, hosted by the Carbon Dioxide Information Analysis Center, Oak Ridge National Laboratory, Oak Ridge, Tennessee, USA, doi:10.14291/tccon.ggg2014.saga01.R0/1149283, 2014. Kirschke, S., Bousquet, P., Ciais, P., Saunois, M., Canadell, J. G.,
J.-4800 R. J. Parker et al.: Assessing 5 years of GOSAT Proxy XCH4data and associated uncertainties
F., Langenfelds, R. L., Le Quere, C., Naik, V., O’Doherty, S., Palmer, P. I., Pison, I., Plummer, D., Poulter, B., Prinn, R. G., Rigby, M., Ringeval, B., Santini, M., Schmidt, M., Shindell, D. T., Simpson, I. J., Spahni, R., Steele, L. P., Strode, S. A., Sudo, K., Szopa, S., van der Werf, G. R., Voulgarakis, A., van Weele, M., Weiss, R. F., Williams, J. E., and Zeng, G.: Three decades of global methane sources and sinks, Nat. Geosci., 6, 813–823, doi:10.1038/ngeo1955, 2013.
Kivi, R., Heikkinen, P., and Kyro., E.: TCCON Data from So-dankyla, Finland, Release GGG2014R0. TCCON Data Archive, hosted by the Carbon Dioxide Information Analysis Center, Oak Ridge National Laboratory, Oak Ridge, Tennessee, USA, doi:10.14291/tccon.ggg2014.sodankyla01.R0/1149280, 2014. Kuze, A., Taylor, T., Kataoka, F., Bruegge, C., Crisp, D.,
Harada, M., Helmlinger, M., Inoue, M., Kawakami, S., Kikuchi, N., Mitomi, Y., Murooka, J., Naitoh, M., O’Brien, D., O’Dell, C., Ohyama, H., Pollock, H., Schwandner, F., Sh-iomi, K., Suto, H., Takeda, T., Tanaka, T., Urabe, T., Yokota, T., and Yoshida, Y.: Long-term vicarious calibration of GOSAT short-wave sensors: techniques for error reduction and new es-timates of radiometric degradation factors, IEEE T. Geosci. Re-mote, 52, 3991–4004, doi:10.1109/TGRS.2013.2278696, 2014. Messerschmidt, J., Macatangay, R., Notholt, J., Petri, C.,
Warneke, T., and Weinzierl, C.: Side by side measurements of CO2 by ground-based Fourier transform spectrometry (FTS), Tellus B, 62, 749–758, doi:10.1111/j.1600-0889.2010.00491.x, 2010.
Monteil, G., Houweling, S., Butz, A., Guerlet, S., Schep-ers, D., Hasekamp, O., Frankenberg, C., Scheepmaker, R., Aben, I., and Röckmann, T.: Comparison of CH4 inver-sions based on 15 months of GOSAT and SCIAMACHY observations, J. Geophys. Res.-Atmos., 118, 11807–11823, doi:10.1002/2013JD019760, 2013.
Myhre, G., Shindell, D., Bréon, F.-M., Collins, W., Fuglestvedt, J., Huang, J., Koch, D., Lamarque, J.-F., Lee, D., Mendoza, B., Nakajima, T., Robock, A., Stephens, G., Takemura, T., and Zhang, H.: Anthropogenic and natural radiative forcing, chap. 8, in: Climate Change 2013: the Physical Science Basis, Contribu-tion of Working Group I to the Fifth Assessment Report of the In-tergovernmental Panel on Climate Change, edited by: Stocker, T., Qin, D., Plattner, G.-K., Tignor, M., Allen, S., Boschung, J., Nauels, A., Xia, Y., Bex, V., and Midgley, P., Cambridge Uni-versity Press, 659–740, doi:10.1017/CBO9781107415324.018, 2013.
Nisbet, E., Dlugokencky, E., and Bousquet, P.: Methane on the rise – again, Science, 343, 493–495, doi:10.1126/science.1247828, 2014.
O’Dell, C. W., Connor, B., Bösch, H., O’Brien, D., Frankenberg, C., Castano, R., Christi, M., Eldering, D., Fisher, B., Gunson, M., McDuffie, J., Miller, C. E., Natraj, V., Oyafuso, F., Polonsky, I., Smyth, M., Taylor, T., Toon, G. C., Wennberg, P. O., and Wunch, D.: The ACOS CO2retrieval algorithm – Part 1: Description and validation against synthetic observations, Atmos. Meas. Tech., 5, 99–121, doi:10.5194/amt-5-99-2012, 2012.
Pandey, S., Houweling, S., Krol, M., Aben, I., and Röckmann, T.: On the use of satellite-derived CH4:CO2columns in a joint in-version of CH4 and CO2fluxes, Atmos. Chem. Phys., 15, 8615– 8629, doi:10.5194/acp-15-8615-2015, 2015.
Parker, R., Boesch, H., Cogan, A., Fraser, A., Feng, L., Palmer, P. I., Messerschmidt, J., Deutscher, N., Griffith, D. W. T., Notholt, J., Wennberg, P. O., and Wunch, D.: Methane observations from the Greenhouse Gases Observing SATellite: comparison to ground-based TCCON data and model calculations, Geophys. Res. Lett., 38, L15807, doi:10.1029/2011GL047871, 2011.
Peters, W., Jacobson, A. R., Sweeney, C., Andrews, A. E., Con-way, T. J., Masarie, K., Miller, J. B., Bruhwiler, L. M. P., Petron, G., Hirsch, A. I., Worthy, D. E. J., Van Der Werf, G. R., Randerson, J. T., Wennberg, P. O., Krol, M. C., and Tans, P. P.: An atmospheric perspective on North American carbon dioxide exchange: CarbonTracker, P. Natl. Acad. Sci. USA, 104, 18925– 18930, doi:10.1073/pnas.0708986104, 2007.
Prather, M. J., Holmes, C. D., and Hsu, J.: Reactive greenhouse gas scenarios: systematic exploration of uncertainties and the role of atmospheric chemistry, Geophys. Res. Lett., 39, L09803, doi:10.1029/2012GL051440, 2012.
Rigby, M., Prinn, R. G., Fraser, P. J., Simmonds, P. G., Lan-genfelds, R. L., Huang, J., Cunnold, D. M., Steele, L. P., Krummel, P. B., Weiss, R. F., O’Doherty, S., Salameh, P. K., Wang, H. J., Harth, C. M., Muhle, J., and Porter, L. W.: Re-newed growth of atmospheric methane, Geophys. Res. Lett., 35, L22805, doi:10.1029/2008GL036037, 2008.
Rodgers, C.: Inverse Methods for Atmospheric Sounding: Theory and Practice, World Scientific Publishing Co Pte Ltd, 2000. Schepers, D., Guerlet, S., Butz, A., Landgraf, J.,
Franken-berg, C., Hasekamp, O., Blavier, J.-F., Deutscher, N. M., Grif-fith, D. W. T., Hase, F., Kyro, E., Morino, I., Sherlock, V., Sussmann, R., and Aben, I.: Methane retrievals from Green-house Gases Observing Satellite (GOSAT) shortwave infrared measurements: performance comparison of proxy and physics retrieval algorithms, J. Geophys. Res.-Atmos., 117, D10307, doi:10.1029/2012JD017549, 2012.
Schneising, O., Buchwitz, M., Reuter, M., Heymann, J., Bovens-mann, H., and Burrows, J. P.: Long-term analysis of car-bon dioxide and methane column-averaged mole fractions re-trieved from SCIAMACHY, Atmos. Chem. Phys., 11, 2863– 2880, doi:10.5194/acp-11-2863-2011, 2011.
Sherlock, V., Connor, B., Robinson, J., Shiona, H., Smale, D., and Pollard, D.: TCCON Data from Lauder, New Zealand, 120HR, Release GGG2014R0. TCCON Data Archive, hosted by the Carbon Dioxide Information Analysis Center, Oak Ridge National Laboratory, Oak Ridge, Tennessee, USA, doi:10.14291/tccon.ggg2014.lauder01.R0/1149293, 2014a. Sherlock, V., Connor, B., Robinson, J., Shiona, H., Smale, D.,
and Pollard, D.: TCCON Data from Lauder, New Zealand, 125HR, Release GGG2014R0. TCCON Data Archive, hosted by the Carbon Dioxide Information Analysis Center, Oak Ridge National Laboratory, Oak Ridge, Tennessee, USA, doi:10.14291/tccon.ggg2014.lauder02.R0/1149298, 2014b. Sussmann, R. and Rettinger, M.: TCCON Data from Garmisch,
Germany, Release GGG2014R0. TCCON Data Archive, hosted by the Carbon Dioxide Information Analysis Center, Oak Ridge National Laboratory, Oak Ridge, Tennessee, USA, doi:10.14291/tccon.ggg2014.garmisch01.R0/1149299, 2014. Warneke, T., Messerschmidt, J., Notholt, J., Weinzierl, C.,
GGG2014R0. TCCON Data Archive, hosted by the Car-bon Dioxide Information Analysis Center, Oak Ridge National Laboratory, Oak Ridge, Tennessee, USA, doi:10.14291/tccon.ggg2014.orleans01.R0/1149276, 2014. Wennberg, P. O., Roehl, C., Wunch, D., Toon, G. C.,
Blavier, J.-F., Washenfelder, R., Keppel-Aleks, G., Allen, N., and Ayers, J.: TCCON Data from Park Falls, Wisconsin, USA, Release GGG2014R0. TCCON Data Archive, hosted by the Carbon Dioxide Information Analysis Center, Oak Ridge National Laboratory, Oak Ridge, Tennessee, USA, doi:10.14291/tccon.ggg2014.parkfalls01.R0/1149161, 2014a. Wennberg, P. O., Wunch, D., Roehl, C., Blavier, J.-F., Toon, G. C.,
Allen, N., Dowell, P., Teske, K., Martin, C., and Mar-tin, J.: TCCON Data from Lamont, Oklahoma, USA, Release GGG2014R0. TCCON Data Archive, hosted by the Carbon Dioxide Information Analysis Center, Oak Ridge National Laboratory, Oak Ridge, Tennessee, USA, doi:10.14291/tccon.ggg2014.lamont01.R0/1149159, 2014b. Wunch, D., Toon, G. C., Wennberg, P. O., Wofsy, S. C., Stephens,
B. B., Fischer, M. L., Uchino, O., Abshire, J. B., Bernath, P., Bi-raud, S. C., Blavier, J.-F. L., Boone, C., Bowman, K. P., Browell, E. V., Campos, T., Connor, B. J., Daube, B. C., Deutscher, N. M., Diao, M., Elkins, J. W., Gerbig, C., Gottlieb, E., Griffith, D. W. T., Hurst, D. F., Jiménez, R., Keppel-Aleks, G., Kort, E. A., Macatangay, R., Machida, T., Matsueda, H., Moore, F., Morino, I., Park, S., Robinson, J., Roehl, C. M., Sawa, Y., Sherlock, V., Sweeney, C., Tanaka, T., and Zondlo, M. A.: Calibration of the Total Carbon Column Observing Network using aircraft pro-file data, Atmos. Meas. Tech., 3, 1351–1362, doi:10.5194/amt-3-1351-2010, 2010.
Wunch, D., Toon, G. C., Blavier, J.-F. L., Washenfelder, R. A., Notholt, J., Connor, B. J., Griffith, D. W. T., Sherlock, V., and Wennberg., P. O.: The Total Carbon Column Observ-ing Network, Philos. T. Roy. Soc. A, 369, 2087–2112, doi:10.1098/rsta.2010.0240, 2011a.
Wunch, D., Wennberg, P. O., Toon, G. C., Connor, B. J., Fisher, B., Osterman, G. B., Frankenberg, C., Mandrake, L., O’Dell, C., Ahonen, P., Biraud, S. C., Castano, R., Cressie, N., Crisp, D., Deutscher, N. M., Eldering, A., Fisher, M. L., Griffith, D. W. T., Gunson, M., Heikkinen, P., Keppel-Aleks, G., Kyrö, E., Lindenmaier, R., Macatangay, R., Mendonca, J., Messerschmidt, J., Miller, C. E., Morino, I., Notholt, J., Oyafuso, F. A., Ret-tinger, M., Robinson, J., Roehl, C. M., Salawitch, R. J., Sher-lock, V., Strong, K., Sussmann, R., Tanaka, T., Thompson, D. R., Uchino, O., Warneke, T., and Wofsy, S. C.: A method for eval-uating bias in global measurements of CO2total columns from space, Atmos. Chem. Phys., 11, 12317–12337, doi:10.5194/acp-11-12317-2011, 2011b.