aureus
Independently of SaePQ
Phuti E. Makgotlho1, Gabriella Marincola2, Daniel Scha¨fer1, Qian Liu3, Taeok Bae3, Tobias Geiger2, Elizabeth Wasserman4, Christiane Wolz2*, Wilma Ziebuhr5, Bhanu Sinha6
1Institute for Hygiene and Microbiology, University of Wu¨rzburg, Wu¨rzburg, Germany,2Institute for Medical Microbiology and Hygiene, University of Tu¨bingen, Tu¨bingen, Germany,3Department of Microbiology and Immunology, Indiana University School of Medicine-Northwest, Gary, Indiana, United States of America,
4Department of Pathology, Stellenbosch University, Cape Town, South Africa,5Institute for Molecular Infection Biology, University of Wu¨rzburg, Wu¨rzburg, Germany,
6Department of Medical Microbiology and Infection Prevention, University Medical Center Groningen, Groningen, The Netherlands
Abstract
TheStaphylococcus aureus regulatory saePQRS system controls the expression of numerous virulence factors, including extracellular adherence protein (Eap), which amongst others facilitates invasion of host cells. ThesaePQRSoperon codes for 4 proteins: the histidine kinase SaeS, the response regulator SaeR, the lipoprotein SaeP and the transmembrane protein SaeQ.S. aureusstrain Newman has a single amino acid substitution in the transmembrane domain of SaeS (L18P) which results in constitutive kinase activity. SDS was shown to be one of the signals interfering with SaeS activity leading to inhibition of thesae target geneeap in strains with SaeSLbut causing activation in strains containing SaeSP. Here, we analyzed the possible involvement of the SaeP protein andsaePQregion in SDS-mediatedsae/eapexpression. We found that SaePQ is not needed for SDS-mediated SaeS signaling. Furthermore, we could show that SaeS activity is closely linked to the expression of Eap and the capacity to invade host cells in a number of clinical isolates. This suggests that SaeS activity might be directly modulated by structurally non-complex environmental signals, as SDS, which possibly altering its kinase/ phosphatase activity.
Citation:Makgotlho PE, Marincola G, Scha¨fer D, Liu Q, Bae T, et al. (2013) SDS Interferes with SaeS Signaling ofStaphylococcus aureusIndependently of SaePQ. PLoS ONE 8(8): e71644. doi:10.1371/journal.pone.0071644
Editor:Tarek Msadek, Institut Pasteur, France
ReceivedFebruary 20, 2013;AcceptedJuly 3, 2013;PublishedAugust 20, 2013
Copyright:ß2013 Makgotlho et al. This is an open-access article distributed under the terms of the Creative Commons Attribution License, which permits unrestricted use, distribution, and reproduction in any medium, provided the original author and source are credited.
Funding:This study was supported by the International Research Training Group IRTG 1522, the BMBF-funded MedVetStaph Research Network (FKZ 01KI1014E) and the Deutsche Forschungsgemeinschaft Wo578/7-1 and TransRegio34 Projects B1, B4, and C6/11. The funders had no role in study design, data collection and analysis, decision to publish, or preparation of the manuscript.
Competing Interests:The authors have declared that no competing interests exist.
* E-mail: [email protected]
Introduction
Staphylococcus aureus is part of the commensal flora, colonizing predominantly the anterior nares of approximately 20–50% of the human population [1]. However, it is also a facultative pathogen able to cause a wide spectrum of infections, ranging from skin and soft tissue infections and abscess formation to complicated systemic diseases such as osteomyelitis, endocarditis, sepsis and toxic shock syndrome [2,3]. S. aureus has the ability to rapidly adapt to different environmental conditions, including heat, pH, and a range of chemical components. There is now growing evidence thatS. aureuscan also invade and persist within different cell types. The invasion potential is due to the production of various proteins such as fibronectin binding proteins (FnBPs) and extracellular adhesive proteins (Eap) [4] which are controlled by the regulatory SaePQRS system [5]. Strain Newman uses Eap rather than FnBPs as invasin since both FnBPs are secreted due to a point mutation resulting in a truncation of these proteins [6].
SaeR and SaeS are part of a bacterial two-component system coding for a response regulator and a histidine kinase, respectively [7]. They are encoded in thesaePQRSoperon together with other two ORFs, which are predicted to encode a lipoprotein (SaeP) and a membrane protein (SaeQ). Recently it was suggested that these two proteins play a role in the deactivation of the thesaesystem by inducing the phosphatase activity of SaeS [8,9].
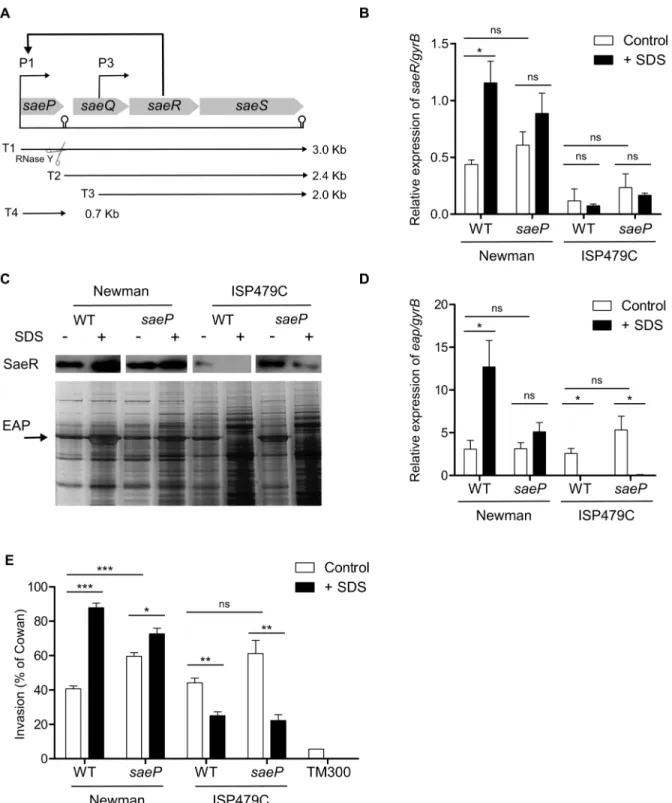
A total of four overlapping transcripts (T1–T4) are expressed in thesaeoperon from two promoters (P1 and P3) (Fig. 1A) [10]. The T1 transcript is transcribed from the strongly auto-activated P1 promoter [10]. The most abundant and stable T2 transcript is generated by endoribonucleolytic cleavage of T1 by RNase Y [10,11]. T3 is transcribed from the weak constitutive P3 promoter [10] and, finally, T4 is a monocistronic transcript coding just for saeP[12,13].
Figure 1.saePdeletion does not affect SDS-mediatedsaeactivity.(A) Schematic representation of thesaelocus with its four ORFs. Two promoters, P1 and P3 generate three primary transcripts (T1, T3, and T4). T1 processing by an endonucleolytic enzyme, RNase Y, results in T2. (B, C, D, E) Wild type andsaeP-deleted strain in Newman and ISP479C backgrounds were grown in TSB without (-) or with (+) SDS (30% MIC) until late exponential growth phase. (B) Relative expression ofsaeRin relation togyrBwas assessed by qRT–PCR. The results represent means6SEM of at least three independent experiments performed in triplicates. (C) (Lower panel) Expression of Eap was monitored by SDS PAGE and silver staining. (Upper panel) Expression of SaeR was monitored by Western blot analyses with specific antibody against SaeR. (D) Relative expression ofeapin relation togyrBwas assessed by qRT–PCR. The results represent means6SEM of at least three independent experiments performed in triplicates (E) Cellular invasion of 293 cells was measured and expressed as relative invasiveness compared toS. aureusstrain Cowan I. Results represent means6 SEM of at least three independent experiments performed in duplicates. (B,D,E) Asterisks indicate the significance of comparisons (***P,0.001; **P = 0.001–0.01; *P = 0.01–0.05; ns P.0.05).
signal described so far which seems to activate the SaeS of strain Newman.
Here we analyze the possible involvement of the upstream part of thesaeoperon (i.e.saePQ) in SDS-mediatedsaeactivation. We could show that the upstream region does not interfere with SDS signaling in any of the strains analyzed (i.e. carrying either SaeSP or SaeSL). Moreover, we could show that the auto-regulated promoter P1 is also dispensable in SDS-mediatedsaeactivation.
Materials and Methods
Bacterial Strains and Growth Conditions
Strains and plasmids used in this study are listed in Table 1.S. aureus strains were grown in TSB medium. For strains carrying resistance genes, antibiotics were used only in overnight cultures at the following concentrations: 10mg ml21erythromycin and 5mg ml21tetracycline. Bacteria from overnight cultures were diluted in fresh TSB to an initial optical density at 600 nm (OD600) of 0.05 with and without SDS 0.004% (w/v), and grown with shaking at 200 rpm at 37uC to the desired growth phase. SDS MIC of the strains used in this study was determined by microdilution (not shown). The concentration of SDS was chosen at 30% of the MIC.
Construction of the saeP Mutant
ThesaePlocus was replaced by a kanamycin resistant cassette. Briefly, two fragments flanking saeP and the KanA gene were amplified and annealed by overlapping PCR using the oligonu-cleotides listed in Table 2. The amplicon was restricted with KpnI and cloned into pBT2 [18]. To take advantage of blue-white selection, the fusion fragments were then sub-cloned into the EcoRI and SalI sites of pMAD [19], yielding plasmid pCWSAE31. This plasmid was then verified and transformed into RN4220, where mutagenesis was performed as described previously [20]. The mutant (referred to as RN4220-31) was verified by PCR and pulsed-field gel electrophoresis. After mutagenesis, the resulting mutation was transduced into the experimental strains.
Sodium Dodecyl Sulphate-polyacrylamide Gel Electrophoresis (SDS-PAGE)
For surface protein profile analysis, 5 ml ofS. aureus culture grown to the desired growth phase in 50 ml of TSB was pelleted and washed with 5 ml of PBS. Subsequently, 1 ml of the washed culture was pelleted and suspended in 40ml of Laemmli’s buffer. The suspension was boiled at 100uC for 15 min and subsequently centrifuged at 5000 rpm for 5 min. 8ml of the supernatant was loaded onto a 12% polyacrylamide gel and run at 100 V for 2 hours. After electrophoresis, proteins were stained with silver nitrate (Merck, Germany) and analyzed by a GS800 calibrated densitometer. Bands were assigned to proteins according to their migration, as previously identified by liquid chromatography-tandem mass spectrophotometry [17]. For Western blot analysis, proteins from SDS-PAGE were transferred to a nitrocellulose membrane (Watman, Dassel, Germany) using the Mini Transblot Cell system (Biorad). The membrane was blocked with blocking solution (5% skim milk and 1% Tween) for 1 h. Subsequently, nitrocellulose membranes were incubated overnight at 4uC with diluted anti-SaeR primary antibody (1:2000). The secondary antibody was an anti-rabbit immunoglobulin G horseradish peroxidase-conjugated (Jackson Immunoresearch, Germany). De-tection was done with an ECL kit (GE Healthcare, UK) following the manufacturer’s instructions.
RNA Isolation and Northern Blot Hybridization
Total RNA fromS. aureuscultures was isolated and purified by the Trizol method or RNeasy Mini Kit (Qiagen, Hilden, Germany) without any detectable differences. RNA extraction using the RNeasy Mini kit was performed according to the manufacturer’s instructions. Briefly, 2 ml ofS. aureusculture was pelleted by centrifugation at 13 000 rpm for 5 min. Subsequently, the pellet was washed with 1 ml of PBS and centrifuged at 13 000 rpm for 5 min. After the washing step, the pellet was resuspended in 700ml RLT buffer. The suspension was trans-ferred to 0.1 mm silica spheres lysing matrix tubes (MP Biomedicals Ohio, USA) and lysed by mechanical disruption in with the Fastprep-24 (MP Biomedicals Ohio, USA) at 6500 rpm for 45 sec. Following disruption of the bacterial cells, the supernatant was transferred to a 2 ml tube and centrifuged at 13 000 rpm for 10 min at 4uC. The supernatant was transferred to a new 1.5 ml tube and equilibrated with 70% ethanol. The mixture was then transferred to an RNeasy column (Qiagen, Hilden, Germany) and from this step on the manufacturer’s instructions were followed. For the trizol method, RNA isolation was performed as described previously [21]. Briefly, bacteria were lysed in 1 ml of Trizol reagent (Invitrogen) with 0.5 ml of zirconia-silica beads (0.1-mm diameter) in a high-speed homogeniser (Savant Instruments, Farming-dale, NY). RNA was then isolated as described by the Trizol manufacturer’s protocol.
Northern blot analysis was performed as previously described [21]. Digoxigenin (DIG)-labelled DNA probes for the detection of specific transcripts were generated with a DIG-labelling PCR kit as described by the manufacturer’s instructions (Roche Biochem-icals) using the oligonucleotides listed in Table 2. Detection was performed by a chemiluminescence kit (Roche, Mannheim, Germany) and subsequent exposure of X-ray films.
Quantitative Real-time RT-PCR Analysis
For quantitative RT–PCR (qRT–PCR), 1mg of total mRNA was reverse transcribed into cDNA using the Omniscript RT-PCR kit (Qiagen; Hilden, Germany) following the manufacturer’s protocol. cDNA was used for qRT-PCR analysis using the SYBR Green PCR Master Mix (Applied Biosystems; Warrington, UK). Thermal cycling, amplification and detection were performed with the StepOnePlusTM Real-Time PCR system (Applied Biosystems; Warrington, UK). Transcript abundance was calculated by the
DDCT method [22] using a dilution series of Newman wild type RNA as a standard. Subsequently, relative quantification was calculated in relation to the reference gene gyrB. Means were calculated from at least two biological replicates run in triplicates. Data were analyzed with 7300 Fast System Software (Applied Biosystems, Warrington, UK).
Flow Cytometric Invasion Assay
Cellular invasiveness of S. aureus strains to 293 cells (human embryonic kidney, also referred to as HEK293 cells) was determined as previously described with minor modifications [17]. Briefly, 5 ml ofS. aureusculture in 50 ml TSB with/out SDS as previously described was pelleted and washed with PBS. Subsequently to washing, bacteria were harvested by centrifuga-tion at 4000 rpm for 5 min at 4uC. The bacteria were labeled with 3 ml of fluorescein isothiocyanate (FITC 1 mg/ml in 10% dimethyl sulfoxide) for 30 min at 37uC. The bacteria were then washed with 5 ml of PBS and centrifuged at 4000 rpm for 5 min. After centrifugation, the pellet was suspended in 1% human serum albumin-PBS (HSA)-PBS to a final OD540of 1. For the bacterial invasion assay, the 293 cells (36105cells/well) were plated one day
washed with invasion medium (1% HSA; 10 mM HEPES) (Dulbecco’s Modified Eagle’s Medium; Life Technologies, Carls-bad, CA) and, subsequently, 0.5 ml of invasion medium was added. Then, 50ml suspension of FITC-labeled bacteria normal-ised to OD1540 nmwere added to the cells and sedimentation was allowed for 1 h at 4uC. Following sedimentation, culture plates were incubated at 37uC for 3 h with 5% CO2. Cells were then washed with 1 ml PBS and treated with monensin (25mM final, dissolved in absolute ethanol) for neutralization in order to avoid fluorescence quenching by acidic pH. Propidium iodide (PI) was added to the cells in order to differentiate between live and dead cells, and cells were analyzed on a FACSCalibur (BD; California, USA). For the measurement of invasion, a forward scatter and side scatter (FSC/SSC) gating strategy was used. Florescence of the FITC+ cells was detected in the Fl-1 channel. In control experiment of uninfected 293 cells, less than 2% of PI-positive FSC/SSC-gated cells were detected in Fl-3 channel. Thus,
experiments were run with the inclusion of PI positive cells; however, these were excluded in the final analyses.
Cellular invasiveness of S. aureus strains was determined as percentage relative of invasiveness of theS. aureusreference strain Cowan I and using Staphylococcus carnosus TM300 as negative control, as described previously [17].
Statistical Analysis
Quantitative results are presented as standard error of means (SEM). Statistical analysis was performed using the Student’s two-tailed t-test unpaired. A P value of ,0.05 was assumed as significant.
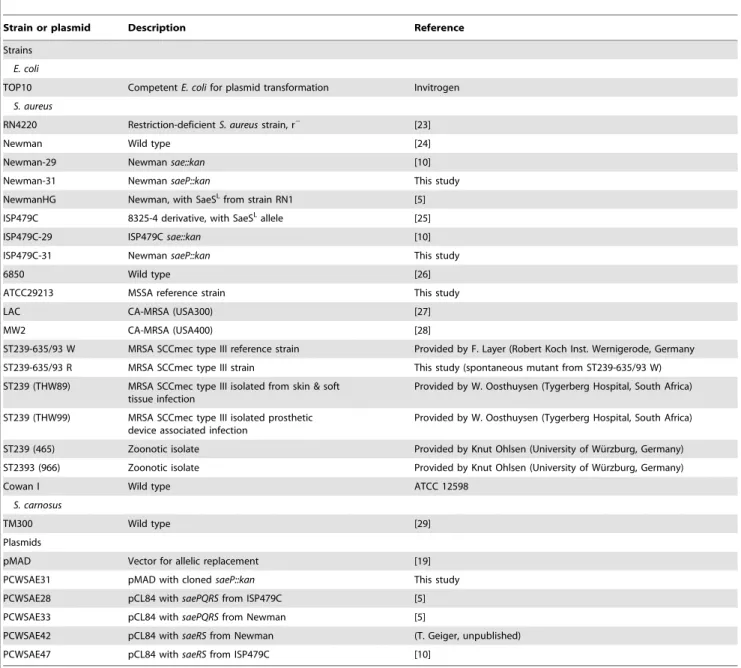
Table 1.Bacterial strains and plasmids.
Strain or plasmid Description Reference
Strains
E. coli
TOP10 CompetentE. colifor plasmid transformation Invitrogen
S. aureus
RN4220 Restriction-deficientS. aureusstrain, r2 [23]
Newman Wild type [24]
Newman-29 Newmansae::kan [10]
Newman-31 NewmansaeP::kan This study
NewmanHG Newman, with SaeSLfrom strain RN1 [5]
ISP479C 8325-4 derivative, with SaeSLallele [25]
ISP479C-29 ISP479Csae::kan [10]
ISP479C-31 NewmansaeP::kan This study
6850 Wild type [26]
ATCC29213 MSSA reference strain This study
LAC CA-MRSA (USA300) [27]
MW2 CA-MRSA (USA400) [28]
ST239-635/93 W MRSA SCCmec type III reference strain Provided by F. Layer (Robert Koch Inst. Wernigerode, Germany
ST239-635/93 R MRSA SCCmec type III strain This study (spontaneous mutant from ST239-635/93 W)
ST239 (THW89) MRSA SCCmec type III isolated from skin & soft tissue infection
Provided by W. Oosthuysen (Tygerberg Hospital, South Africa)
ST239 (THW99) MRSA SCCmec type III isolated prosthetic device associated infection
Provided by W. Oosthuysen (Tygerberg Hospital, South Africa)
ST239 (465) Zoonotic isolate Provided by Knut Ohlsen (University of Wu¨rzburg, Germany)
ST2393 (966) Zoonotic isolate Provided by Knut Ohlsen (University of Wu¨rzburg, Germany)
Cowan I Wild type ATCC 12598
S. carnosus
TM300 Wild type [29]
Plasmids
pMAD Vector for allelic replacement [19]
PCWSAE31 pMAD with clonedsaeP::kan This study
PCWSAE28 pCL84 withsaePQRSfrom ISP479C [5]
PCWSAE33 pCL84 withsaePQRSfrom Newman [5]
PCWSAE42 pCL84 withsaeRSfrom Newman (T. Geiger, unpublished)
PCWSAE47 pCL84 withsaeRSfrom ISP479C [10]
Results and Discussion
Influence of Saep on SDS-mediated Sae Activity
To determine whether SaeP is involved in the sae mediated response to sub-inhibitory concentration of SDS, saeP deletion mutants were generated in differentS. aureusstrains. Previously, we have shown that the point mutation in the sensor histidine kinase SaeS characteristic of strain Newman alters the response to SDS [17]. Therefore, saeP deleted mutants were generated both in strains Newman (carrying the SaeSPallele) and in strain ISP479C (carrying the SaeSLallele).
SDS response of the wild types andsaePmutants was monitored with different methods.saeRand SaeR expression were quantified by qRT-PCR and Western blot analyses (Fig. 1B and Fig. 1C: upper panel) respectively.eapand Eap expression were monitored qRT-PCR (Fig. 1D) and by SDS PAGE (Fig. 1C: lower panel), respectively. Moreover, since Eap is known to mediate S.aureus invasion of eukaryotic host cells [4], cellular invasion assays were performed (Fig. 1E).
As expected, SDS treatment resulted in a significant activation of saeR expression in strain Newman but slight (non-significant) reduction ofsaeRin strain ISP479C. Interestingly, deletion ofsaeP did not prevent induction or repression of saeR in either strain Newman or ISP479C (Fig. 1B). SaeR protein detection by Western blot analysis mirrored the eap transcription data and confirmed the diminished SaeR production upon SDS stress in strain ISP479C (Fig. 1C: upper panel). As expected, SDS treatment resulted in significant increase in eap expression in strain Newman [17] but repression in strain ISP479C (Fig. 1C,
lower pane and Fig. 1D). Deletion ofsaePdid not alter this pattern of regulation (i.e. increaseeap expression in strain Newman and decrease eap expression in strain ISP479C). Further on, the NewmansaePand ISP479CsaePmutants were tested for cellular invasiveness to 293 cells. The invasion data mirrored the eap expression (Fig. 1E). All these data taken together suggest that SaeP is not required forsae-mediated response to SDS.
Interestingly,saePdeletion led to an increased cellular invasive-ness of Newman background. This last observation is in agreement with a recent study where SaeP together with SaeQ was shown to act as a suppressor of SaeRS mediated signaling [8].
Saepq is not Needed for Sae-mediated Response to SDS The data presented above strongly suggest that SaeP is not needed for sae-mediated response to SDS. To further analyze whether SaeQ or the P1 promoter interferes with SDS sensing, we studied thesae-mediated response to SDS in strains in which only saeRS was expressed from its native, constitutive P3 promoter, whose activity was previously shown to be independent of SaeR [10]. Constructs containingsaeRSLorsaeRSPwere integrated into the chromosome ofsaedeletion strains. As controls, Newman wild type, and saePQRS deleted strains complemented with an integrated copy of the whole operon from the strain Newman (saePQRSP) or from strain ISP479C (saePQRSL) were included in the analyses.
Modulation of sae expression by SDS was analyzed using Northern blot hybridization withsaeR-specific probes (Fig. 2A). As expected, SDS treatment led to an increase insaetranscription in Table 2.Oligonucleotides.
Purpose Template Name Sequence
Mutagenesis
saePreplacement mutant
ISP479C Kpnsae-for CGGGGTACCATACTACAGTTTTACATT
Kpn-ORF4-rev CACCTCGGTACCCTGTTCTTACGACCTCTAAAG
ISP479C HybridORF4a-rechts TAAAAGTTCGCTAGATAGGGGTCCCCTTCC
TGTTCACATAACA
Hybridsae-links TCCAATTCTCGTTTTCATACCTCGGAGCTAA
CTCCTCATTTCTTCAATTT
Newman-29 kanR-for CCGAGGTATGAAAACGAGAATTGG
kanR-rev GGGACCCCTATCTAGCGAACTTT
DIG DNA probes
sae RN6390 sae1980-for TGGTCACGAAGTCCCTATGC
sae2458-rev TGCTTGCGTAATTTCCGTTAG
eap RN6390 Map w 98 AATAATAATGAAGCGTCTGC
Map w 650 CGGTAATACCTCTATTTGATT
ribD-dig-rev CAAAGTTCCAACTCCTCTTTTA
qRT-PCR
saeR saeRS-up AAACTTGCTTGATAATGCGCTAAA
saeRS-dw TTCTGGTATAATGCCAATACCTTCA
gyr gyrB-up TTAGTGTGGGAAATTGTCGA
gyrB-dw CCGCCGAATTTACCACCAGC
eap eap-up AAGCGTCTGCCGCAGCTA
eap-dw TGCATATGGAACATGGACTTTAGAA
Newman wild type (Fig. 2A, lane 2) [17]. The same induction was observed in asae-deleted strain complemented withsaePQRSP, thus indicating that the plasmid system used did not interfere with the analyses. In accordance, thesae-deleted strain complemented with
saePQRSLresponded to SDS in the same way that ISP479C (i.e.a decrease insaeRlevels) (Compare Fig. 1B and Fig. 2A).
In thesae-deleted strains complemented withsaeRSPorsaeRSL, a very weak expression ofsaeR was observed by Northern blot. In order to quantifysaeRexpression in these strains, qRT-PCR was
Figure 2.saePQis not needed forsaemediated response to SDS.Wild type (Newman),sae-deleted, andsae-deleted strains complemented withsaePQRSP,saeRSP,saePQRSL,and saeRSLwere grown in TSB with or without SDS (30% MIC) until late exponential phase. (A) RNA was hybridized with a digoxigenin-labelledsaeR-specific probe. 16S rRNA detected in ethidium bromide-stained gels is shown as a loading control. (B) Relative expression ofsaeRin relation togyrBassessed by qRT–PCR. Results represent means6SEM of at least three independent experiments performed in triplicates. (C) RNA was hybridized with a digoxigenin-labeledeap-specific probe. (D) Cellular invasiveness was measured in 293 cells and expressed as relative invasiveness compared toS. aureusstrain Cowan I. Results represent means6SEM of at least three independent experiments performed in duplicates. (B,D) Asterisks indicate the significance of comparisons (**P = 0.001–0.01; *P = 0.01–0.05).
doi:10.1371/journal.pone.0071644.g002
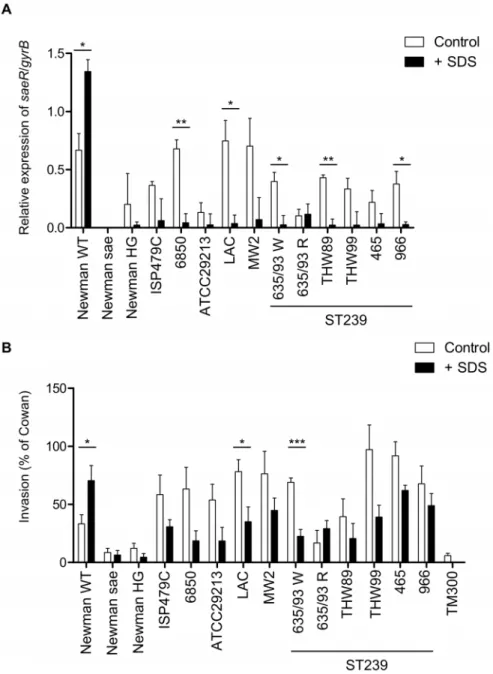
Figure 3. SDS stress affectsS. aureus saesignaling in a strain-dependent manner.(A) Relative expression ofsaeRin relation togyrBwas assessed by qRT–PCR in various clinical isolates and in control strains at late exponential phase of growth. Results represent means6SEM of at least three independent experiments performed in triplicates. (B) Cellular invasiveness into 293 cells was measured and expressed as relative invasiveness compared toS. aureusstrain Cowan I. Results represent means6SEM of at least three independent experiments performed in duplicates. (A,B) Asterisks indicate the significance of comparisons (***P,0.001; **P = 0.001–0.01; *P = 0.01–0.05).
performed. As indicated in Fig. 2B,saeRlevels in both the strain complemented withsaeRSPandsaeRSLwas detectable at a similarly low level consistent with the weak activity from the P3 promoter. Moreover, thesaeRSonly constructs showed no altered expression in response to SDS exposure. This is in accordance with the fact thatsaeRSexpression in these strains is exclusively dependent on the P3 promoter and therefore not subjected to P1 auto-regulation.
Next, the impact of the lack ofsaePQon the modulation ofeap expression by SDS was monitored by Northern blot analyses with the use of a specific probe against eap (Fig. 2C) and by cellular invasion assays (Fig. 2D).
An SDS modulation ofeapexpression was observed in all strains analyzed except for the sae deletion mutant. As expected, SDS treatment led to increase or decrease of eap expression in the saePQRSPand in thesaePQRSLcomplemented strain, respectively (Fig. 2C). Interestingly,eapexpression in the strains complemented withsaeRSPor withsaeRSLis still responsive to SDS stress (Fig. 2C), despite very low and SDS independentsaeRSexpression (Fig. 2B). This is in accordance to previous results showing that target gene expression is mostly dependent on SaeS activity with a minor impact of the SaeRS concentration [5,9]. These data were corroborated by the cellular invasion assay (Fig. 2D) which strongly correlates witheapexpression.
From these results we can speculate that SDS might possibly interact with the transmembrane part of SaeS protein either directly or through membrane perturbation. In strains harboring the native SaeSLallele, SDS presumably leads to conformational changes resulting in a shift from kinase to the phosphatase activity. Lately, phosphatase activity was proposed to be enhanced by interaction with SaePQ [8]. However, SDS seems to control this switch independently of SaePQ. Of note, in strain Newman, harboring the SaeSPallele, SDS has the opposite effect leading to a further activation of the already hyper-activated SaeS. This could be due to a further increase in kinase activity or alternatively to an inhibition of the low residual phosphatase activity in this strain. However, more experimental work is needed to substantiate this hypothesis.
SDS Stress AffectsS. aureus saeExpression in a Strain-dependent Manner
Until now, the only strain which showed an up-regulation of the saeresponse by SDS was strain Newman [17]. We decided then to monitor the SDS response in various clinical strains by specific saeRqRT-PCR and the cellular invasion assay (Fig. 3). As controls, Newman wild type, an isogenic saePQRS deletion mutant and strain Newman HG (where thesaeSpoint mutation is reverted to the wild type [5]) were included in the analyses. With one exception, treatment with SDS resulted in inhibition of sae expression in all clinical strains analyzed (Fig. 3A). In the isolate
ST239-635/93RsaeRexpression was low and no significant effect by SDS was observed (Fig. 3A). The sequence of the whole saePQRSoperon was identical to those of strain 8325 and USA300 FPR3757 available from public databases. Interestingly, isolates which are closely related to ST239-335/93R all responded to SDS with down-regulation ofsaeR(Fig. 3A). Thus, the isolate ST239-635/93R seems to be unique with regard to the SDS response although no mutations insaeSorsaePQRwere detectable (data not shown).
Finally we analyzed whether SDS has a similar effect on the cellular invasion in clinical isolates (Fig. 3B). With one exception, treatment with SDS resulted in inhibition of cellular invasiveness capacities in all clinical strains analyzed (Fig. 3B). The isolate ST239-635/93R had a different (although not significant) response to SDS, namely enhance invasiveness to 293 cells by SDS. The mechanism by which SDS is able to enhance invasiveness of this strain remains to be elucidated.
It is interesting to note that strain Newman is not only peculiar with regard to SaeS but it is also characterized by non-functional FnBPs. Thus, in this strain invasion is only triggered by Eap. In the other strains analyzed, FnBPs are presumably the major invasins which play a role. Thus, the SDS effect on invasion may also be due to SDS-mediated down/up-regulation of FnBPs in these strains.
Conclusion
From the data presented here, it can be concluded that SaePQ is not required for SDS-mediated SaeS signaling. SDS seems to interfere directly with the SaeS kinase/phosphatase activity and this activity is closely linked to the expression of Eap and the capacity of S. aureus to invade host cells. Interestingly a single amino acid exchange (Leu to Pro; L18P) in the putative transmembrane domain of SaeS leads to an opposite output of the SDS mediated signal. This suggests that SaeS activity can be directly modulated by structurally non-complex environmental signals, possibly by altering its kinase/phosphatase activity.
Acknowledgments
We thank Heidi Linß, Barbara Conrad, Lisa Pollak, Nadine Leitschuh, Vittoria Bisanzio and Natalya Korn for excellent technical assistance. We would also like to thank Tina Scha¨fer and Stephanie Donat for the valuable advice.
Author Contributions
Conceived and designed the experiments: PEM GM EW CW WZ QL TB BS. Performed the experiments: PEM GM QL. Analyzed the data: PEM GM TG CW WZ BS. Contributed reagents/materials/analysis tools: DS TG CW WZ TB BS. Wrote the paper: PEM GM CW WZ BS.
References
1. Kluytmans J, Van Belkum A, Verbrugh H (1997) Nasal carriage ofStaphylococcus aureus: epidemiology, underlying mechanisms, and associated risks. Clin Microbiol Rev 10: 505–520.
2. Lowy FD (1998)Staphylococcus aureusinfections. N Engl J Med 339: 520–532. 3. Foster TJ (2004) TheStaphylococcus aureus‘‘superbug’’. J Clin Invest 114: 1693–
1696.
4. Sinha B, Fraunholz M (2010)Staphylococcus aureushost cell invasion and post-invasion events. Int J Med Microbiol 300: 170–175.
5. Mainiero M, Goerke C, Geiger T, Gonser C, Herbert S, et al. (2010) Differential target gene activation by theStaphylococcus aureustwo-component systemsaeRS. J Bacteriol 192: 613–623.
6. Grundmeier M, Hussain M, Becker P, Heilmann C, Peters G, et al. (2004) Truncation of fibronectin-binding proteins inStaphylococcus aureusstrain Newman leads to deficient adherence and host cell invasion due to loss of the cell wall anchor function. Infect Immun 72: 7155–7163.
7. Giraudo AT, Calzolari A, Cataldi AA, Bogni C, Nagel R (1999) Thesaelocus of
Staphylococcus aureus encodes a two-component regulatory system. FEMS Microbiol Lett 177: 15–22.
8. Jeong D-W, Cho H, Jones MB, Shatzkes K, Sun F, et al. (2012) The auxiliary protein complex SaePQ activates the phosphatase activity of sensor kinase SaeS in the SaeRS two-component system ofStaphylococcus aureus. Mol Microbiol 86: 331–348.
9. Jeong D-W, Cho H, Lee H, Li C, Garza J, et al. (2011) Identification of the P3 Promoter and Distinct Roles of the Two Promoters of the SaeRS Two-Component System inStaphylococcus aureus. J Bacteriol 193: 4672–4684. 10. Geiger T, Goerke C, Mainiero M, Kraus D, Wolz C (2008) The virulence
11. Marincola G, Scha¨fer T, Behler J, Bernhardt J, Ohlsen K, et al. (2012) RNase Y ofStaphylococcus aureusand its role in the activation of virulence genes. Mol Microbiol 85: 817–832.
12. Adhikari RP, Novick RP (2008) Regulatory organization of the staphylococcal
saelocus. Microbiology 154: 949–959.
13. Steinhuber A, Goerke C, Bayer MG, Do¨ring G, Wolz C (2003) Molecular architecture of the regulatory LocussaeofStaphylococcus aureusand its impact on expression of virulence factors. J Bacteriol 185: 6278–6286.
14. Novick RP, Jiang D (2003) The staphylococcal saeRS system coordinates environmental signals with agr quorum sensing. Microbiology 149: 2709–2717. 15. Kuroda H, Kuroda M, Cui L, Hiramatsu K (2007) Subinhibitory concentrations of beta-lactam induce haemolytic activity inStaphylococcus aureusthrough the SaeRS two-component system. FEMS Microbiol Lett 268: 98–105. 16. Blickwede M, Goethe R, Wolz C, Valentin-Weigand P, Schwarz S (2005)
Molecular basis of florfenicol-induced increase in adherence ofStaphylococcus aureusstrain Newman. J Antimicrob Chemother 56: 315–323.
17. Scha¨fer D, Laˆm T-T, Geiger T, Mainiero M, Engelmann S, et al. (2009) A point mutation in the sensor histidine kinase SaeS of Staphylococcus aureus strain Newman alters the response to biocide exposure. J Bacteriol 191: 7306–7314. 18. Bru¨ckner R (1997) Gene replacement inStaphylococcus carnosusandStaphylococcus
xylosus. FEMS Microbiol Lett 151: 1–8.
19. Arnaud M, Chastanet A, De´barbouille´ M (2004) New vector for efficient allelic replacement in naturally non transformable, low-GC-content, gram-positive bacteria. Appl Environ Microbiol 70: 6887–6891.
20. Bae T, Schneewind O (2006) Allelic replacement inStaphylococcus aureuswith inducible counter-selection. Plasmid 55: 58–63.
21. Goerke C, Campana S, Bayer MG, Do¨ring G, Botzenhart K, et al. (2000) Direct quantitative transcript analysis of the agr regulon ofStaphylococcus aureusduring human infection in comparison to the expression profile in vitro. Infect Immun 68: 1304–1311.
22. Schmittgen TD, Livak KJ (2008) Analyzing real-time PCR data by the comparative C(T) method. Nat Protoc 3: 1101–1108.
23. Kreiswirth BN, Lo¨fdahl S, Betley MJ, O’Reilly M, Schlievert PM, et al. (1983) The toxic shock syndrome exotoxin structural gene is not detectably transmitted by a prophage. Nature 305: 709–712.
24. Duthie ES, Lorenz LL (1952) Staphylococcal coagulase; mode of action and antigenicity. J Gen Microbiol 6: 95–107.
25. Pattee PA (1981) Distribution of Tn551 insertion sites responsible for auxotrophy on theStaphylococcus aureuschromosome. J Bacteriol 145: 479–488. 26. Balwit JM, Van Langevelde P, Vann JM, Proctor RA (1994)
Gentamicin-resistant menadione and hemin auxotrophicStaphylococcus aureuspersist within cultured endothelial cells. J Infect Dis 170: 1033–1037.
27. Diep BA, Gill SR, Chang RF, Phan TH, Chen JH, et al. (2006) Complete genome sequence of USA300, an epidemic clone of community-acquired meticillin-resistantStaphylococcus aureus. Lancet 367: 731–739.
28. Baba T, Bae T, Schneewind O, Takeuchi F, Hiramatsu K (2008) Genome sequence of Staphylococcus aureusstrain Newman and comparative analysis of staphylococcal genomes: polymorphism and evolution of two major pathoge-nicity islands. J Bacteriol 190: 300–310.
29. Que Y-A, Haefliger J-A, Piroth L, Franc¸ois P, Widmer E, et al. (2005) Fibrinogen and fibronectin binding cooperate for valve infection and invasion in