Abstract—Currently, an important and challenging task in genetic associations studies is the identification of common complex multi-factorials for diseases susceptibility. Given the significant computational association between SNPs with genotypes (SNP barcodes), current statistical methods have difficulty computing all possible combinations of SNPs with genotypes. This study proposes an improved particle swarm optimization (PSO), which is combined with the time varying acceleration method to overcome this challenge. The proposed method, called PSO-TVAC, is used to compute the association of genotype frequencies of case and control data based on statistical analysis. We systematically evaluated the method on the combined effect of 19 SNPs from seven published oxidative damage repair-related genes involved in breast cancer-related pathways. Odds ratio and risk ratio analyses are used to estimate SNP barcodes with significant differences between controls and cases. The estimated OR of the best SNP combination with genotypes (called the SNP barcode) is significantly greater than 1 (between 1.11 and 1.61) for specific combinations of two to seven SNPs in high risk groups. The results show that PSO-TVAC successfully improves on the inherent disadvantages of PSO for the identification of high-order SNP barcodes.
Index Terms—SNP-SNP interaction, Particle Swarm Optimization, Time varying acceleration.
I. INTRODUCTION
enome-wide case-control association studies (GWAS) have been widely used to identify a set of single nucleotide polymorphisms (SNPs) to determine which are most closely associated with disease and cancer [1-4]. Many studies have hypothesized that the risk of disease and cancer is associated with the co-occurrence of SNPs on the genetic and phenotypic variability among individuals. The associations between cases and controls were found to significantly impact their susceptibility to disease and cancer. However, association studies for multiple SNP candidates remain computationally challenging. The "SNP barcode" used in this study can be regarded as an SNP genotype
C.H. Yang is with the Department of Electronic Engineering, National Kaohsiung University of Applied Sciences, 80778, Kaohsiung Taiwan (phone: 886-7-3814526#5639; E-mail: [email protected]).
Y.D. Lin is with the Department of Electronic Engineering, National Kaohsiung University of Applied Sciences, 80778, Kaohsiung, Taiwan (E-mail: [email protected]).
L.Y. Chuang is with the Department of Chemical Engineering, I-Shou University , 84001 , Kaohsiung, Taiwan (E-mail: [email protected]).
combination, e.g., TT, TC and CC for an SNP with a T/C polymorphism.
The possible combinations of SNP barcodes between cases and controls can be computed as C(X,Y)*3Y, where X is the total number of SNPs, and Y is the number of selected SNPs. Many computational approaches have been proposed to examine epistasis in family-based and case-control association studies [5-10]. However, these methods were not sufficiently robust to simultaneously evaluate the complex interactions for all SNPs in several genes. Evolutionary algorithms (e.g., particle swarm optimization (PSO) [11] and genetic algorithms (GA) [12]) have been shown to be effective in reducing the number of search items among a greater number of SNP combinations. However, the PSO and GA methods do not guarantee that every implemented result contains a relevant solution when the SNP number is excessively large.
In this study, 24 SNPs obtained from seven oxidative damage repair-related genes (CAT, GPX1, GPX4, GSR, SOD2, TXN, and TXNRD2) which had been used to investigate single-factor association with breast cancer [13], were used to analyze multi-factor association with breast cancer. Our previous study [13] determined the effect of individual SNPs, but did not investigate their association with SNPs. However, analysis of association with SNPs might provide further insight into disease susceptibility.
We hypothesize that the interactions between polymorphisms of oxidative damage repair-related genes could have a synergistic effect on the pathogenesis of breast cancer, and differences between cases and controls can explain interactions in disease susceptibility. We propose the PSO-TVAC method to generate a SNP barcode to analyze the risk factors of disease susceptibility. The best combination of SNPs with genotypes can be verified by computing the odds ratio (OR) and its confidence intervals. We systematically evaluate the combination effects of 24 SNPs from seven oxidative damage repair-related genes involved in breast cancer. The SNP barcode generated by the PSO-TVAC algorithm is found to be statistically significant in predicting susceptibility to breast cancer, and the identified differences between cases and controls were an improvement over the PSO algorithm.
II.METHOD
A. Particle Swarm Optimization (PSO)
The particle swarm optimization algorithm (PSO) was
Analysis of Disease Susceptibility Using Particle
Swarm Optimization - Time Varying
Acceleration to Generate SNP-barcode
Cheng-Hong Yang, Member, IAENG, Yu-Da Lin, and Li-Yeh Chuang
developed by Kennedy and Eberhart [14] as an evolutionary computation algorithm that simulates social behavior based on information exchange. In PSO, the solution to the problem can be found in the particles of population. Each particle adjusts its vector according to its experience and the swarm experience to converge on a location to search for a good solution. The basic elements of PSO are described below: 1) Population: A population consists of N particles.
2) Particle vector,
x
i: A solution can be represented by a D-dimensional vector; the ith particle can be described as)
,
,
,
(
i1 i2 iDi
x
x
x
x
, wherex
iD is a Dth dimensional value.3) Particle velocity,
v
i: The velocity of the ith particle is represented byv
i
(
v
i1,
v
i2,
,
v
iD)
, wherev
iD is a velocity value in the Dth dimension. In addition, each velocity must be limited within
DV Vmin, max .
4) Inertia weight, w: The w controls the impact of the particle’s previous velocity on its current velocity. This control parameter affects the trade-off between the particle’s exploration and exploitation abilities.
5) Individual best value, pbesti: pbesti is the vector of the ith
particle with the highest fitness value at a given iteration. 6) Global best value, gbest: The gbest is the best vector amongst the particles’ pbest.
7) Termination criteria: Stop condition of the PSO procedure.
The PSO procedure can be divided into four steps. First, the position and velocity of each particle in the population was randomly generated. Second, the pbesti for each particle
was updated by comparing its current fitness to the fitness of pbest. Third, the common knowledge (i.e., gbest) was updated according to the best pbest amongst the population. Fourth, the position of each particle was updated according its pbest and gbest. The update equations can be formulated as:
old
id d old id id old id new id x gbest r c x pbest r c v w v 2 2 1 1 (1) new id old id new
id
x
v
x
(2)where w is the inertia weight which is a positive linear function of time that changes with the generations, r1 and r2
are random numbers between (0, 1), and c1 and c2 are
acceleration constants that control how far a particle moves in a single generation. Velocities new
id
v and old id
v respectively denote the new and old velocity of the particle, while old
id
x is the current particle position, and new
id
x is the updated particle position. The velocity implies the distance to which the particle’s position should be moved in a generation, so that the velocity can move the particle towards the best position. The particles’ velocities in each dimension were limited to within [Vmin, Vmax]D, and the particles’ positions are limited
within [Xmin, Xmax]D.
B. Particle swarm optimization - time varying acceleration
coefficients (PSO-TVAC)
In PSO, the learning factors c1 and c2 represent the
acceleration constants, which are usually equal to 2. c1 and c2
can influence the particle's search direction between the pbest and gbest vectors, in which c1 controls exploitation search
and c2 controls exploration search. Unlike the PSO algorithm,
the idea of PSO-TVAC is that c1 and c2 can be adjusted
through the iteration number. The factor c1 decreases from
2.5 to 0.5 through the iterations, while the factor c2 increases
from 0.5 to 2.5. The linear adjustments of c1 and c2 are
defined in Eqs. 3 and 4:
1max 1min
1min1 max _ c iteration iteration c c
c
(3)
2max 2min
2min2 max _ c iteration iteration c c
c
(4)
where c1max and c1min respectively express the initial and
maximal values in c1, while c2max and c2min respectively
express the initial and maximal values in c2, iteration is the
present iteration number, and iteration_max is the maximal iteration number. Therefore, the TVAC method can adjust the search behavior from exploitation to exploration, thus preventing particle dispersion and early convergence. C. Application of the PSO-TVAC algorithm
a)Encoding schemes
In PSO-TVAC, the particle of population is defined as a vector divided into two parts: the selected SNPs and their genotypes, in which SNPs cannot be repeatedly selected. The particle encoding can be represented as follows:
Particlei = (SNPi,j, genotypei,j), i=1, 2… m, j=1, 2,…, n
where SNPi,j represents the selected SNPs, genotypei,j
represents the genotypes (i.e., types AA, Aa, and aa) once SNP i,jis selected, m is the size of the population and n is the
number of SNPs selected. In the initialization step, the particle is randomly generated in each dimension. For example, the initial particle is randomly generated and represented as particle = (SNP2,4,6, Genotype1,2,3). In the
particle, SNP3,4,8 represents the chosen SNPs (2,4,6), and
Genotype1,2,3 represents the chosen genotypes (1,2,3). In this
case, selected SNPs and SNPs associated with the genotypes were as follows: (2,1), (4,2) and (6,3).
b)Fitness function
A fitness value was used to compute the difference between cases and controls from the SNP barcode. The goal is to determine the highest fitness value, i.e., the maximum difference between cases and controls. The concept of fitness uses the intersection of set theory to compute the case and control sets that contain all elements of one of these sets that also belong to the other, but no other elements. The relevant equation is as follows:
where the number( ) symbol denotes the total number of elements in a set, C denotes the total number of SNP barcodes in the case group, N represents the total number of SNP barcodes in the control group, and particlei represents the ith
particle. The fitness function can be divided into three separate steps. First, the total number of intersections of the cases and ith particle is calculated as number(C∩particlei).
Second, the total number of intersections of the controls and ith particle is calculated as number (N∩particlei). Finally, Eq.
5 is used to calculate the fitness value of the intersections of the cases and controls.
For example, we assume a particle= (SNP2,5, genotype1,3)
to compute the fitness. First, we calculate the control number for SNP2 with genotype 1 and SNP5 with genotype 3. The
number of cases matching the SNP2with genotype 1 includes
171 samples in the breast cancer data. Second, we calculate the number of controls independently matching the SNP5
with genotype 3 as including 121 samples. According to Eq. (5), the fitness value is calculated by subtracting 171 from 121, giving 50.
c)Update pbest and gbest
Updating the pbest of particle and gbest of the population aims to move the particle toward a better search location. The particle attempts to find its best position (pbest) and the global best position (gbest). If the fitness value of a particle P in the current iteration is better than the fitness value of pbest in the previous iteration, then pbest is updated to P. If the fitness value of a particle's pbest in the current iteration is better than gbest in the previous iteration, then the gbest is updated to the pbest. The particle then adjusts its direction based on pbest and gbest in the following iteration.
The PSO-TVAC pseudo-code is shown below to describe how the algorithm collocates data through the above-mentioned procedure to obtain the best SNP barcode for breast cancer.
PSO-TVAC pseudo-code
01: Begin
02: Initialize population
03: While (number of iterations, or the stopping criterion is not met) 04: Evaluate fitness of population via Eq. 5
05: Forn = 1 to number of particles 06: Find pbest
07: Find gbest
08: Ford = 1 to number of dimension of particle 09: Update the position of particles via Eqs. 1 and 2 10: Nextd
11: Nextn
12: Update the c1 and c2 value via Eqs. 3 and 4
13: Continue generation until stopping criterion is met
III. RESULT AND DISCUSSION
A.Parameter settings
Both termination conditions for both of PSO and PSO-TVAC are reached at the after 100 iterations. Population size is equal to 50. The sets of parameters c1 and c2 of PSO are
equal to 2. In PSO-TVAC, both parameters c1_max and c2_min are
equal to 2.5; both parameters c1_min and c2_max are equal to 0.5.
Vmax is equal to (Xmax – Xmin) and Vmin is equal to – (Xmax – Xmin).
B.Data sets
The data sets consist of SNP genotype frequencies published in the literature [13]. The dataset was collected from the oxidative damage repair-related genes (65 SNPs for 11 genes) in the breast cancer association study. The genotype frequencies of our simulated data are identical to the original raw data for the genotypes frequencies [13]. Therefore, we used the SNP genotype frequencies to simulate the case and control data (5000 samples). The simulated data was randomly generated and thus obeyed the original genotype frequency in the whole dataset. We assumed that the amounts of three genotypes AA, Aa and aa in the SNPin the original data were 2132, 1970 and 449, respectively. We calculated the percentage of each genotype, i.e., 2132/4551 (47%) for AA, 1970/4551 (43%) for Aa and 449/4551 (10%) for aa. The simulated data for the SNP rs3020314is then generated according to these three percentages, i.e., 47%× 5000=2350 for AA, 43%×5000=2150 for Aa and 10%×5000=500 for aa. The simulated data for the SNP has thus been controlled to 5000 (2350+2150+500=5000). The above procedure is shown in the "Pseudo-code for randomly generated data" below.
Pseudo-code for randomly generated data
01: begin
02: Set size = 5000
03: Set number of genotype = 3 04: Calculate amount of three genotypes 05: while (all SNPs are not controlled) 06: Calculate amount of each genotype
07: Calculate numbers of each controlled genotype 08: forn = 1 to number of genotype
09: Randomly create numbers of each controlled genotype 10: next n
11: end
C.Performance measurement using statistical analysis In this study, five statistical analysis were used to determine the SNP barcode [15] as below.
TN FP FN TP
TN TP
Correct (6)
TN FP
TN FN
TP TP
Specificity y
Sensitivit (7)
TN FN
TN FP TP
TP
NegativePredictiveValue(NPV) (PPV)
Value Predictive Positive
(8)
FN) (TP FP
TN) (FP TP
Ratio
Risk (9)
FN FP
TN TP
Ratio
Odds (10)
same as the overall risk estimated from all cases and controls. A larger OR value (>1) indicates a risk association between the SNP barcode and the disease. Similarly, a lower OR value (<1) indicates a protective association between the SNP barcode and the disease.
D. Identification of best SNP barcode
As shown in Table I, among the order SNP barcodes three specific combined SNPs with genotypes (i.e., SNPs (4,12,20) with genotype 2-1-1 ; [rs757229-Aa]-[rs4135179-AA]- [rs2073752-AA]) showed the maximal difference between breast cancer and non-cancer groups. Similarly, two to seven best-performing combined-SNP barcodes are mined by PSO-TVAC (Table I) through the complete result set. The PSO-TVAC provides a good difference between the breast cancer and non-cancer groups with a fixed number of SNPs.
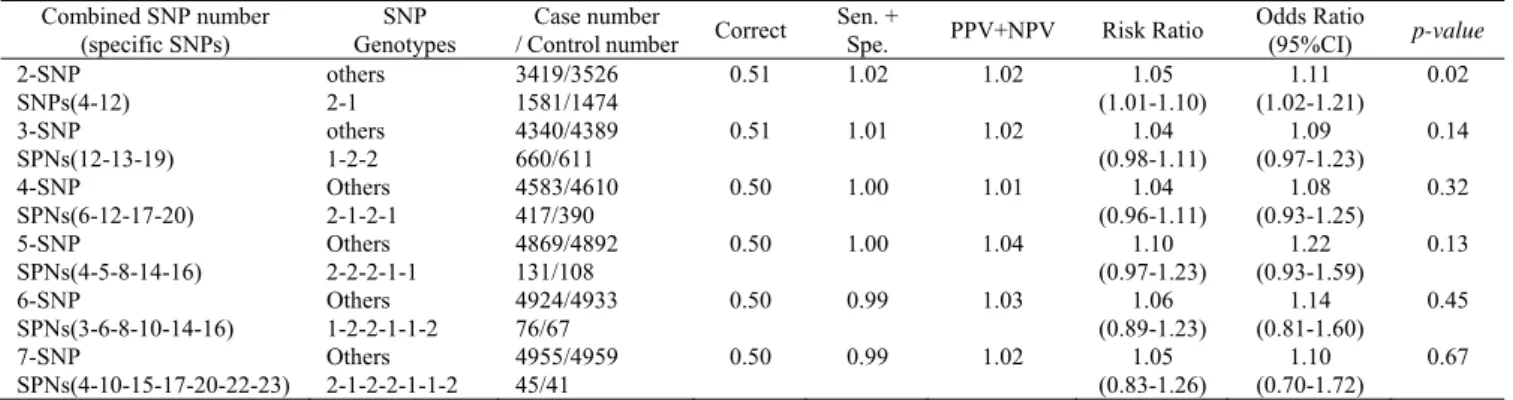
E.Analyzing the ranks of OR and RR for breast cancer The OR was widely applied in medical reports and offers a very important interpretation in case-control studies. An OR value bigger than 1 indicates a stronger association between cases and controls for the risk of disease. Table I shows the risk association with specific SNP barcodes and other combinations (two to seven) in breast cancer. The OR values (1.11-1.61) and the RR values (1.05-1.24) increase with the number of SNP combinations in high risk cases. We observed that the PSO-TVAC (Table I) provides higher OR values (1.11-1.61) with two to seven order SNP barcodes for the risk of breast cancer. The number of case groups was greater than the number of control groups, which means the SNP barcode can influence the risk of breast cancer. Thus, women with the specific SNP barcode implied a risk ratio that represented significantly increased OR values of 1.11-1.61 for breast cancer. The results suggested that genes with these SNP barcodes represent a risk for breast cancer. On the other hand, Table II showed the PSO only identified an available SNP barcode in 2-SNP which was determined by the p-value. The p-value represented the confidence level of results analysis and, to be significant, a result has to be over 0.05. PSO (Table II) only provides the OR (1.11-1.22) values with two to seven order SNP barcodes for the risk of breast cancer. Therefore, the PSO-TVAC provided a better differentiation in terms of association of the fixed SNP barcode between the cases and controls.
F.Comparing PSO-TVAC with PSO for SNP-SNP interaction in breast cancer
In this study, we investigated the association for case-control studies with multiple-SNPs to analyze 24 SNPs obtained from seven oxidative damage repair-related genes in breast cancer. The SNPs involved in the analysis of association studies were difficult to compute, especially the very high-order SNPs which were also investigated. We proposed a PSO-TVAC algorithm to perform a powerful
identification of SNP-SNP interactions for breast cancer. The statistical methods, such as p-value, OR and its 95% CI, provided strong evidence to explain the ability of PSO-TVAC to identify the best difference between cases and controls.
Tables I and II show the combinations of 2- to 7-SNPs with their associated genotypes. The results were compared with the differences between cases and controls. The combination of 2-SNP with their corresponding genotypes, SNPs (4, 12) with genotype 2-1, [rs757229-Aa]-[rs4135179-AA], were identified as having 107 differences between the case group and control group (1581 vs. 1474) by PSO-TVAC and PSO. The results for 3- to 7-SNPs clearly show that the PSO-TVAC exhibited superior searching ability to that of the PSO in terms of comparison between the cases and controls. For example, in a 3-SNP combination, the combination consists of SNPs (4, 12, 20) with genotype 2-1-1 ([rs757229-Aa]-[rs4135179-AA]-[rs2073752-AA]), which was identified as having an 89 difference value by PSO-TVAC. On the other hand, PSO identified the combination consisting of SNPs (12, 13, 19) with genotype 1-2-2 ([rs4135179- AA]-[rs2301241-Aa]-[rs1548357-Aa]) as having a difference value of 49.
The time varying acceleration can be observed in Eq.1; it was only used to change the values of c1 and c2 in the original
PSO updating equation. The computational complexities of PSO and PSO-TVAC can be estimated by the fitness function computation. We defined i and p respectively as the number of iterations and the number of particles. The fitness function computation can then be represented as the computational complexity of O(ip), in which O() was the big O notation.
IV. CONCLUSION
Table I
ESTIMATED BEST SNP COMBINATIONS ON THE OCCURRENCE OF BREAST CANCER BY TVAC-PSO Combined SNP number
(specific SNPs)
SNP Genotypes
Control number
/ Case number Correct
Sen. +
Spe. PPV+NPV Risk Ratio
Odds Ratio
(95%CI) p-value 2-SNP SNPs(4-12) others 2-1 3419/3526 1581/1474
0.51 1.02 1.02 1.05 (1.01-1.10) 1.11 (1.02-1.21) 0.02 3-SNP SPNs(4-12-20) others 2-1-1 4149/4238 851/762
0.51 1.02 1.03 0.07 (1.01-1.12) 1.14 (1.02-1.27) 0.02 4-SNP SPNs(4-12-14-20) Others 2-1-1-1 4624/4684 376/316
0.51 1.01 1.04 1.09 (1.01-1.17) 1.21 (1.03-1.41) 0.02 5-SNP SPNs(4-8-12-14-20) Others 2-2-1-1-1 4812/4847 188/153
0.50 1.01 1.05 1.11 (1.00-1.22) 1.24 (1.00-1.55) 0.05 6-SNP SPNs(5-8-9-14-20-23) Others 2-2-2-1-1-2 4912/4937 88/63
0.50 1.00 1.08 1.17 (1.00-1.33) 1.40 (1.00-1.97) 0.04 7-SNP SPNs(5-8-9-10-14-20-23) Others 2-2-2-1-1-1-2 4955/4972 45/28
0.50 1.00 1.12 1.24 (0.99-1.46)
1.61 (0.98-2.66)
0.05
*
The SNP combinations on the occurrence of breast cancer have significant (p-value < 0.05). Table II
ESTIMATED BEST SNP COMBINATIONS ON THE OCCURRENCE OF BREAST CANCER BY PSO Combined SNP number
(specific SNPs)
SNP Genotypes
Case number
/ Control number Correct
Sen. +
Spe. PPV+NPV Risk Ratio
Odds Ratio
(95%CI) p-value 2-SNP SNPs(4-12) others 2-1 3419/3526 1581/1474
0.51 1.02 1.02 1.05 (1.01-1.10) 1.11 (1.02-1.21) 0.02 3-SNP SPNs(12-13-19) others 1-2-2 4340/4389 660/611
0.51 1.01 1.02 1.04 (0.98-1.11) 1.09 (0.97-1.23) 0.14 4-SNP SPNs(6-12-17-20) Others 2-1-2-1 4583/4610 417/390
0.50 1.00 1.01 1.04 (0.96-1.11) 1.08 (0.93-1.25) 0.32 5-SNP SPNs(4-5-8-14-16) Others 2-2-2-1-1 4869/4892 131/108
0.50 1.00 1.04 1.10 (0.97-1.23) 1.22 (0.93-1.59) 0.13 6-SNP SPNs(3-6-8-10-14-16) Others 1-2-2-1-1-2 4924/4933 76/67
0.50 0.99 1.03 1.06 (0.89-1.23) 1.14 (0.81-1.60) 0.45 7-SNP SPNs(4-10-15-17-20-22-23) Others 2-1-2-2-1-1-2 4955/4959 45/41
0.50 0.99 1.02 1.05 (0.83-1.26)
1.10 (0.70-1.72)
0.67
*The SNP combinations on the occurrence of breast cancer have significant (p-value < 0.05).
Acknowledgment
This work is partly supported by the National Science Council in Taiwan under grants 101-2622-E-151-027-CC3, 100-2221-E-151-049-MY3, and 100-2221-E-151-051-MY2.
REFERENCES
[1] X. Li, H. Chen, J. Li, and Z. Zhang, "Gene function prediction with gene interaction networks: a context graph kernel approach," IEEE Transactions on Information Technology in Biomedicine, vol. 14, pp. 119-128, 2010.
[2] P. Kraft and C. A. Haiman, "GWAS identifies a common breast cancer risk allele among BRCA1 carriers," Nat Genet, vol. 42, pp. 819-20, 2010. [3] D. Fanale, V. Amodeo, L. R. Corsini, S. Rizzo, V.
Bazan, and A. Russo, "Breast cancer genome-wide association studies: there is strength in numbers," Oncogene, vol. 31, pp. 2121–2128, 2011.
[4] J. C. Yu, C. N. Hsiung, H. M. Hsu, B. Y. Bao, S. T. Chen, G. C. Hsu, W. C. Chou, L. Y. Hu, S. L. Ding, C. W. Cheng, P. E. Wu, and C. Y. Shen, "Genetic variation in the genome-wide predicted estrogen response element-related sequences is associated with breast cancer development," Breast Cancer Res, vol. 13, pp. R13, 2011.
[5] J. H. Moore, F. W. Asselbergs, and S. M. Williams, "Bioinformatics challenges for genome-wide association studies," Bioinformatics, vol. 26, pp. 445-455, 2010.
[6] C. H. Yang, L. Y. Chuang, Y. J. Chen, H. F. Tseng, and H. W. Chang, "Computational analysis of simulated SNP interactions between 26 growth factor-related genes in a breast cancer association study," OMICS, vol. 15, pp. 399-407, 2011. [7] P. Yang, J. W. Ho, Y. H. Yang, and B. B. Zhou,
"Gene-gene interaction filtering with ensemble of filters," BMC Bioinformatics, vol. 12, pp. S10, 2011.
[8] L. Y. Chuang, Y. D. Lin, H. W. Chang, and C. H. Yang, "An improved PSO algorithm for generating protective SNP barcodes in breast cancer," PLoS ONE, vol. 7, pp. e37018, 2012.
[9] L. Y. Chuang, H. W. Chang, M. C. Lin, and C. H. Yang, "Chaotic particle swarm optimization for detecting SNP-SNP interactions for CXCL12-related genes in breast cancer prevention," European Journal of Cancer Prevention, vol. 21, pp. 336-342, 2012.
[10] C. H. Yang, L. Y. Chuang, Y. H. Cheng, Y. D. Lin, C. L. Wang, C. H. Wen, and H. W. Chang, "Single nucleotide polymorphism barcoding to evaluate oral cancer risk using odds ratio-based genetic algorithms," Kaohsiung Journal of Medical Sciences, vol. 28, pp. 362-368, 2012.
[12] C. H. Yang, L. Y. Chuang, Y. J. Chen, H. F. Tseng, and H. W. Chang, "Computational Analysis of Simulated SNP Interactions Between 26 Growth Factor-Related Genes in a Breast Cancer Association Study," OMICS: A Journal of Integrative Biology, vol. 15, pp. 399-407, 2011. [13] P. D. P. Pharoah, J. Tyrer, A. M. Dunning, D. F.
Easton, B. A. J. Ponder, and S. Investigators, "Association between common variation in 120 candidate genes and breast cancer risk," PLoS Genetics, vol. 3, pp. 401-406, 2007.
[14] J. Kennedy and R. Eberhart, "Particle swarm optimization," IEEE International Joint Conference on Neural Network, pp. 1942-1948, 1995.