(Annals of the Brazilian Academy of Sciences)
Printed version ISSN 0001-3765 / Online version ISSN 1678-2690
www.scielo.br/aabc
http://dx.doi.org/10.1590/0001-3765201520140062
Correspondence to: Edson Wendland E-mail: [email protected]
Recharge contribution to the Guarani Aquifer System estimated from the water balance method in a representative watershed
EDSON WENDLAND1, LUIS H. GOMES2 and UWE TROEGER3 1Universidade de São Paulo, Departamento de Hidráulica e Saneamento,
Av. Trabalhador Sãocarlense, 400, 13566-590 São Carlos, SP, Brasil 2
Departamento de Água e Energia Elétrica – DAEE, Av. Otávio Pinto Cesar, 1400, 15085-360 São José do Rio Preto, SP, Brasil
3Ernst-Reuter-Platz 1, Technische Universität Berlin, Institut für Angewandte Geowissenschaften, Berlin, D-10587, Deutschland
Manuscript received on February 13, 2014; accepted for publication on September 5, 2014
ABSTRACT
The contribution of recharge to regional groundwater flow systems is essential information required
to establish sustainable water resources management. The objective of this work was to determine the
groundwater outflow in the Ribeirão da Onça Basin using a water balance model of the saturated soil zone. The basin is located in the outcrop region of the Guarani Aquifer System (GAS). The water balance method involved the determination of direct recharge values, groundwater storage variation and base flow. The direct recharge was determined by the water table fluctuation method (WTF). The base flow was calculated by the hydrograph separation method, which was generated by a rain-flow model supported by biweekly streamflow measurements in the control section. Undisturbed soil samples were collected at depths corresponding to the variation zone of the groundwater level to determine the specific yield of the soil (drainable porosity). Water balances were performed in the saturated zone for the hydrological years from February 2004 to January 2007. The direct recharge ranged from 14.0% to 38.0%, and groundwater outflow from 0.4% to 2.4% of the respective rainfall during the same period.
Key words: Groundwater, monitoring, recharge, specific yield, WTF.
INTRODUCTION
The increased water demand for domestic, industrial, and agricultural use associated with the rising deterioration of surface water has resulted in the need for having water that is available in large volumes,
of good quality, relatively inexpensive and available
over a long period of time. This situation has led to the increased use of groundwater. Therefore, the
596 EDSON WENDLAND, LUIS H. GOMES and UWE TROEGER
Water that moves downward from the surface below the root zone is termed as groundwater recharge, deep drainage or deep percolation. The
groundwater recharge is the most difficult component of the hydrological cycle to determine, and its estimates present a high degree of uncertainty. This
fact is due in part to the lack of a direct measurement
methodology and, subsequently, to the limited availability of existing information (Healy 2010).
Depending on the number of sources and processes,
recharge can be quantified by various methods (Lerner et al. 1990, Simmers 1989, Kinzelbach 2002). Each method has its own applicability and reliability limitations (Lerner et al. 1990, Beekman et al. 1996, De Vries and Simmers 2002, Healy and Cook 2002, Sanford 2002). Scanlon et al. (2002) presented a large variety of procedures for
estimation of groundwater recharge.
For management (Arnold et al. 2000, Hirata and Conicelli 2012) and economic reasons (Raudsepp-Hearne et al. 2010) it is important to
know how much water a recharge basin contributes
to the regional flow system. This information is important since generally the groundwater is
extracted in locations different from the recharge areas. Part of the groundwater recharge stored in
the aquifer is drained to the gaining streams as base flow, characterizing the local flow systems (Fetter 1994). On the other hand, part of the groundwater recharge may leave the basin through the bottom boundary, flowing to deeper confined aquifers. This portion of groundwater recharge will be defined as groundwater outflow to the regional flow system. The exploitation for public water supply in other region may be seen as a basin contribution to ecosystem services (Naeem et al. 1997).
In this work the groundwater recharge at an outcrop zone is determined, and the contribution
to the regional groundwater flow system of the Guarani Aquifer System (GAS), is evaluated. The GAS (Araújo et al. 1999, Sracek and Hirata 2002,
Wendland et al. 2007, Rabelo and Wendland 2009,
Gómez et al. 2010) is one of the most important transboundary aquifers in the world. Located in the territory of four countries, Argentina, Brazil, Paraguay and Uruguay, its area is estimated to 1.2
million km2 (Foster et al. 2004). Due to the strategic, social and economic importance of this aquifer for the four countries, it is necessary to determine the
recharge rate for management purposes. However,
there are few scientific studies in this area and many questions are still unanswered.
The basic hypothesis is that the groundwater recharge and outflow to the regional flow system
can be determined using the water balance method in the saturated zone of small basins with a dense
instrumentation network for hydrogeological studies.
This method avoids the uncertainties related to interception phenomena, evapotranspiration and soil moisture estimates. However, the procedure
requires intensive monitoring of water level
variation in the wells and a careful determination of
the specific yield (drainable porosity) of the basin soil (Maréchal et al. 2006, Tan et al. 2007). For the present study the specific yield was determined in laboratory tests using undisturbed soil samples
taken at various places and depths within the basin.
LOCATION AND DESCRIPTION OF THE BASIN
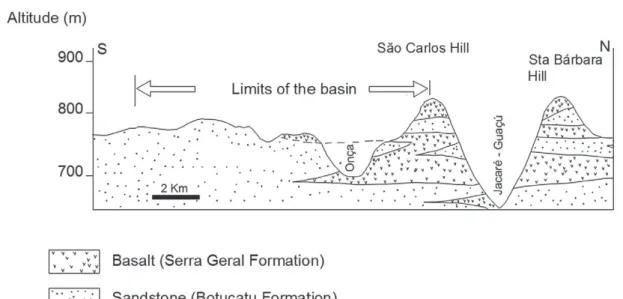
The Ribeirão da Onça basin is located in the Midwestern region of São Paulo, Brazil, in the city of
Brotas, between the latitudes 22°10' and 22°15' South
and the longitudes 47°55' and 48°00' West (Figure 1). Most of the basin is located over sandstone layers of the Botucatu Formation, corresponding to the Guarani Aquifer System outcrop. Downstream, close to the basin outlet, the Ribeirão da Onça creek flows
over diabase sills. Both units are part of the São Bento
Group from the Mesozoic Era (Araújo et al. 1999).
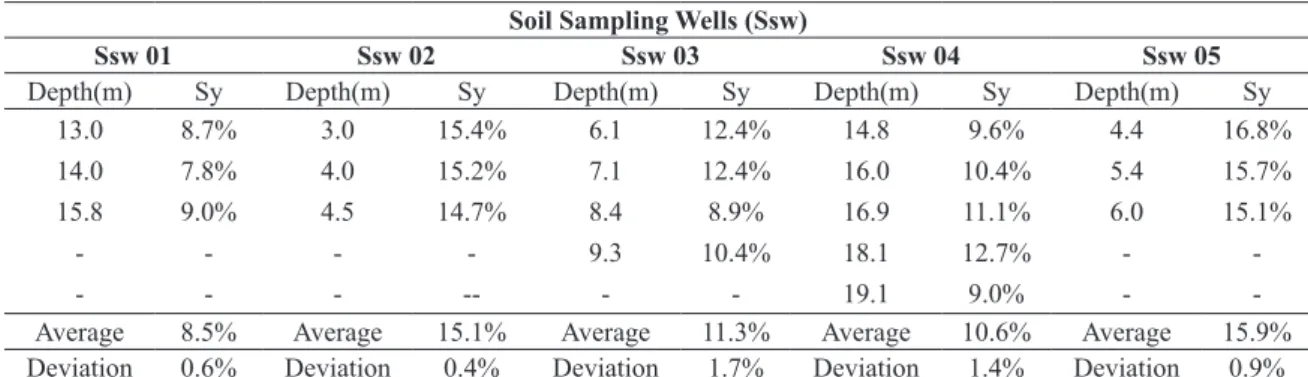
The geological section through the basin is shown in
Figure 2. The Ribeirão da Onçabasin is covered by
Cenozoic sediments found in most of the interior of the state of São Paulo. This soil presents a thickness
Figure 1 - Location of the Ribeirão da Onça basin (Manzione et al. 2012).
underlying layer by a line of pebbles (Bortolucci 1983). This sediment is not compacted and has fairly small particles, providing a very porous structure with two dominant textures: sandy (predominant in the basin) and clayey (near the basin’s outlet).
From the hydrogeological point of view
the Cenozoic sediments, with a thickness of tens of meters, correspond to the more active
part of the groundwater dynamics, presenting fast replenishment by direct recharge and high flow velocity to the drainage (Ribeirão da Onça creek). The underlying Guarani Aquifer System is a consolidated sandstone with lower hydraulic conductivity (order of 10-5 m/s). Vertical groundwater outflow from the Cenozoic sediments is accounted as the basin contribution to the regional flow system of the Guarani Aquifer System.
The mean annual temperature in the basin is 20.5°C based on values obtained from the
Climatic Station of CRHEA/EESC/USP (Center for Water Resources and Applied Ecology, Engineering School of São Carlos, University of São Paulo). The Koeppen climate classification
for the region indicates that the basin has a humid subtropical climate with a wet summer
and a dry winter. The regional average annual
precipitation is 1,500 mm. The characterization of precipitation occurrence in the Ribeirão da
Onça basin was initiated by Pompêo (1990),
who installed three pluviographs at different locations. The data series in the triennium 1985
to 1987 showed that the daily totals were very
similar among the three pluviographs, proving
598 EDSON WENDLAND, LUIS H. GOMES and UWE TROEGER
The Ribeirão da Onça basin is commonly
used for agricultural and livestock purposes; paved and industrial areas are not observed. The land
vegetation, which was originally cerrado (savanna),
now consists of pastures, sugar cane, orange, and
eucalyptus plantations, fl oodplain areas and crops such as soybeans and peanuts (Manzione et al. 2012).
MATERIALS AND METHODS
A technical device to directly measure the vertical groundwater outfl ow into a regional groundwater fl ow system is not available. Consequently, the groundwater outfl ow has to be determined indirectly
as a volumetric water balance in a control volume
during a defi ned period of time. In this study the control volume (Fig. 3) is assumed to be the saturated
zone of the Cenozoic sediments, with the upper limit
defi ned by the free water table and the lower limit defi ned by the interface to the sandstone sediments of the Guarani Aquifer. The water balance is given as
Rd = G0 + Qb + ΔS (1)
The input into the control volume is the direct
recharge (Rd). Outputs from the system are the base fl ow (Qb) and the groundwater outfl ow (Go). The
groundwater outfl ow refers to vertical water movement into a lower aquifer, which in this case is the Guarani Aquifer. The variation in stored volume (ΔS) is
obtained from the water level difference between the beginning and the end of the evaluation period. All
variables are expressed in terms of rates (e.g., mm/y).
This conceptual model does not consider water losses due to evaporation and evapotranspiration
from the free water table. Evaporation is likely to be insignifi cant since the groundwater level is more than 5.0 m below ground surface and capillarity Figure 2 - Geological section through the basin, in SN direction. Modifi ed from Contin Neto (1987).
Figure 3 - Conceptual model and control volume for the water
balance method (P = precipitation, Rd = direct recharge, Δs =
effects are insufficient to reach that height in a sandy soil. In the study area there are no wells exploiting groundwater. Upward flow from the
GAS is not expected since the watershed is located in a topographic high area. The major advantage of the water balance method is the fact that it depends
on easily available data (run off, water levels etc).
However, the main limitation is that the recharge evaluation depends on the precision of the other
components of the equation (Scanlon et al. 2002). The direct recharge (Rd) represents the amount
of water arriving at the water table from the surface. The direct recharge is calculated using the water
table fluctuation method (WTF) (Lerner et al. 1990, Scanlon et al. 2002). This method is based on
measurements of water table levels in monitoring wells for a predetermined time period and is estimated
as (Healy and Cook 2002, Scanlon et al. 2002)
Rd = Sy
dh
= SyΔh
dt Δt (2)
where Sy is the specific yield, h is the groundwater
level, and t is the time. The Δh variation is the difference between the peak of the upslope curve and the lowest point of the antecedent recession curve extrapolated to the time that the peak occurred
(Fig. 4). The extrapolated recession curve is the hydrographic trajectory of the monitoring well in the absence of any water level rise and represents the continued losses (Qb and Go) during the recharge period. Exponential equations are used for this extrapolation as is usually applied for surface water hydrographs (Singh and Stall 1971).
Figure 4 - Water level recession curve extrapolation. Δh is the rise due to the recharge in the observation period.
The underground storage variation (ΔS) in an unconfined aquifer during the monitoring period is
estimated as:
ΔS = Δhb · Sy (3)
where Δhb is the water table variation during the period of the water balance calculation.
For this study nine wells (05, 08, 13, 14, 15, 16, 17, 18 and 19) were used, as shown in Figure 5. These
wells are representative for the different land uses in the basin. Ignored wells are located outside the
basin or did not have continuous data for the study period. In dry years the water table fell below the
well bottom and the data series was not continuous,
invalidating any evaluation. These monitoring wells
are too shallow and should have been drilled deeper.
Both equation 2 and 3 depend on the specific yield (Sy), which corresponds to the drainable porosity of the medium. In order to increase the reliability
of the recharge estimates, undisturbed soil samples
were collected (Fig. 5) at depths that correspond to
the water table variation. The undisturbed samples
were analyzed using the Haines funnel technique (Haines 1930), in which the soil is submitted to a fixed water tension. The principles and equations upon which the equipment is based, are described by Libardi (1995). Three samples were tested for each location and depth (Gomes 2008). In addition to the specific yield, which is related to macroporosity, the total porosity was also determined weighing the
oven dried samples. Disturbed soil samples were used to determine particle size and to construct the granulometric curves to characterize the soil.
Base flow (Qb) was measured twice a month directly in the control section using a flowmeter (Model MLN-7, JCTM). The discharge was quantified using the midsection method (Turnipseed and Sauer 2010). A runoff model was also applied to the study area. The basin physical parameters required for the IPHS-1 code (Collischonn and Tucci 2001) were determined for a maximum flow
600 EDSON WENDLAND, LUIS H. GOMES and UWE TROEGER
observed at the control section according to studies
by Contin Neto (1987), Pompêo (1990), Arantes (2003) and Barreto (2005).
RESULTS
In this section meteorological data, water levels
in the monitored wells and base flow obtained in the Ribeirão da Onçabasin for the period between September 2004 and September 2007 are presented. Results of the collected undisturbed soil samples
and the values of the specific yield obtained in laboratory analyses are shown. Subsequently, the
direct recharge values and variation in storage are evaluated, both of which are dependent on the
specific yield. The evaluation is concluded with the groundwater outflow as a result of the water
balance in the saturated zone, separated into the
three hydrological years.
PRECIPITATION
The meteorological data were obtained from the
meteorological station located in CRHEA by
direct readings of a Ville de Paris rain gauge and
an automatic station. The historical annual rainfall
average (data collected between 1971 and 2007) was 1527 mm. During the present study period the lowest annual rainfall occurred in 2006 (1367 mm); this value is 11% lower than the historical average. In 2004, the rainfall was 1619 mm, or 6% above
average. In 2007, the rainfall of 1503 mm was
close to the historical average. The rainy periods correspond to the months from October to March, and the dry periods correspond to the months from
April to September.
VARIATIONS IN WATER LEVEL
Water table fluctuations were monitored for the hydrological years from September 2004 to
August 2005, September 2005 to August 2006 and September 2006 to August 2007.
The monitoring data indicated that rainfall
events during the period from November to March (with a peak in January) resulted in a rise in water levels in the wells, with maximum values generally in February. Therefore, we can consider that the
period of recharge corresponds to the months
from December to March. Starting in April, there is a decrease in the values of hydraulic head associated with the onset of the dry season for the year. Small rainfall amounts rarely cause
sensitive responses in levels, as can be seen during the period from April to August, when there is a
significant decrease in rainfall. The described
behavior occurs when the annual precipitation
value is near the average. In the hydrological year 2005/2006, the total precipitation was 11%
below the historical average, leading to little
change in the water table. For the rainy seasons
in 2004/2005 and 2006/2007, the water table
rise occurred between December and March,
with partial rainfalls of 1244 mm and 1323 mm,
respectively. In 2005/2006, there was a very subtle rise in the period between January and April due to a low rainfall of 1017 mm (18% lower than in 2004/2005 and 30% lower than in 2006/2007).
MAP OF HYDRAULIC HEADS
With water level information obtained from all 21 monitoring wells available in the basin, it was
possible to generate a map (Fig. 6) of hydraulic heads for the dry and rainy seasons in the basin in
which the wells are located. The dates chosen for
the map were February 15, 2005 with the higher
water levels in the wet season, and December 15,
2006 with the lowest values at the end of the dry
period. Although the number of monitoring wells is
limited, especially at the highest points of the basin,
the generated map appears reliable and enables
the comprehension of the flow system. Note that the hydraulic head curves for the two periods
almost coincide in the region near the stream and separate near the divide of the basin, and that the variations in water levels are higher in this region.
The potentiometric map shows the flow directions, indicating that the groundwater divide is very
close to the surface water divide in this basin and
demonstrates the influence of the surface drainage. Only one side of the watershed was monitored and
evaluated. Due to monitoring logistic (e.g., large distances to be traversed) the wells were installed on only one side of the basin. Since the land uses
on both sides of the watershed are similar, the monitored half is considered to be representative. All the evaluated values for the water balance are
normalized by the respective areas in order to get
consistent rates [mm/a].
SPECIFIC YIELD (SY)
The specific yield is approximately equal to the storage coefficient, which is generally less than the porosity of the medium. The soil samples, collected
at depths that correspond to the range of variations in the groundwater level, were used to determine
the specific yield. Disturbed samples were used to
characterize particle size. Rows of pebbles were
found during the collection of samples, confirming
the characteristics of Cenozoic sediments described
by Bortolucci (1983).
The average specific yield ranged from 8.5% to 15.9% according to the spatial distribution of the sampling points (see Fig. 4). It was verified
that this value increased as a function of depth
in some of the soil sampling wells (Ssw 02, 03 and 05). However, this behavior was not observed elsewhere (Ssw 01 and 04). Values of the specific yields of samples at various depths were condensed and are presented in Table I (Gomes 2008). The
collected samples presented an overall average
specific yield of 12.0% and a standard deviation of 2.9%, maintaining the spatial uncertainty of this parameter. In addition to the specific yield, which is related to macroporosity, the soil microporosity was also determined using an oven to dry the samples. Soil granulometry analysis
was performed for different collection points, and granulometric curves were plotted to characterize
602 EDSON WENDLAND, LUIS H. GOMES and UWE TROEGER
Figure 6 - Hydraulic head map of the basin for the days 02/15/2005 (wet season) and 12/15/2006 (dry season).
DIRECT RECHARGE
The direct recharge is equivalent to the amount of water
that percolated below the root zone and was calculated
using the water table fluctuation method (WTF) (Lerner et al. 1990, Scanlon et al. 2002). Figure 7 shows the
method applied to the water level variations in well 18,
located in a meadow in the Ribeirão da Onçabasin.
This well is 29 m deep with 4-inches casing. The well is screened between 21 m and 29 m depth. As shown in
Figure 7, the groundwater level varies approximately
between 10 m and 17 m below surface.
Water level fluctuations were evaluated for the hydrological years from September 2004 to August
Soil Sampling Wells (Ssw)
Ssw 01 Ssw 02 Ssw 03 Ssw 04 Ssw 05
Depth(m) Sy Depth(m) Sy Depth(m) Sy Depth(m) Sy Depth(m) Sy
13.0 8.7% 3.0 15.4% 6.1 12.4% 14.8 9.6% 4.4 16.8%
14.0 7.8% 4.0 15.2% 7.1 12.4% 16.0 10.4% 5.4 15.7%
15.8 9.0% 4.5 14.7% 8.4 8.9% 16.9 11.1% 6.0 15.1%
- - - - 9.3 10.4% 18.1 12.7% -
-- - - -- - - 19.1 9.0% -
-Average 8.5% Average 15.1% Average 11.3% Average 10.6% Average 15.9% Deviation 0.6% Deviation 0.4% Deviation 1.7% Deviation 1.4% Deviation 0.9%
Figure 7 - WTF method applied to the well 18 during the study period. TABLE I
Specific yield of samples collected at different points and depths (Gomes 2008).
2006 to August 2007. Table II shows the values of the direct recharge calculated at each monitoring well for
each hydrological year. The values ranged from 57 mm for well 15 in the 2005-2006 hydrologic year to 845 mm for well 18 in the 2006-2007 hydrologic year. Mean water depth was defined as the average value
of maximum and minimum water depth observed at
each hydrological year. Specific yield for each well
was determined according to the distance to the soil sampling wells and to the mean water depth.
In order to estimate an average recharge value for the whole basin, an area of influence
for each well was estimated. It was observed that the direct recharge evaluated for each well
is influenced by the mean water depth. Since
the mean water depth increases with growing distance perpendicular to the drainage axis, the distance to a creek was used to define the areas of influence. The influence areas, indicated in Table II, were used as weighing factors leading to a weighted average of the direct recharge in the basin. Direct recharge as a percentage of
604 EDSON WENDLAND, LUIS H. GOMES and UWE TROEGER
respectively. Barreto (2005) estimated the direct recharge as 29% of the total precipitation (1410 mm) during the period of his assessment (January to December, 2005) in the same basin.
CHANGE IN STORAGE
The change in underground storage in an unconfined aquifer drained by a watercourse is equal to the
change in water volume that occurs when the level
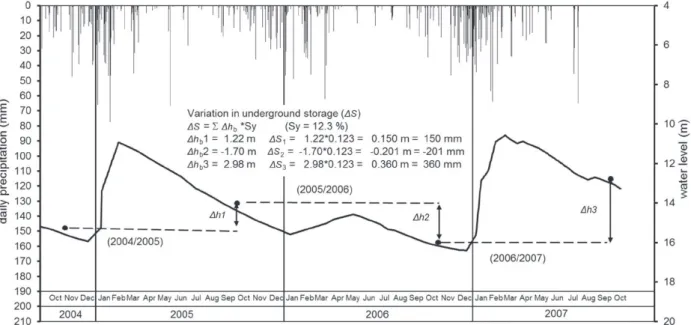
of the aquifer varies in relation to the previous level. Figure 8 shows the determination of the storage
variation specified for well 18. It is notable that
there was a sharp drop in the volume of water stored during the 2005/2006 season due to the lower rainfall
during this period. The rainfall amount decreased by 17% compared to the previous period, resulting in a significant reduction in aquifer storage (-130 mm).
However, during the 2006/2007 period, there was
an increase in rainfall (42% increase compared to the previous period), resulting in a recovery of the volume stored in the basin (176 mm). For the other
wells the behavior is similar.
2004 - 2005 2005 - 2006 2006 – 2007 Well
number
Well depth (m)
Mean water depth (m)
Specific yield (%)
Influence area (%)
Rainfall 1444 mm
Rainfall 1203 mm
Rainfall 1711 mm
16 22.0 5.2 15.1 10.5 293 79 482
5 50.0 6.6 15.9 10.5 319 180 524
14 6.6 8.5 10.5 298 122 311
15 7.9 8.5 6.8 242 57 202
13 9.8 8.5 6.8 320 101 324
17 26.0 11.0 12.3 6.8 464 167 579
TABLE II
Well details and direct recharge estimated for the hydrologic years between 2004 and 2007.
BASE FLOW
The base flow and surface outflow were estimated
using a series of rainfall totals in the basin
and a series of discharges. The base flow was determined from a rain-flow model applied to the study area (Gomes 2008). The parameters used for generating flows with the IPHS 1 software
(Collischonn and Tucci 2001) were determined so that the maximum flows were less than 2.5 m3/s.
The model was calibrated based on the discharges
measured twice a month, with a flowmeter in the control section. The maximum flow was calculated
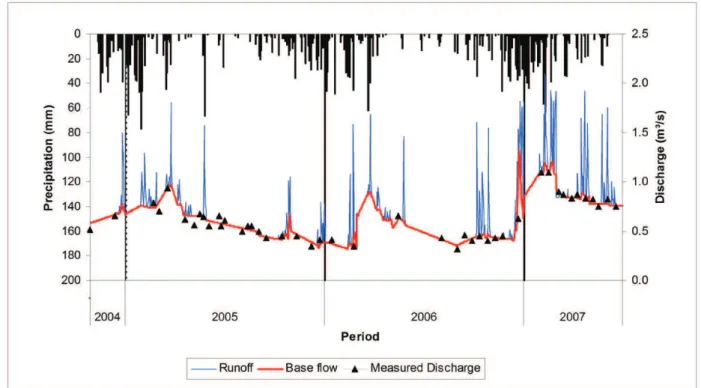
as 2.1 m3/s. The hydrographs of total and base
flows are shown in Figure 9.
Figure 9 - Hydrograph generated by the IPHS1 model in comparison to discharges measured at the control section.
The base flow presents a well-characterized seasonal behavior as it rises during the rainy season from October to March, shows depletion in
April, and reaches minimum values in September.
Base flow values closely mimic the rainfall value for the period, ranging between 24% and 26% of
the precipitation. This small variation shows the
constancy of the general conditions of the basin during this monitoring period. Surface flow (runoff) during rain events shows a variation of 1.2% to 3.3%
of the precipitation. These values are compatible
with 1.5% of the rainfall in the basin, as obtained by Contin Neto (1987). The low values result from sandy soils, flat relief and low runoff in the basin.
WATER BALANCE IN THE SATURATED ZONE
The water balance methodology assumed the
saturated soil region in the basin as the control
volume. Following the principle of continuity, the system input is represented by direct recharge
(Rd), whereas the system output is given by
the base flow (Qb) and groundwater outflow
(Go). The variation of the underground stored
volume (ΔS) is determined from the variation
of the level in the monitoring wells during the
hydrological year.
606 EDSON WENDLAND, LUIS H. GOMES and UWE TROEGER
groundwater divide coincident with the surface
water divide. The following equation represents
the water balance:
G0 = Rd − Qb − ΔS (3)
Table III shows the components of the water balance calculated for the three periods. During the 2004/2005 period, the amount of
the direct recharge was 461 mm, i.e., 32% of the total precipitation (1444 mm). These values are close to those found by Barreto (2005) in this basin. In that study, the author presented a direct recharge value of 29% of the precipitation. During 2005/2006, there was a 17% reduction in
rainfall compared to the previous period. In this
period, the recharge was 14% (164 mm) of the
1203 mm of rainfall. The rainfall amount during
the 2006/2007 hydrologic year was 1711 mm, the highest value in the study period. The direct recharge of 656 mm corresponded to 38% of
the 1711 mm of rainfall. In the 2004/2005 and 2006/2007 periods, the storage was positive,
with values of 66 mm and 176 mm, respectively. The storage was negative (-130 mm) during
the 2005/2006 season due to low precipitation.
The groundwater outflow ranged from 5 mm to 41 mm, equivalent to 0.4% to 2.4% of the total precipitation during the study period.
2004 - 2005 2005 - 2006 2006 – 2007
Precipitation (mm) 1444 1203 1711
Direct recharge (mm) 461 164 656
Base outflow (mm) 380 289 438
Storage (mm) 66 -130 176
GWater outflow (mm) 15 5 41
GWater outflow / Precipitation (%) 1.04 0.42 2.40
TABLE III
Average water balance in the basin for the hydrologic years between 2004 and 2007.
DISCUSSION
The objective of this study was to estimate the groundwater recharge in the Ribeirão da Onça basin
using the water balance method in the saturated zone
of soil, supported by hydrogeological monitoring data. Furthermore the outflow to the regional GAS was to be quantified. The following variables of the hydrological cycle were monitored and/or
determined: precipitation, groundwater level, total
and base level stream flow. Aquifer level data were
used to estimate direct recharge and changes in groundwater storage volumes.
The average specific yield (Sy) determined for the soil was 12.2%, with a standard deviation of 2.9%. The values determined in the laboratory
for undisturbed soil samples were shown to be
consistent with those in the literature (Healy and
Cook 2002), which range between 10% and 28% for the same textural class. Using the WTF method in the Ribeirão da Onçabasin, the direct recharge for the 2004 to 2007 period ranged between 164 mm
and 656 mm, i.e., 14% to 38% of the rainfall during
the respective periods. The variation in storage
was negative (-130 mm) during the hydrologic year (2005-2006) with less precipitation. This was a very dry period; the precipitation was below the long term average, resulting in a significant drainage of the aquifer. The base flow estimated by a hydrologic model was between 24% and 26% of the total precipitation in the Ribeirão da Onçabasin
during the study period. In previous studies, Barreto (2005) estimated the base flow to be 30% of the precipitation. Runoff ranged from 1.2% to 3.3% of
obtained from previous studies conducted in the
basin (Contin Neto 1987, Pompêo 1990, Barreto 2005). Using the water balance in the saturated zone, the groundwater outflow to the regional flow system during the period from 2004 to 2007 was estimated to be lower than 3.0% of the total
precipitation. The values show that the recharge
rates of the Guarani Aquifer System (GAS) are actually low in this region.
The obtained results indicate that the GAS
in the study area is filled with water. Despite high values of direct recharge (up to 656 mm/year in 2006/2007), this water cannot be stored in the GAS due to the absence of storage. Consequently, the
recharged water is removed from the recharge area in the form of surface drainage, reaching annual
base flow values between 289 and 438 mm/year.
The difference between the direct recharge and
base flow observed during the study period reflects mainly the variation in groundwater levels (storage variation) in Cenozoic sediments that overlie the aquifer. From the viewpoint of sustainable
exploitation, it is expected that, with increased
uptake through pumping wells, the aquifer storage created will be filled by recharge water, causing a reduction in the base flow.
The findings of this study are based on annual values of surface water flow that were calculated by a runoff model calibrated for the basin. This variable is the primary source of uncertainty in the water balance and should be measured continuously, reducing the uncertainty of the results. The estimated groundwater outflow through the lower boundary of the control volume
is in the range of measurement errors of the monitored variables. The obtained recharge values have to be seen as expected magnitudes and not
as exact numbers. The use of complementary techniques (e.g., hydrogeochemical, isotopic, temperature measurement) is necessary and should
be tested in the future. However, long term water
level monitoring is relatively less expensive and
has been preferred for economic reasons. The
continued monitoring of hydrological variables in the Ribeirão da Onçabasin is of great importance for future studies. Such studies should provide more precise data aiming at a better understanding
of the mechanisms governing the Guarani Aquifer System behavior in its outcrop areas.
ACKNOWLEDGMENTS
The authors acknowledge the Coordenação de Aperfeiçoamento de Pessoal de Nível Superior (CAPES) support for the scholarship and the Conselho Nacional de Desenvolvimento Científico e Tecnológico (CNPq) for financial support for the project. We very much appreciated the valuable suggestions by the reviewers. The comments certainly contributed towards improving the quality
of the paper.
RESUMO
A contribuição da recarga para sistemas regionais de fluxo de água subterrânea é uma informação essencial requerida para estabelecer o gerenciamento sustentável de recursos hídricos. O objetivo deste trabalho foi determinar o escoamento de água subterrânea na Bacia do Ribeirão da Onça usando um modelo de balanço hídrico
da zona saturada do subsolo. A bacia está localizada
em uma área de afloramento do Sistema Aquífero Guarani (SAG). O método do balanço hídrico envolveu a determinação de valores de recarga direta, variação do armazenamento de água subterrânea e escoamento
de base. A recarga direta foi determinada pelo método
de flutuação da superfície livre (WTF, em inglês).
O escoamento de base foi calculado pelo método de
separação da hidrógrafa, que foi gerada por um modelo chuva-vazão, com suporte de medições quinzenais de vazão na seção de controle. Amostras indeformadas de
solo foram coletadas em profundidades correspondentes
à zona de flutuação do nível freático, para determinação do rendimento específico do solo (porosidade drenável). Os balanços hídricos na zona saturada foram calculados
608 EDSON WENDLAND, LUIS H. GOMES and UWE TROEGER
de 2007. A recarga direta variou de 14,0% a 38,0% e o escoamento subterrâneo de água variou de 0,4% a 2,4% da respectiva precipitação durante o mesmo período.
Palavras-chave: Água subterrânea, monitoramento, recarga, rendimento específico, WTF.
REFERENCES
ARANTES EJ. 2003. Emprego de Infiltrômetros na
Carac-terização da Interação Rio e Aqüífero. Dissertação (Mestrado). Escola de Engenharia de São Carlos, Universidade de São Paulo, São Carlos. (Unpublished).
ARAÚJO LM, FRANÇA AB AND POTTER PE. 1999. Hydrogeology
of the Mercosul aquifer system in the Paraná and
Chaco-Paraná basins, South America, and comparison with the
Navajo-Nugget aquifer system, USA. Hydrogeol J 7(3):
313-336.
ARNOLD JG, MUTTIAH RS, SRINIVASAN R AND ALLEN PM.
2000. Regional estimation of base flow and groundwater
recharge in the Upper Mississippi river basin. J Hydrol 227(1-4): 21-40.
BARRETO CEAG. 2005. Balanço hídrico em zona de
afloramento do Sistema Aqüífero Guarani a partir de monitoramento hidrogeológico. Dissertação (Mestrado).
Escola de Engenharia de São Carlos, Universidade de São
Paulo, São Carlos. (Unpublished).
BEEKMAN HE, GIESKE A AND SELAOLO ET. 1996. GRES: Groundwater Recharge Studies in Botswana 1987-1996. Botswana J Earth Sci III: 1-17.
BORTOLUCCI AA. 1983. Caracterização Geológico-Geotécnica
da região urbana de São Carlos-SP, a partir de sondagens
de simples reconhecimento. Dissertação (Mestrado).
Escola de Engenharia de São Carlos, Universidade de São
Paulo, São Carlos. (Unpublished).
COLLISCHONN W AND TUCCI CEM. 2001. Simulação
hidroló-gica de grandes bacias. Rev Bras Rec Híd 6(2): 95-118.
CONTIN NETO D. 1987. Balanço Hídrico em Bacia Hidrográfica
situada em Região de Recarga do Aqüífero Botucatu.
Tese de Doutorado. Escola de Engenharia de São Carlos, Universidade de São Paulo, São Carlos.
DE VRIES JJ AND SIMMERS I. 2002. Groundwater recharge: an
overview of processes and challenges. Hydrogeol J 10:
5-17.
DEWANDEL B, PERRIN J, AHMED S, AULONG S, HRKAL Z,
LACHASSAGNE P, SAMAD M AND MASSUEL S. 2010.
Development of a tool for managing groundwater resources in semi-arid hard rock regions: application to a rural
watershed in South India. Hydrol Process 24: 2784-2797. FETTER CW. 1994. Applied Hydrogeology, Prentice-Hall,
EUA, 598 p.
FOSTER S, KEMPER K AND GARDUNO H. 2004. Brazil,
Paraguay, Uruguay, Argentina: the Guarani aquifer initiative for transboundary groundwater management. GW MATE case profile collection; no. 9. Washington,
DC: World Bank.
GOMES LH. 2008. Determinação da recarga profunda na
bacia-piloto do Ribeirão da Onça em zona de afloramento do Sistema Aqüífero Guarani a partir de balanço hídrico em zona saturada. Dissertação de Mestrado - Escola de
Engenharia de São Carlos, Universidade de São Paulo,
São Carlos. (Unpublished).
GÓMEZ A, RODRÍGUEZ L AND VIVES L. 2010. The Guarani
Aquifer System: estimation of recharge along the Uruguay–Brazil border. Hydrogeol J 18(7): 1667-1684.
HAINES WB. 1930. Studies in the physical properties of soil:
V. The hysteresis effect in capillary properties, and the
modes of moisture distribution associated therewith. J Agric Sci 20: 97-116.
HEALY RW. 2010. Estimating groundwater recharge, Cam-bridge Univ. Press, 245 p.
HEALY RW AND COOK PG. 2002. Using groundwater levels to
estimate recharge. Hydrogeol J 10: 91-109.
HIRATA R AND CONICELLI BP. 2012. Groundwater resources
in Brazil: a review of possible impacts caused by climate
change. An Acad Bras Cienc 84: 297-312.
HUGMAN R, STIGTER TY, MONTEIRO JP AND NUNES L.
2012. Influence of aquifer properties and the spatial and
temporal distribution of recharge and abstraction on
sustainable yields in semi-arid regions. Hydrol Process
26: 2791-2801.
KINZELBACH W (ORG). 2002. A Survey of Methods for
Groundwater Recharge in Arid and Semi-Arid Regions.
Early Warning and Assessment Report Series, UNEP/ DEWA/RS.02/2. United Nations Environment Programme, Nairobe, Kenia.
LERNER DN, ISSAR AS AND SIMMERS I. 1990. Groundwater recharge: a guide to understanding and estimating natural
recharge. International Contributions to Hydrogeology, Vol. 8. Int. Association of Hydrogeologists, Verlag Heinz Heise. LIBARDI PL. 1995. Dinâmica da água no solo. 2a ed., Piracicaba,
SP, 497 p.
MANZIONE RL, WENDLAND E AND TANIKAWA DH. 2012.
Stochastic simulation of time-series models combined with geostatistics to predict water-table scenarios in a
Guarani Aquifer System outcrop area, Brazil. Hydrogeol J 20(7): 1239-1249.
MARÉCHAL JC, DEWANDEL B, AHMED S, GALEAZZI L AND
ZAIDI FK. 2006. Combined estimation of specific yield
and natural recharge in a semi-arid groundwater basin
with irrigated agriculture. J Hydrol 329(1-2): 281-293. MOON SK, WOO NC AND LEE KS. 2004. Statistical analysis
of hydrographs and water-table fluctuation to estimate groundwater recharge. J Hydrol 292(1-4): 198-209. NAEEM S, O’NEILL RV, PARUELO J, RASKIN RG, SUTTON P
AND VAN DEN BELT M. 1997. The value of the world’s
ecosystem services and natural capital. Nature 387(6630):
253-260.
POMPÊO CA. 1990. Balanço Hídrico da Zona Não-Saturada
do Solo na Bacia do Ribeirão do Onça (SP). Tese
RABELO JL AND WENDLAND E. 2009. Assessment of
groundwater recharge and water fluxes of the Guarani Aquifer System, Brazil. Hydrogeol J 17: 1733-1748.
RAUDSEPP-HEARNE C, PETERSON GD AND BENNETT EM. 2010.
Ecosystem service bundles for analyzing tradeoffs in diverse landscapes. Proceedings of the National Academy of Sciences of the United States of America 107(11):
5242-5247.
SANFORD W. 2002. Recharge and groundwater: an overview.
Hydrogeol J 10: 110-120.
SCANLON BR, HEALY RW AND COOK PG. 2002. Choosing
appropriate techniques for quantifying groundwater recharge. Hydrogeol J 10: 18-39.
SCANLON BR, KEESE KE, FLINT AL, FLINT LE, GAYE CB,
EDMUNDS WM AND SIMMERS I. 2006. Global synthesis
of groundwater recharge in semiarid and arid regions.
Hydrol Process 20: 3335-3370.
SIMMERS I. 1989. Natural groundwater recharge estimation in
semiarid zones: some state-of-art observations. Proceedings
of the Sahel Forum, the State-of-Art of Hydrology and Hydrogeology in the Arid and Semi-Arid Areas of Africa, Ouagadougou, Burkina Faso, February, p. 374-386.
SINGH KP AND STALL JB. 1971. Derivation of Base Flow
Recession Curves and Parameters. Water Resour Res 7(2):
292-303.
SMERDON BD, ALLEN DM AND NEILSEN D. 2010. Evaluating the use of a gridded climate surface for modelling
groundwater recharge in a semi-arid region (Okanagan Basin, Canada). Hydrol Process 24: 3087-3100.
SRACEK O AND HIRATA R. 2002. Geochemical and stable
isotopic evolution of the Guarani Aquifer System in the state of São Paulo, Brazil. Hydrogeol J 10(6): 643-655.
TAN SBK, SHUY EB AND CHUA LHC. 2007. Effects of
meteorological and hydrogeological factors on gross recharge percentage at unconfined sandy aquifers with an equatorial climate. Hydrol Process 21: 2493-2503.
TURNIPSEED DP AND SAUER VB. 2010. Discharge
measu-rements at gaging stations: U.S. Geological Survey, Techniques and Methods book 3, chap. A8, 87 p.
WENDLAND E, BARRETO CEAG AND GOMES LH. 2007. Water