ISSN 0975-928X
Research Note
Genetic variability and association studies in maize (
Zea mays
L.) for green
fodder yield and quality traits
Rahul Kapoor and Chinka Batra
Department of Plant Breeding and Genetics
Punjab Agricultural University, Ludhiana-141 004, India E mail Id: [email protected]
(Received: 23 July 2014; Accepted:24 Nov 2014)
Abstract
Twelve maize (Zea mays L.) genotypes were evaluated for character association study during Kharif 2013 at Forage Research Farm, Punjab Agricultural University, Ludhiana. The genotypes were analysed for genetic variability, correlation and path coefficients. The genotypes were significantly different for all the characters, which indicated scope for further genetic studies. High heritability along with high genetic advance was recorded for plant height, leaf length, leaf width, stem girth, number of leaves, crude protein, acid detergent fibre, dry matter yield and green fodder yield indicating the predominance of additive effects in the inheritance of these characters. The phenotypic coefficients of variation (PCV) estimates were invariably higher than their corresponding genotypic coefficient of variation (GCV) values thereby suggesting the environmental influence. High estimates of GCV and PCV were observed for plant height, leaf length, stem girth, number of cobs, number of seeds, dry matter yield and green fodder yield, suggesting that selection based on these characters would facilitate successful isolation of desirable types. Traits like plant height, leaf length, leaf width, stem girth, number of leaves per plant and dry matter yield had positive and significant correlation at genotypic as well as phenotypic level with green fodder yield and the selection based on these traits will result in improving the green fodder yield in maize. Most of the yield contributing traits like plant height, leaf width, stem girth and dry matter yield as well as the quality trait neutral detergent fibre exhibited positive direct effect on green fodder yield..
Keywords
Maize, variability, green fodder yield, heritability
Maize (Zea mays L.) is a member of the family Graminae (Poaceae), generally recognized as the grass family. It is an important cereal which is used as human food, animal feed and a raw material for various agro-based industries throughout the world. Maize (Zeamays L.) ranks third in production after wheat and rice worldwide (Lyon, 2000). The grain is extremely nourishing, with roughly 70-72% consumable carbohydrates, 4 - 4.5% fats and oils and 9.5-11% proteins (Larger and Hill 1991). Globally, almost 66% of all maize is used to provide feed for domestic animals, 25% for human consumption and 9% for manufacturing purposes. In the undeveloped and developing nations nearly 50% of the entire maize produced is devoted to human consumption whereas 43% is devoted to domestic animals as feed and the remnants used for manufacturing purposes (IITA 2000). Compared with a majority of other cereal crops, maize is proficient in taking advantage of sunlight and using it better to grow more quickly because of the size and distribution of its foliage (Warman, 2003). Because of the outsized leaf area, it has high productivity (Salvador 1997). The role of maize in individual diet, feed for domestic animals and as unprocessed material for some industries has risen since the last three decades of the 20th century (Badu-Apraku et al., 2006). The leaves, stalks, and tassels serve as feed for domestic animals, either in the form of fodder or as stover. In some instances,
the roots can be utilized for mulching, incorporated into the soil to improve the physical composition, or dried and burned as firewood (Morris 2002). In addition, maize is as well an essential ingredient of poultry and livestock feed for industries and thus the demand for maize is significantly rising due to these industries. Many environmental factors, management systems, and genetic factors influence the yield and quality of forage maize (Cox et al 1994; Cusicanqui and Lauer 1999). Forage maize growers are usually advised to plant genotypes with high grain yields because high grain content increases the palatability, energy level, and digestibility of forage maize (Woody et al., 1983; Wolf et al., 1993).
ISSN 0975-928X
cultivars under given environmental conditions (Shahbaz et al., 2007)
To reach this goal, the basic requirements are to have adequate information on the extent of variability, heritability, expected genetic gain and degree of genetic association among the different characters. Burton and Devane (1953) suggested that genotypic coefficient of variation (GCV) together with heritability estimates would give reliable indication about the expected improvement of a trait under consideration. However, McGinnis and Shebeski (1968) have reported the importance of using selection strategies, chiefly for quantitative traits, in highly segregating populations. Intensifying artificial selection for low heritability traits of difficult gene action, estimation must be practised in advanced generations with reduced frequency of heterozygosity (Allard 1999). The indirect selection through less complex traits with larger heritability, however, results in larger genetic progress when compared to direct selection. Considerable significance has been devoted to studies involving correlation of traits in breeding programs. The measurement and interpretation of these correlations can result in mistakes on selection strategies (Cruz and Regzzi, 1997), since a high correlation can be the result of a third trait or a group of traits affecting these traits. In this scenario, the technique of path analysis has been extensively exploited by many plant breeders to assist in identifying traits that are useful as selection criteria to improve the seed yield of the crop (Dewey and Lu 1959, Miligan et al., 1990). Path coefficients have been used to develop selection criteria for complex traits in several crop species.
This technique is beneficial in determining the direct influence of one variable on another, and also separates the correlation coefficient into its components (Dewey and Lu, 1959; Rodríguez et al., 2001). An attempt was, therefore, made to estimate the extent of variability for different seed yield contributing traits, magnitude and direction of association among different characters both at genotypic and phenotypic levels. In view of this, the present investigation was carried out with the objective of assessing the nature and magnitude of genetic variability prevalent among the genotypes tested along with the nature of characters association amongst the various yield contributing traits and quality parameters.
The experiment was conducted during Kharif 2013 at Forage Research Farm, Punjab Agricultural University, Ludhiana with twelve maize genotypes that included the best available commercial genotypes from the private sector viz; Pioneer 31Y45, DKC 9108 and PAU bred genotypes PMH
1, PMH 3 along with the two national checks J 1006 and African Tall. The material was grown in randomized complete block design (RBD), where each entry was accommodated in 4 x 4.8 sq. m. plot size containing 8 rows of 4 m length with inter row spacing of 60 cm with three replications. Recommended package of practices to raise a good crop were followed. Observations were recorded on five competitive and healthy plants selected randomly from each entry on nine quantitative variables viz; plant height, leaf length, leaf width, number of leaves/plant, stem girth, number of cobs/plant, number of seeds/cob, dry matter yield, green fodder yield and four quality parameters viz; crude protein, In- vitro dry matter digestibility, Acid detergent fibre and Neutral detergent fibre. The data were analysed for variability, divergence, correlation and path coefficient study. Genotypic and phenotypic coefficients of correlation were calculated from genotypic and phenotypic co-variances and co-variances as described by Singh and Chaudhry (1977) and Johnson et al. (1955). Direct and indirect effects were calculated by the path coefficient analysis as suggested by Dewey and Lu (1959) at both phenotypic and genotypic levels. Genotypic and phenotypic coefficients were calculated using the formulae as used by Burton and De Vane (1953) and Johnson et al. (1955). Heritability in broad sense was estimated as suggested by Burton (1952). The expected genetic advance at 5% selection intensity was calculated by the formula as used by Johnson et al. (1955).
ISSN 0975-928X
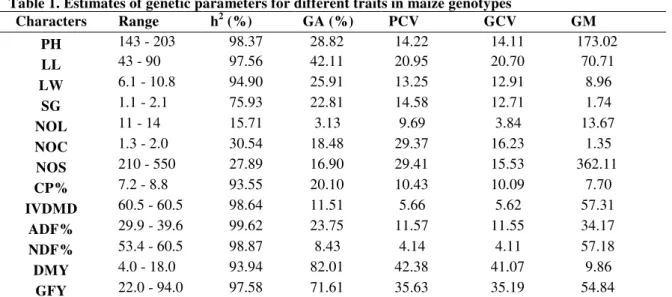
quality parameters evaluated had low GCV values indicating little scope for improvement in these traits in the material studied.
High h2 along with high GA was recorded for plant height, leaf length, leaf width, stem girth, crude protein, acid detergent fibre, dry matter yield and green fodder yield. Heritability along with phenotypic variance and the severity of selection provide estimableness of genetic advance or responding to the selection which is very useful in the selection of promising lines (Johnson et al., 1955; Roham et al., 2003). Number of leaves had lowest h2 (15.71) followed by number of seeds/cob (27.89), thus, are difficult to be improved by phenotype guided selection. Traits like in-vitro dry matter digestibility, neutral detergent fibre had high h2 but low values of GA suggesting that selection may not be rewarding. Traits like leaf length, stem girth, dry matter yield and green fodder yield exhibited high h2 coupled with high PCV suggesting greater scope for selection of these traits on phenotypic basis.
Genotypic and phenotypic correlation coefficientsFodder yield is a complex character controlled by several components which reflect positive and negative effects on this trait. It is important to note that whenever two traits are correlated, selecting for one would ensure selection for the other trait, therefore selecting for the best of the traits that correlated with yield in this study would result in increased yields. Association between grain yield and plant height, ear height, days to 50% silking, days to 50% tasseling, cob diameter, cob length, was also reported by Annapurna et al. (1998), Manivannan (1998) and Burak and Magoja (1991).
Thus, for achieving rational improvement in fodder yield and its components, knowledge of mechanism of association, cause and effect relationship provides a basis for formulating suitable selection methods for the yield components.
Results indicated that many yield contributing traits viz; plant height, leaf length, leaf width, NOL, in-vitro dry matter digestibility and dry matter yield had positive and significant correlation at genotypic as well as phenotypic level with green fodder yield (Table 2) and the selection based on these traits will result in improving the green fodder yield in maize. Kara et al. (1999) reported that the green forage yield in maize was positively correlated with stem diameter, ear diameter, and ear weight. On the contrary, number of cobs/plant, number of seeds/cob and acid detergent fibre exhibited a negative and significant correlation with green fodder yield and dry matter yield as well, whereas rest of the traits under study did not
exhibit significant correlation (positive or negative) with green fodder yield. Traits like plant height, leaf length, leaf width, stem girth and number of leaves/plant showed positive and highly significant correlation amongst each other but exhibited negative and highly significant correlation with quality parameter viz; acid detergent fibre which was also highly negatively correlated with other quality traits like crude protein and in-vitro dry matter digestibility . Highest value of positive and significant correlation was observed between green fodder yield and dry matter yield (0.9908, 0.9824) closely followed by crude protein and in-vitro dry matter digestibility (0.8925, 0.8444) whereas acid detergent fibre and in-vitro dry matter digestibility (-0.9197, -0.9124) exhibited highest value of negative and significant correlation.
Amongst the four quality parameters under study i.e. crude protein, acid detergent fibre, neutral detergent fibre and in-vitro dry matter digestibility only the last one exhibited positive and significant correlation with dry matter yield and green fodder yield whereas the other two traits viz; acid detergent fibre and neutral detergent fibre exhibited negative and significant correlation with dry matter yield and green fodder yield. Only crude protein – in-vitro dry matter digestibility and acid detergent fibre – neutral detergent fibre exhibited positive and significant correlation amongst them and rest all other quality traits combinations showed negative and significant correlation amongst each other. There are no published reports on association study between forage quality traits and other fodder yield contributing traits in maize, therefore, our study, for the first time, shed the light on association behaviour between forage quality and other fodder yield contributing traits.
ISSN 0975-928X
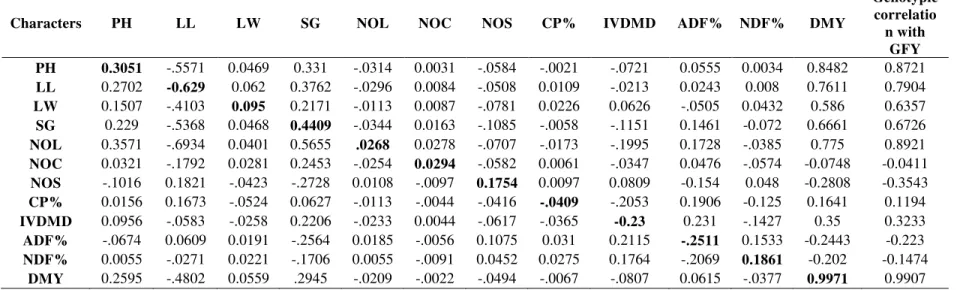
The positive indirect effects were contributed through most of the traits except leaf length, and all the quality traits (Table 3). Icoz and Kara (2009) reported that ear weight, leaf number, and stem diameter had the greatest direct effects on plant weight at the lowest and the highest plant densities. Positive and significant genotypic correlation values of traits viz; plant height (0.8720), leaf width (0.6362), stem girth (0.6726), number of leaves/plant (0.8920) and dry matter yield (0.9908) with green fodder yield and their positive direct effect values on green fodder yield i.e., 0.3051, 0.095, 0.4409, and 0.9971 respectively, indicated a true picture of association between these traits. Schmid et al. (1976), Hunter (1986), and Iptas and Yavuz (2008) have reported that plant height and stem diameter are not related to dry matter yield. However, Gallais et al. (1976) demonstrated that plant height and stem diameter are related to dry matter yield.
Selection for taller plants with more number of broader and longer leaves with thicker stem will be significant for the improvement of green fodder yield in the material under study. At the same time progress in breeding for enhanced green fodder yield may be adversely affected by selection for traits like number of cobs/plant, number of seeds/cob and acid detergent fibre due to a strong negative association of these traits with green fodder yield.
References
Allard R. W. 1999. Principles of plant breeding (3rd Ed), John Wiley, New York, pp 485.
Annapurna D., Khan H. A., and Mohammad S. 1998. Genotypic–phenotypic correlations and path coefficient analysis between seed yield and other associated characters in tall genotypes of maize. Crop Res., 16: 205-209.
Badu-Apraku B., Twumasi-Afriyie S., Sallah P.Y.K., Asiedu E.A., Marfo K.A., Dapaah S. and Dzah B.D. 2006. Registration of obatanpa GH maize. Crop Sci., 46 (3): 1393-1396.
Burak R. and Magoja J.L. 1991. Yield and yield components of full–sib and half–sib families derived from a perennial teosinte introgression population. Maize Genetics Corporation Newslr., 64: 67–76.
Burton G. N. 1952. Quantitative inheritance in grasses. In: Proceedings of 6th International GrassCongress, Pennsylvania,pp 277-283. Burton G.W. and De Vane E.H. 1953. Estimating genetic
variability in tall fescue (Festuca arundinacea) from replicated clonal material. Agron. J., 45: 478-481.
Cox W. J., Cherney J. H., Cherney J. R. and Pardee W. D. 1994. Forage quality and harvest index of corn genotypes under different growing conditions. Agron. J 86:277-282.
Cruz C. D. and Regazzi A. J. 1997. Biometric Models Applied to Breeding. Imprensa Universitária, Viçosa, pp 390.
Cusicanqui J. A. and Lauer J. G.1999. Plant density and hybrid influence on corn forage yield and quality. Agron. J., 91:911-915.
Dewey D. R. and Lu K. H. 1959. A correlation and path analysis of components of created wheat grass seed production. Agron. J., 51: 515-518. Gallais, A., Pollacsek M. and Huguet L. 1976.
Possibilities de selection du mais en tant que plante fourragere. Annales d’Amelioration ds Plantes , 26:591-605.
Hunter R. B. 1986. Selection genotypes for silage maize production, 140-146 pp. In: A Canadian experience. Dolstra, O. and P. Miedema (Eds.). Breeding of silage maize. Proc. 13th congress on the maize and sorghum section of Eucarpia, Wageningen, The Netherlands, 9-12 Sept. 1985, Pudoc, Wageningen, The Netherlands. Icoz M. and Kara S. M. 2009. Effect of plant density on
yield and yield component relationships in silage corn. VIII. Field Crops Congress in Turkey.
IITA. 2000. Research guide 30, IITA Training Program PMB 5320, Ibadan, Nigeria 43
Iptas S. and Yavuz M. 2008. Effect of pollination levels on yield and quality of maize grown for silage. Turk. J. Agric. For, 32:41-48.
Johnson H. W., Robinson H. F. and Comstock R. E. 1955. Estimates of genetic and environment variability in soybean. Agron. J., 46, 314-318. Kara S. M., Deveci M., Dede O. and Sekeroglu N. 1999.
The effects of different plant densities and nitrogen levels on forage yield and some attributes in silage corn. III. Field Crops Congress in Turkey, Adana III: 172-177. Kumar Srivas S. and Singh U.P. 2004. Genetic
variability, character association and path analysis of yield and its component traits in forage maize (Zea mays L.). Range Mgmt.and Agroforesty, 25(2): 149-153.
Larger R.H.M. and Hill, G.D. 1991. Agricultural Plants, Second Edition, Cambridge University Press, New York, USA. 387
Lyon F. 2000. Science Direct- World Development: II. Trust, Networks and Norms: The creation of social capital in agricultural economies in Ghana. J.Stored Product Res., 28(4) 663-681. Elsevier Science Ltd., England
Manivannan N.A. 1998. Character association and components analysis in maize. Madras J. Agric., 85:293-294.
Milligan S.B., Gravois K.A., Bischoff K.P., Martin FA. 1990. Crop effects on genetic relationships among sugarcane traits. Crop Sci., 30: 927–931 McGinnis R.G., Shebeski L.H. 1968 The reliability of single plant selection for yield in F2. In: International Symposium on Wheat Genetics, Canberra, Australia, pp 410-415.
Morris M.L. 2002. Impacts of international maize breeding research in developing countries, 1966-98. Mexico, D.F.: CIMMYT
ISSN 0975-928X
population of guayule Plants. Ind Crops Prod, 14, 93- 103.
Roham M.M., Igbal A.S.M., Arifin M.S., Akhtar Z., Husanuzzaman M. 2003. Genetic variability, correlation and path analysis in mungbean, Asian J.Plant Sci., 2, 1209-1211.
Salvador R. J. 1997 Maize. In: The encyclopedia of culture and society of Mexico. Fitzrov Dearborn Publishers.
Schmid, A.R., Goodrich R.D., Jordan R.M., Marten G.C. and Meiske J.C. 1976. Relationships among agronomic characteristics of corn and sorghum cultivars and silage quality. Agron. J., 68:403-405.
Shahbaz Akhtar, Oki M. Y. and Adachi T. 2007. Path and correlation analyses of the factors affecting biomass production of brassica cultivars under phosphorus-deficiency stress environment. Comm Soil Sci Plant Anal, 38:2659-2679. Singh R. K. and Chaudhary B. D. 1977. Biometrical
Methods in Quantitative Genetics Analysis, Kalyani Publishers, Ludhiana, pp 288.
Singh R. V., Saini D. D., Singh N. P., Chaudhary S. P. S. and Singh J. 2005b. Correlation and path analysis for seed yield in cluster bean under four rainfed regimes. J Arid Legumes, 2(1): 111–5
Warman A. 2003. Corn and capitalism: How a botanical bastard grew to global dominance. The University of North Carolina Press. (Gramene Reference ID 9397)
Wolf D. P., Coors J. G., Albrecht K. A., Undersander D. J. and Carter P. R. 1993. Agronomic evaluations of maize genotypes selected for extreme fiber concentrations. Crop Sci., 33:1359-1365.
ISSN 0975-928X
Table 1. Estimates of genetic parameters for different traits in maize genotypes
Characters Range h2 (%) GA (%) PCV GCV GM PH 143 - 203 98.37 28.82 14.22 14.11 173.02 LL 43 - 90 97.56 42.11 20.95 20.70 70.71 LW 6.1 - 10.8 94.90 25.91 13.25 12.91 8.96
SG 1.1 - 2.1 75.93 22.81 14.58 12.71 1.74
NOL 11 - 14 15.71 3.13 9.69 3.84 13.67
NOC 1.3 - 2.0 30.54 18.48 29.37 16.23 1.35 NOS 210 - 550 27.89 16.90 29.41 15.53 362.11 CP% 7.2 - 8.8 93.55 20.10 10.43 10.09 7.70 IVDMD 60.5 - 60.5 98.64 11.51 5.66 5.62 57.31
ADF% 29.9 - 39.6 99.62 23.75 11.57 11.55 34.17 NDF% 53.4 - 60.5 98.87 8.43 4.14 4.11 57.18 DMY 4.0 - 18.0 93.94 82.01 42.38 41.07 9.86
GFY 22.0 - 94.0 97.58 71.61 35.63 35.19 54.84
ISSN 0975-928X
Table 2.
Genotypic and phenotypic correlation coefficients among various traits of maize genotypes
Characters PH LL LW SG NOL NOC NOS CP% IVDMD ADF% NDF% DMY
LL G .8857**
P .8680**
LW G .4941** .6523** P 4787**
.6316**
SG G 7507** .8533** .4923** P .6445**
.7297** 3918**
NOL G .5704** .5024** .4217** .6826** P .5069**
.4804** .1794* .4882**
NOC G .1054 .2849** .2962** .5562** .3447** P .1035 .1617*
.1756* .2746** .1587
NOS G -.3331** -.2895** -.4450** -.6188** -.4032** -.3317** P -.2021**
-.1752* -.2499** -.3192** -.1671* -.1267
CP% G .0512** -.2660** -.5519** .1421 .4226** -.1481 -.2371** P .0449**
-.2606** -.4965** .0911 .0807 -.0829 -.1783*
IVDMD G .3134** .0926** -.2720** .5004** .8674** .1507 -.3518** .8925** P 3019**
.0897** -.2726** .4369** .3344** .0350 -.1426 .8444**
ADF% G -.2209** -.0968** .2010* -.5816** -.6881** -.1894* .6131** -.7588** -.9197** P -.2159**
-.0957** .1952* -.5011** -.2591** -.0866 .3270** -.7386** -.9124**
NDF% G .0181* .0431** .2324** -.3870** -.2068* -.3086** .2579** -.6716** -.7670** .8240** P .0153 .0399**
.2243** -.3468** -.0606 -.1978* .1421 -.6428** -.7562** .8171**
DMY G .8507** .7633** .5881** .6680** .7772** -.0750 -.2816** .1646* .3510** -.2450** -.2026** P .8210**
.7241** .5567** .5654** .3287** -.0600 -.1275 .1311 .3436** -.2326** -.1895*
GFY G .8720** .7905** .6362** .6726** .8920** -.0411 -.3544** .1195 .3233** -.2229** -.1474 .9908** P .8553**
.7660** .6125** .5973** .3750** -.0218 -.1818* .1030 .3190** -.2171** -.1426 .9824**
*=Critical value of ‘r’ at 5% = 0.16, **=Critical value of ‘r’ at 1% = 0.21; G= genotypic correlation coefficient; P= phenotypic correlation coefficient
ISSN 0975-928X
Table 3: Path coefficient analysis for direct (bold) and indirect effects on green fodder yield (kg/plot) in maize genotypes
Characters PH LL LW SG NOL NOC NOS CP% IVDMD ADF% NDF% DMY
Genotypic correlatio
n with GFY PH 0.3051 -.5571 0.0469 0.331 -.0314 0.0031 -.0584 -.0021 -.0721 0.0555 0.0034 0.8482 0.8721
LL 0.2702 -0.629 0.062 0.3762 -.0296 0.0084 -.0508 0.0109 -.0213 0.0243 0.008 0.7611 0.7904
LW 0.1507 -.4103 0.095 0.2171 -.0113 0.0087 -.0781 0.0226 0.0626 -.0505 0.0432 0.586 0.6357
SG 0.229 -.5368 0.0468 0.4409 -.0344 0.0163 -.1085 -.0058 -.1151 0.1461 -0.072 0.6661 0.6726
NOL 0.3571 -.6934 0.0401 0.5655 .0268 0.0278 -.0707 -.0173 -.1995 0.1728 -.0385 0.775 0.8921
NOC 0.0321 -.1792 0.0281 0.2453 -.0254 0.0294 -.0582 0.0061 -.0347 0.0476 -.0574 -0.0748 -0.0411
NOS -.1016 0.1821 -.0423 -.2728 0.0108 -.0097 0.1754 0.0097 0.0809 -0.154 0.048 -0.2808 -0.3543
CP% 0.0156 0.1673 -.0524 0.0627 -.0113 -.0044 -.0416 -.0409 -.2053 0.1906 -0.125 0.1641 0.1194
IVDMD 0.0956 -.0583 -.0258 0.2206 -.0233 0.0044 -.0617 -.0365 -0.23 0.231 -.1427 0.35 0.3233
ADF% -.0674 0.0609 0.0191 -.2564 0.0185 -.0056 0.1075 0.031 0.2115 -.2511 0.1533 -0.2443 -0.223
NDF% 0.0055 -.0271 0.0221 -.1706 0.0055 -.0091 0.0452 0.0275 0.1764 -.2069 0.1861 -0.202 -0.1474
DMY 0.2595 -.4802 0.0559 .2945 -.0209 -.0022 -.0494 -.0067 -.0807 0.0615 -.0377 0.9971 0.9907