Submitted3 September 2015 Accepted 16 December 2015 Published14 January 2016
Corresponding author Bryan C. Carstens, [email protected]
Academic editor Todd Vision
Additional Information and Declarations can be found on page 15
DOI10.7717/peerj.1576
Copyright 2016 Satler et al.
Distributed under
Creative Commons CC-BY 4.0
OPEN ACCESS
Biogeographic barriers drive
co-diversification within associated
eukaryotes of the
Sarracenia alata
pitcher
plant system
Jordan D. Satler1, Amanda J. Zellmer2and Bryan C. Carstens1
1Department of Evolution, Ecology and Organismal Biology, The Ohio State University, Columbus, OH,
United States
2Department of Biology, Occidental College, Los Angeles, CA, United States
ABSTRACT
Understanding if the members of an ecological community have co-diversified is a central concern of evolutionary biology, as co-diversification suggests prolonged association and possible coevolution. By sampling associated species from an ecosystem, researchers can better understand how abiotic and biotic factors influence diversifica-tion in a region. In particular, studies of co-distributed species that interact ecologically can allow us to disentangle the effect of how historical processes have helped shape
community level structure and interactions. Here we investigate theSarracenia alata
pitcher plant system, an ecological community where many species from disparate taxonomic groups live inside the fluid-filled pitcher leaves. Direct sequencing of the eukaryotes present in the pitcher plant fluid enables us to better understand how a host plant can shape and contribute to the genetic structure of its associated inquilines, and to ask whether genetic variation in the taxa are structured in a similar manner to the host plant. We used 454 amplicon-based metagenomics to demonstrate that the pattern of genetic diversity in many, but not all, of the eukaryotic community is similar to that ofS. alata, providing evidence that associated eukaryotes share an evolutionary history with the host pitcher plant. Our work provides further evidence that a host plant can influence the evolution of its associated commensals.
SubjectsBiodiversity, Biogeography, Genomics, Plant Science
Keywords Co-diversification,Sarracenia, 454 sequencing, Metagenomics, Phylogeography
INTRODUCTION
Dynamic processes during the Pleistocene epoch have been implicated as drivers of biological diversification (e.g.,Hewitt, 2000;Hewitt, 2004). Glacial cycles contributed to both landscape changes and climatic oscillations, providing strong abiotic factors that
have led to speciation within many groups (e.g.,Leaché & Fujita, 2010;McCormack et
rate and direction of flow of major rivers coupled with fluctuations in sea level influenced phylogeographic patterns in this region (reviewed inSoltis et al. 2006). Specifically, major rivers in the region have produced population genetic structure in many clades, with the Mississippi River recognized as a well-characterized biogeographic barrier (Brant & Orti, 2003;Pyron & Burbrink, 2009). The influence of landscape features coupled with the presence of large-scale barriers can be expected to isolate populations within a species, especially those with limited dispersal abilities. Consequently, plants and animals that lack the ability to traverse large bodies of water are expected to exhibit substantial population genetic structure in this region.
Complex interactions that occur within ecological communities can influence the formation and maintenance of biodiversity. For example, numerous studies have shown how host plant diversification can contribute to the diversification of associated species, typically insects (e.g., Farrell & Mitter, 1990; Wheat et al., 2007;McKenna et al., 2009;
Espíndola, Carstens & Alvarez, 2014). These include systems where plants evolve secondary
compounds in an ‘‘escape and radiate’’ model of coevolution (Ehrlich & Raven, 1964),
and systems that include mutualist organisms such as plants and their pollinators. Such
interactions can result in congruent demographic histories (e.g.,Smith et al., 2011) and
patterns of co-diversification (e.g., Rønsted et al., 2005). While it seems clear that the ecological interactions among plants and associated arthropods (e.g., herbivores and pollinators) can potentially drive patterns of co-diversification, it is unclear how host plants may influence other commensal organisms, particularly small eukaryotes. Communities of commensal organisms in both facultative and obligate relationships may be expected to show varying evolutionary patterns attributed to the level of dependency on the host plant. Given the dynamic and topologically complex landscape of the southeastern region, the study of ecological communities that span the breadth of host affinity, dispersal ability and life history traits can help inform how taxonomically diverse communities have assembled through time, and whether present day ecological associations extend into the deep past.
Phytotelmata—water bodies contained within living plants—provide an ideal system for investigating co-diversification within an ecological community because they are
self contained and discrete units (Kitching, 2000). Carnivorous pitcher plants are one
such system, where decades of ecological work have documented a complex and distinct ecosystem associated with the pitcher fluid contained within the modified leaves. Pitcher
plants in the genusSarracenia(F. Sarraceniaeceae) contain a diverse microbiome, including
groups such as bacteria, algae, protists, rotifers and arthropods (e.g.,Folkerts, 1999;Miller & Kneitel, 2005;Peterson et al., 2008;Koopman et al., 2010). Their highly modified leaves form a trap that captures and digests prey items, while also providing a unique habitat for commensal organisms. Associated inquilines form complex relationships in the pitchers, with many supplying digestive enzymes that help break down decomposing prey items
providing inorganic compounds for the plant (seeAdlassnig, Peroutka & Lendl, 2011). A
wide range of ecological work has investigated the communities associated with these plants,
primarily inSarracenia purpurea, showing community structure and interactions among
Figure 1 Sampling distribution ofSarracenia alatain Louisiana. Sample sites are partitioned based on side of the Mississippi River. Red circles represent Kisatchie (K) and Cooter’s Bog (C) in the west; blue squares represent Lake Ramsey (L), Abita Springs (A) and Talisheek (T) in the east.
on the Pale Pitcher Plant Sarracenia alata, a species distributed in patchy habitats along
the gulf coast across eastern Texas, Louisiana, Mississippi and Alabama. This species is largely isolated from its congeners and occupies disjunct eastern and western regions across
the Mississippi River (Fig. 1). Work byKoopman & Carstens (2010)identified population
genetic structure inS. alata, andZellmer et al. (2012)showed that major rivers in the
region promoted diversification within the plant. Population divergence across either side of the Mississippi River is likely well into the Pleistocene, and estimated at greater than 120,000 years before present (Zellmer et al., 2012). Further analysis suggests thatS. alata
may contain two cryptic species, corresponding to populations on the eastern and western sides of the Mississippi River (Carstens & Satler, 2013).Sarracenia alatathus represents a particularly attractive system for investigating patterns of co-diversification, because the species exhibits strong genetic differentiation across the landscape, with significant
divergence across an important biogeographic barrier (Soltis et al., 2006). In addition,
longleaf pine savannahs in the south have seen a staggering amount of habitat loss in recent
times (∼1% of its original habitat remains;Noss, 1989). High levels of cryptic genetic
diversity highlightS. alataas a species of interest; identifying ecologically associated taxa with a shared evolutionary history has clear conservation implications.
Hope et al., 2014). While these studies can reveal evolutionary processes that produce patterns within biogeographic regions, the conclusions drawn from such findings can be limited by the shared life history traits that influence the formation of genetic structure (e.g., dispersal ability, population size). Metagenomics provides a powerful approach for
efficiently and rapidly sampling taxonomic diversity within a habitat (reviewed inTringe
& Rubin, 2005), and thus may provide comparative phylogeographic investigations with an efficient approach to the sampling of taxa. Through the sequencing of environmental DNA, communities of small to microscopic organisms can be directly sampled from the environment resulting in the assemblage of a data set spanning a wide taxonomic
breadth. Thus, when coupled with next generation sequencing methods (Mardis, 2008),
metagenomics greatly increases the ‘‘taxonomic toolbox’’ lending itself well to investigations of comparative phylogeography. By analyzing a disparate assemblage of taxa comprising an ecological community, our work has the potential to reveal a shared response to historical events and thus evidence that evolutionary processes can shape community structure
and interactions through time (Smith et al., 2011). With the diverse array of microscopic
inquilines present withinSarracenia(e.g.,Miller & Kneitel, 2005), pitcher plants provide an ideal system for understanding how a host plant may influence genetic variation within an associated community, and metagenomics provides a tool for sampling this taxonomic diversity.
Here we explore the process of evolutionary diversification in an ecological community.
We directly sample pitcher fluid from the modified leaves of S. alata, and apply a novel
approach utilizing metagenomics to test ifS. alatahas influenced genetic structure in its
eukaryotic commensal organisms. First, we characterize taxonomic diversity within the pitcher plant fluid to get an understanding of the major lineages and their abundance in this unique habitat. We then generate a comparative data set of OTUs which span the Mississippi River, and assess the degree to which the inquiline community shares population genetic structure with the host plant. We hypothesize that if eukaryotes associated with
S. alata are ecologically dependent on the plant, then the evolutionary history of the
commensals should exhibit population genetic structure largely congruent with that ofS.
alata. Alternatively, if taxa do not share an evolutionary history withS. alata, community members should have unique population genetic structure indicating an idiosyncratic response to landscape processes driving diversification in the region.
MATERIAL AND METHODS
Genetic sampling
Pitcher fluid samples were collected following Koopman & Carstens (2010)during the
spring and summer of 2009 from part of the plant’s distribution. Specifically, samples were collected from 40 individuals across four locales (Abita Springs, Cooter’s Bog, Kisatchie,
Talisheek; Fig. 1) in Louisiana during June and August, as pitcher diversity peaks at
this time (Koopman et al., 2010). In addition, fluid was collected from ten individuals
originally designed to investigate both spatial (all five locales) and temporal (Lake Ramsey) dynamics, however, we focus on just spatial patterns in this study. DNA was extracted using the Powersoil DNA Isolation Kit (MO Bio, Carlsbad, CA, USA). The large subunit 28S rRNA region was amplified for each fluid sample using the following primer combination (LS1F: GTACCCGCTGAACTTAAGC ; LS4R: TTGTTCGCTATCGGTCTC; modified fromHausner, Reid & Klassen, 1993), targeting a roughly 330 base pair (bp) region. Each pitcher fluid sample was labeled with MID tags to allow for multiplexing of individuals. PCRs were performed in triplicate and then pooled to prevent PCR bias, and subsequently sequenced on a 454 Life Sciences Genome Sequencer FLX (Roche, Basel, Switzerland) at the Engencore Genomics Facility (University of South Carolina, Columbia) using 1/8th of
a plate. Raw sequences were initially processed using Mothur (Schloss et al., 2009) to sort
sequences by individual, remove low quality reads, and identify unique sequences for each
individual. Chloroplast data forS. alatawas gathered from a previous study (seeCarstens
& Satler (2013)for details).
Bioinformatics
To quantify the taxonomic diversity present within the pitchers, sequences were clustered
into operational taxonomic units (OTUs) throughde novoassembly. Metagenomic studies
commonly usede novoassembly for generating OTUs (e.g.,O’Brien et al., 2005;Bik et al.,
2012;Zimmerman & Vitousek, 2012), and this allowed for a rough characterization of the number of taxonomic units present within the pitcher fluid.
Sequences were first combined within each of the sampling locales (i.e., we restricted clustering to those sequences collected from within each sample site), thereby treating
each of the five sites as a separate population (seeFig. 1). Reads were trimmed to 275 bp,
discarding any sequences below this threshold to remove potential bias associated with clustering samples of unequal sequence size. For consistency, we only analyzed sequences from Lake Ramsey collected at the same time periods as from the other sampling sites.
Trimmed sequences were assembled into clusters using the UPARSE algorithm (Edgar,
2013); this pipeline been shown to outperform commonly used clustering methods such as
Mothur and QIIME, and to work well under a solelyde novoclustering approach. Within
each locale, identical reads were collapsed and abundance values recorded (i.e., the number of times each unique read appeared in the data set). Sequences were then clustered based upon a 97% threshold, with the most represented sequences (based on abundance values) used to form initial OTU clusters, using a dynamic programming algorithm to find clusters with the maximum score. The percent similarity threshold is subjective, but since it is
required forde novoassembly, we justify this value by noting that (i) it was recommended
by the author forde novoassembly in UPARSE (Edgar, 2013), (ii) it falls within the range
used to delimit fungi with this locus (seeSota et al., (2014)and references within), a group
Following OTU clustering, a single sequence from each cluster was used with a Basic Local Alignment Search Tool (BLAST) search to gather taxonomic identification for each of the clusters. Although there is a concern with the incompleteness of public databases, and that searches could return spurious matches (Koski & Golding, 2001;Tringe & Rubin,
2005), at a higher taxonomic level (e.g., Class, Order), we can be reasonably confident that
sequence matches reveal organismal affinity. In addition, for the purposes of this study, a qualitative assessment of higher level identification is sufficient to understand taxonomic diversity present within the pitcher fluid. A custom python script was used to search for taxonomic identities among the OTUs. For all BLAST searches, sequences representing the centroid of the original OTU searches (in UPARSE) were queried against the NCBI nucleotide database, using the Megablast search algorithm, saving the top hit from each search. OTUs with BLAST hits were grouped by higher-level identification, generally at the level of Class or Order, to identify the variety of organisms present within the pitcher fluid. After summarizing taxonomic identity within the pitcher fluid at each site, rarefaction
curves were generated with the package vegan (Oksanen et al., 2015) in R (R Core Team,
2015), as a means to test if the taxonomic diversity had been adequately captured with our
sampling efforts.
Population structure
The major goal of this study is to identify OTUs that span the Mississippi River, and test
if the landscape processes that have influenced diversification inS. alatahave influenced
the sampled organisms in a similar manner. To generate a comparative data set, all raw sequences were combined and OTUs were assembled with UPARSE following the steps outlined above (i.e., all sequences were clustered in a global analysis, regardless of sampling location). This data set included all sequences generated from Lake Ramsey, as we were interested in collecting taxa with widespread distributions. If taxa were time dependent, they would be restricted to Lake Ramsey (during the months when only this locality was sampled) and removed following our filtering process (see below); however, taxa stable in these communities would comprise additional sequence information for comparative analysis. Following initial OTU clustering, the data set was reduced to those taxa that contained at least ten sequences per OTU with a minimum of three sequences on either side of the Mississippi River. These thresholds were used to maximize the number of OTUs represented in the final data set while still containing enough sequence data for statistical inference, both within and across sampling sites. In addition, it is expected that any potential chimeric sequences not removed in the clustering step will fall below these thresholds, further reducing the potential for error with our final OTUs. Each OTU was aligned with MAFFT (Katoh & Standley, 2013), using either the L-INS-i (<200 sequences)
or FFT-NS-i (>200 sequences) algorithm. To survey taxonomic diversity among the
retained OTUs, a BLAST search was conducted on each of the OTUs following the same steps as outlined above.
the package Pegas (Paradis, 2010) in R. Several approaches were used to explore the
partitioning of genetic variation among the OTUs. GST(Nei, 1973) values were generated
to estimate the degree of population differentiation among the locales, and were calculated
with the R package gstudio (Dyer, 2012). The level of genetic partitioning was assessed with
an analysis of molecular variation (AMOVA;Excoffier, Smouse & Quattro, 1992), because
the GSTis an analog to FSTvalues (Nei, 1973). AMOVAs take into account the amount of
variation in the sequence data, thereby extracting more information to determine the level of spatial structuring within the taxa. AMOVAs were calculated in the program SPADS (Dellicour & Mardulyn, 2014), with 10,000 permutations to generate levels of significance. Hierarchical levels tested included (i) sampling locales within each region (i.e., side of the Mississippi River), (ii) sampling locales within total distribution, and (iii) between regions. In addition, the amount of allelic sorting on either side of the Mississippi River
was calculated using the genealogical sorting index (GSI;Cummings, Neel & Shaw, 2008).
This method is commonly applied to tests of taxonomic distinctness; it is applied here to quantify levels of lineage sorting within each side of the river, with higher levels of sorting suggesting greater population genetic structure indicative of a longer period of population isolation. GSI values range from 0 (no sorting) to 1 (monophyletic on either
size of barrier), withp-values indicating the extent to which genetic structure recovered is
more than would be expected by chance alone. An input genealogy is required to calculate the GSI; these were estimated using Maximum Likelihood (ML) with RAxML v7.2.8 (Stamatakis, 2006;Stamatakis, Hoover & Rougemont, 2008). Depending on the number of
sequences in the OTU, models of sequence evolution included either GTRCAT (>200
sequences) or GTRGAMMA (<200 sequences). Each ML tree was then input to the
GSI web server, with 10,000 permutations to generate levels of significance. In addition, isolation by distance (IBD) values were calculated to see if there was a correlation between
genetic and geographic distance, using the IBDWS v3.23 web server (Jensen, Bohonak &
Kelley, 2005). Genetic distance matrices were calculated using a Kimura 2-parameter (K2P) substitution model for each OTU; geographic matrices were constructed measuring the Euclidean distance between sampling locales in kilometers with the distance measurement
tool in Google Earth (www.google.com/earth/, last accessed 18 July 2015). Finally, we used
a chi-squared goodness-of-fit test to see if the number of OTUs with significant population genetic structure across the various analyses was more than would be expected by chance
alone (assuming α=0.05). This allowed us to test the null hypothesis that there is no
correlation of population structure between the members of the eukaryotic community and the host plant.
RESULTS
Genetic sampling
High-throughput sequencing resulted in a total of 26,399 sequences across 90 sampled pitchers. Following demultiplexing and quality control of samples, an average of 101 unique sequences were retained per pitcher (range: 12–199) for a total of 9,045 sequences. A FASTA file containing all 9,045 sequences, as well as all OTU matrices from the comparative data
Taxonomic diversity
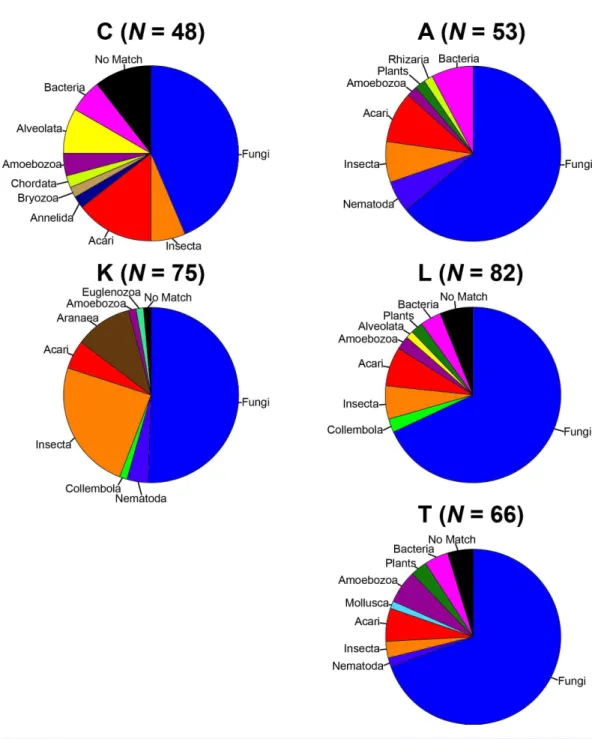
To remove biases associated with the clustering of length variable sequences, all sequences were trimmed to 275 bp (discarding any reads below this threshold), reducing the data set from 9,045 sequences to 8,991 sequences. Lake Ramsey contained a disproportionately larger percentage of the total number of sequences (49%); however, to compare samples collected from the same time periods, we only analyzed those samples from June and August, reducing the number of sequences from Lake Ramsey from 4,398 to 2,286, resulting in a total of 6,879 sequences. OTU clustering at the 97% sequence identity within each locale resulted in a median of 66 OTUs per sample site (324 total), ranging from 48 (Cooter’s Bog) to 82 (Lake Ramsey) total OTUs, with an average of 21 sequences per OTU when averaged across all sites. The majority of OTUs had a close hit in the BLAST search (97%), although a small number of OTUs (13) did not contain a match in the database
(Fig. 2). Taxonomic diversity ranged across the tree of life, with many OTUs containing
hits to fungi, and to a lesser extent, various arthropod groups, including insects and mites. In addition, numerous other groups were recovered in the searches, including protozoans,
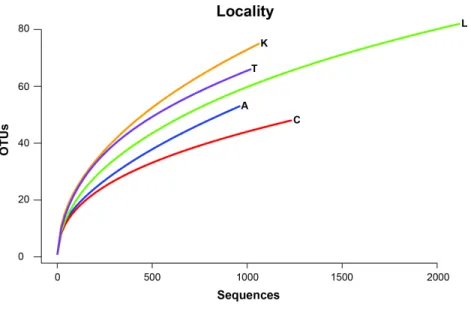
nematodes, an annelid and even a vertebrate (Sus scrofa, wild boar). Rarefaction curves
for each sample site suggest that OTU diversity has not yet been reached, indicating that
the pitcher plant community was not fully sampled in any of the sites (Fig. 3). Although
fewer sequences per site likely prevented us from obtaining representatives from the full diversity of species within each pitcher, wider spatial sampling helped us achieve our goal of sampling a large number of eukaryotic species for a comparative data set (see below).
Population structure
A global clustering effort was completed to generate a comparative data set for taxa that span the Mississippi River. As we were interested in widespread taxa, we used all sequences collected from Lake Ramsey—including those collected from additional time periods—
resulting in the use of the full data set (8,991 sequences). Followingde novoclustering,
UPARSE produced 323 OTUs of which 65 contained a minimum of ten sequences and of these, 31 OTUs contained at least three representatives on either side of the river. BLAST hits of a single sequence from each of the 31 OTUs indicate that fungi and mites are
the most well represented taxa (Table 1). One OTU did not contain a significant BLAST
hit, and with parameters relaxed, poorly matched a portion of the sequence to multiple disparate taxonomic groups. Since we detected it in multiple pitchers, it seems unlikely that this OTU represents a chimeric sequence. Given the incompleteness of taxonomic databases, however, we retained this OTU for downstream analysis, resulting in a final
dataset of 31 OTUs (seeTable S1for the sequencing distribution among locales). In this
final set, the number of sequences per OTU ranged from 14 to 2,507, with a median of 54
(average of 225 sequences;Table 1).
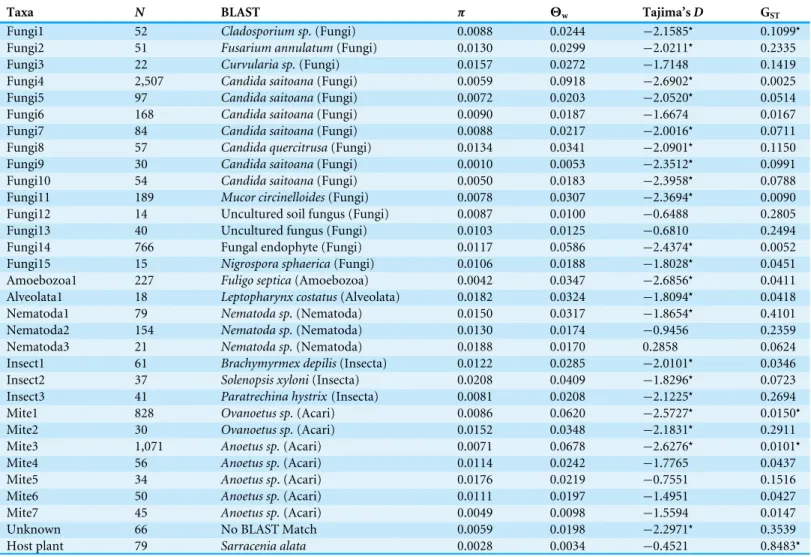
A range of genetic variation is present in the sampled OTUs (Table 1). For example,
estimates of nucleotide diversity (π) range from∼0.001 to 0.05, a fifty fold difference.
TajimaDvalues are negative for most taxa (median= −2.0101), with 21 of these values
significant, indicative of an excessive number of segregating sites in the data sets. Negative
Figure 2 Taxonomic composition of the OTUs for each sample site.Each site contains the number of OTUs (N) and the major lineages in which they belong. SeeSupplemental Information 1for full sampling information.
from natural selection, on the marker itself or on a linked gene. This could also be the result of population structure in those OTUs, as collapsing separate populations can increase the number of segregating sites in a taxon. Among taxonomic groups, all fungi have a negative
TajimaDvalue, with the majority (73%) being significant. Of note are the TajimaDvalues
Figure 3 Rarefaction curves of OTU richness at each sampling site are shown with the number of OTUs plotted against the number of sequences.
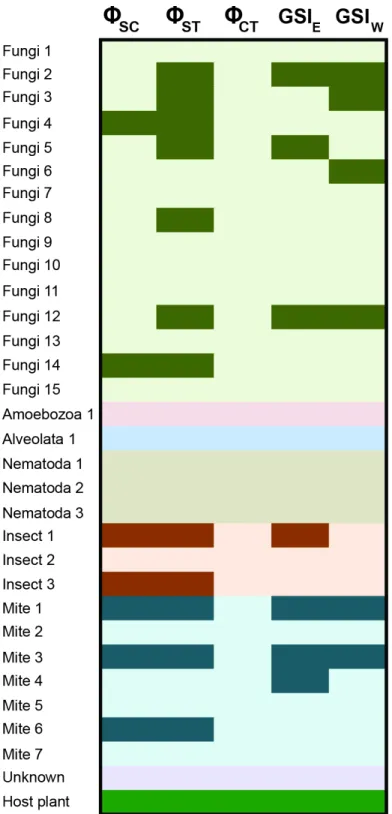
There are varying levels of population structure across the taxonomic groups. Roughly half of the fungi contain significant partitioning of genetic variance at the level of the sampling locale, with two taxa also significant at the level of locales within regions (Fig. 4;
Table S2). Sequence-based F statistics display similar patterns, with GST values ranging
from 0.003 to 0.280 (average GST=0.101), suggesting population genetic structure is
evident on either side of the Mississippi River in many taxa. Despite this structure, there is considerable sharing of alleles across the Mississippi River in the fungi, although some of the species contain greater sorting than would be expected by chance (see GSI results; Fig. 4;Table S2). Furthermore, genetic diversity in all but two of the fungi is not correlated
with geographic distance (Table S2). Results in the mites are similar, with roughly half of
the taxa sampled showing a significant amount of genetic variation distributed among the locales, as well as across the Mississippi River (Fig. 4,Table S2). F statistics in the mites are slightly lower than those in the fungi (average GST=0.081). This structure is also evident
in the GSI results, with allelic sorting in most taxa higher than would be expected by chance
(Fig. 4;Table S2). Patterns among the fungi (roughly half of the OTUs), mites and insects
generally reflect those of the host plant, with the remaining taxa showing essentially no evidence for this shared genetic structure. Chi-squared goodness-of-fit tests show that more taxa share population genetic structure with the host plant than would be expected
by chance in many of the analyses (Table 2).
DISCUSSION
Investigations into the evolutionary history of host plants and their associated insects have
provided evidence for co-diversification over long time-periods (e.g., Weiblen & Bush,
2002) in addition to demographic patterns that suggest a concerted response to abiotic
Table 1 Taxa included in the final comparative data set. Information for OTUs include number of sequences (N), their nearest BLAST hit (ex-cept forS. alata), nucleotide diversity (π), Watterson’s theta (2w) per site, Tajima’sD, and GST. Significance of GSTand Tajima’sD(Dfollowing a
beta distribution;Tajima, 1989) atα=0.05 is indicated with an asterisk (⋆).
Taxa N BLAST π 2w Tajima’sD GST
Fungi1 52 Cladosporium sp.(Fungi) 0.0088 0.0244 −2.1585⋆ 0.1099⋆
Fungi2 51 Fusarium annulatum(Fungi) 0.0130 0.0299 −2.0211⋆ 0.2335
Fungi3 22 Curvularia sp.(Fungi) 0.0157 0.0272 −1.7148 0.1419
Fungi4 2,507 Candida saitoana(Fungi) 0.0059 0.0918 −2.6902⋆ 0.0025
Fungi5 97 Candida saitoana(Fungi) 0.0072 0.0203 −2.0520⋆ 0.0514
Fungi6 168 Candida saitoana(Fungi) 0.0090 0.0187 −1.6674 0.0167
Fungi7 84 Candida saitoana(Fungi) 0.0088 0.0217 −2.0016⋆ 0.0711
Fungi8 57 Candida quercitrusa(Fungi) 0.0134 0.0341 −2.0901⋆ 0.1150
Fungi9 30 Candida saitoana(Fungi) 0.0010 0.0053 −2.3512⋆ 0.0991
Fungi10 54 Candida saitoana(Fungi) 0.0050 0.0183 −2.3958⋆ 0.0788
Fungi11 189 Mucor circinelloides(Fungi) 0.0078 0.0307 −2.3694⋆ 0.0090
Fungi12 14 Uncultured soil fungus (Fungi) 0.0087 0.0100 −0.6488 0.2805
Fungi13 40 Uncultured fungus (Fungi) 0.0103 0.0125 −0.6810 0.2494
Fungi14 766 Fungal endophyte (Fungi) 0.0117 0.0586 −2.4374⋆ 0.0052
Fungi15 15 Nigrospora sphaerica(Fungi) 0.0106 0.0188 −1.8028⋆ 0.0451
Amoebozoa1 227 Fuligo septica(Amoebozoa) 0.0042 0.0347 −2.6856⋆ 0.0411
Alveolata1 18 Leptopharynx costatus(Alveolata) 0.0182 0.0324 −1.8094⋆ 0.0418
Nematoda1 79 Nematoda sp.(Nematoda) 0.0150 0.0317 −1.8654⋆ 0.4101
Nematoda2 154 Nematoda sp.(Nematoda) 0.0130 0.0174 −0.9456 0.2359
Nematoda3 21 Nematoda sp.(Nematoda) 0.0188 0.0170 0.2858 0.0624 Insect1 61 Brachymyrmex depilis(Insecta) 0.0122 0.0285 −2.0101⋆ 0.0346
Insect2 37 Solenopsis xyloni(Insecta) 0.0208 0.0409 −1.8296⋆ 0.0723
Insect3 41 Paratrechina hystrix(Insecta) 0.0081 0.0208 −2.1225⋆ 0.2694
Mite1 828 Ovanoetus sp.(Acari) 0.0086 0.0620 −2.5727⋆ 0.0150⋆
Mite2 30 Ovanoetus sp.(Acari) 0.0152 0.0348 −2.1831⋆ 0.2911
Mite3 1,071 Anoetus sp.(Acari) 0.0071 0.0678 −2.6276⋆ 0.0101⋆
Mite4 56 Anoetus sp.(Acari) 0.0114 0.0242 −1.7765 0.0437
Mite5 34 Anoetus sp. (Acari) 0.0176 0.0219 −0.7551 0.1516
Mite6 50 Anoetus sp.(Acari) 0.0111 0.0197 −1.4951 0.0427
Mite7 45 Anoetus sp.(Acari) 0.0049 0.0098 −1.5594 0.0147
Unknown 66 No BLAST Match 0.0059 0.0198 −2.2971⋆ 0.3539
Host plant 79 Sarracenia alata 0.0028 0.0034 −0.4521 0.8483⋆
Table 2 A chi-squared goodness-of-fit test was used to measure if the number of taxa with significant population genetic structure was more than would be expected by chance alone.Under a null model we would expect a significant result 5% of the time (assumingα=0.05). Results show that for many analyses,
there are more OTUs with significant values than expected by chance, suggesting an association between many members of the community and the host pitcher plant.
Test χ2 df p-value Number significant Total taxa
8SC 22.3612 1 2.26×10⁻⁶ 7 29
8ST 80.8004 1 2.20×10⁻¹⁶ 12 29
8CT 1.5263 1 0.22 0 29
GST 1.4278 1 0.23 3 31
GSIE 20.1715 1 7.08×10⁻⁶ 7 31
Figure 4 Population genetic structure for the inquiline community spanning the Mississippi River.
Results are shown from the AMOVA and GSI analyses. AMOVA analyses show the hierarchical partition-ing scheme of locales within regions (8SC), locales within total distribution (8ST), and between regions
(8CT). GSI analyses represent the amount of allelic sorting on the eastern and western sides of the
Mis-sissippi River. Dark cells indicate taxa with significant genetic structure at the corresponding level;Table S2contains specific values from each analysis. SeeCarstens & Satler (2013)for sampling information for
sampled a diverse set of organisms (representing similarly diverse ecological interactions) associated with the Pale Pitcher Plant in order to investigate the extent to which this
ecological community has co-diversified. Within Sarracenia alata, previous work has
demonstrated that populations are genetically structured across the landscape (Koopman
& Carstens, 2010). Major rivers are important drivers of diversification both in the region (Soltis et al., 2006) and forS. alata(Zellmer et al., 2012), and analysis of the barcode data presented here demonstrates that slightly under half of the eukaryotes sampled share similar population genetic structure withS.alata.
Our results show that a core eukaryotic community exhibits congruent patterns of population genetic structure, with many taxa displaying significant genetic structuring at
the level of the sampling locality (based on8ST); approximately half of the microscopic
fungi and half of the mites are structured in a manner similar to that of the host plant (Fig. 4). Given the dispersal capabilities of fungal spores (e.g.,Peay, Kennedy & Bruns, 2008), this degree of population genetic structure is strikingly high (but seeTaylor et al., 2006). Fungi are ubiquitous in terrestrial habitats, however, with many species associated with soils and plants. Fungal species have also been recovered from pitcher plant leaves, demonstrating
their known presence within these microhabitats (reviewed inAdlassnig, Peroutka & Lendl,
2011). Multiple mite species from the family Histiostomatidae have been described from
Sarraceniapitcher plants (Hunter & Hunter, 1964;Fashing & O’Connor, 1984), and act as prey consumers within the pitchers. Approximately half of the mites identified here exhibited population genetic structure similar to that ofS. alata, reflecting structure seen
both among sample sites and across the Mississippi River (Fig. 4). Other members of this
core group include two of the three sampled insects (all three share a closest BLAST hit to ants), with general strong support across analyses for co-diversification. Ants comprise a large component of prey items forSarracenia(Newell & Nastase, 1998;Ellison & Gotelli,
2009), and one could interpret these results as being indicative of general biogeographic
structuring in the longleaf pine savannah habitat. Such results are illustrative of the challenges associated with understanding if interactions among organisms have driven the shared responses to historical events reflected in patterns of co-diversification.
Although ants represent a major prey item ofSarraceniaplants, our field work suggests
While slightly under one-half of the sampled taxa share population genetic structure withS. alata, there are other taxa with discordant evolutionary histories. Many of the fungal taxa exhibit little to no population structure, and we suspect that these microscopic species are widespread and not restricted to the pitcher plant bog habitats. Their dispersal ability is likely to be higher than the larger members of this community, allowing them to escape the influence of biogeographic barriers. Other microscopic eukaryotes exhibit no evidence of population structure, including two protizoans and the sampled nematodes, suggesting that biogeographic barriers do not provide an obstacle for long-distance dispersal in these
taxa (Finlay, 2002). In addition, one insect species demonstrates a lack of population
structure. Further investigation of the BLAST result for this OTU (hit toSolenopsis xyloni
in original search; seeTable 1) indicates that this OTU is an identical match to the invasive
red fire ant (Solenopsis invicta). Given the devastating impact and colonization power of
the red imported fire ant, the lack of population structure is likely a product of their recent
introduction to the southeastern United States (from South America).Solenopsis invicta
has grown explosively and displaced native species in the region (Porter & Savignano, 1990;
Stuble, Kirkman & Carroll, 2009) and the lack of structure recovered is consistent with the expectations of an invasive species. Clearly, ecological association and dispersal ability both play a role in the level of congruence detected in population genetic structure across species, although quantifying these two factors, especially dispersal for microscopic eukaryotes, remains a challenge.
Phylogeographic patterns within a species can be informative, but in aggregate, the results across many species make it possible to identify community responses to landscape changes. To date, phylogeographic researchers have not fully utilized metagenomics as a
tool for increasing the taxonomic breadth of a comparative study. TheS. alatasystem is
ideal for such studies, as each pitcher provides a self-contained and discreet habitat, where micro- and macroscopic organisms can live and persist in an ecological entanglement. The increased sampling facilitated by metagenomic approaches allowed us to identify
a core evolutionary community within S. alata, and the simplest explanation for this
congruence is that the core community has diversified in unison because the constituent
members are ecologically dependent onS. alata. As such, the OTUs sampled represent an
example of shared evolutionary patterns across an ecological community, and suggests that co-diversification is not limited to specialized interactions such as plants and pollinators. The recent discovery of cryptic diversity withinS. alata(Carstens & Satler, 2013), together with the work presented here, highlights the need for conserving species like pitcher plants, which play a role in the survival of many different organisms. Such systems contain species that have been ecologically interdependent over evolutionary time scales, thus the loss of substantial diversity in the pitcher plant could lead to loss of diversity in its commensal species.
structured species and communities in a region (Bermingham & Moritz, 1998). Potential pitfalls, however, do remain when applying metagenomics for such an analysis. In this
study, a large number of sampled OTUs are fungi (Fig. 2), which could be indicative of
their ubiquity in nature, but could also be due to our use of primers originally developed from fungal genomic resources. The need to isolate specific gene fragments with primers could have biased the taxonomic sampling, which may have also contributed to the non-asymptotic nature of the rarefaction curves, although this is more likely due to a relatively small number of sequences from next generation sequencing with the sampling
strategy used in this study. In addition, challenges exist when usingde novoassembly for
generating a taxonomic data set, particularly with the requirement of a percent threshold to determine the placement of sequences within OTUs. Although some values are commonly used for certain groups, it is unlikely that a single cutoff is appropriate across the tree of life. Further exploration of the correlation between sequence similarity and taxonomic identity across diverse groups is necessary to better place sequences with their proper OTU. However, as demonstrated here, metagenomic data can be beneficial for phylogeographic studies, with careful and transparent analysis of the data providing valuable insight into the diversification of a region, or in our case, an ecological community composed of a diverse set of lineages.
Remarkably, the co-diversification described here may extend beyond the eukaryotic
members of this ecosystem. Koopman & Carstens (2011) provide evidence that the
phylogenetic community structure in the bacterial microbiome reflects the population genetic structure of the plant. Since the bacterial microbiome is dominated by
Enterobacteriaceae (Koopman et al., 2010), a family commonly found in animal guts,
it could be that the insect members of the core community facilitate colonization of bacteria in the pitchers (which are sterile before opening; see Peterson et al., 2008). If the core arthropods seed the pitchers with Enterobacteria, these microbes may produce enzymes that contribute to the digestive function of the pitcher. Since these complex ecological interactions have likely persisted for hundreds of thousands of years (based
on estimates fromS. alata), our work underscores the importance of investigating the
evolutionary relationships of ecological communities.
ACKNOWLEDGEMENTS
We thank members of the Carstens lab, particularly Margaret Hanes (formerly Koopman) and Sarah Hird, for comments and discussion regarding the manuscript. We thank the Academic Editor and reviewers for comments that helped improve this manuscript.
ADDITIONAL INFORMATION AND DECLARATIONS
Funding
and Economic Development, and Louisiana Board of Regents for funding to BCC. The funders had no role in study design, data collection and analysis, decision to publish, or preparation of the manuscript.
Grant Disclosures
The following grant information was disclosed by the authors: Society for the Study of Evolution.
Society of Systematic Biologists. Louisiana EPSCoR Pfund.
LSU Office of Research and Economic Development. Louisiana Board of Regents.
Competing Interests
The authors declare there are no competing interests.
Author Contributions
• Jordan D. Satler conceived and designed the experiments, performed the experiments,
analyzed the data, contributed reagents/materials/analysis tools, wrote the paper, prepared figures and/or tables, reviewed drafts of the paper.
• Amanda J. Zellmer conceived and designed the experiments, performed the experiments,
analyzed the data, contributed reagents/materials/analysis tools, wrote the paper, reviewed drafts of the paper, collected the samples.
• Bryan C. Carstens conceived and designed the experiments, contributed
reagents/mate-rials/analysis tools, wrote the paper, reviewed drafts of the paper, collected the samples, purchased coffee.
Data Availability
The following information was supplied regarding data availability:
Dryad doi:10.5061/dryad.j3n0g.
Supplemental Information
Supplemental information for this article can be found online athttp://dx.doi.org/10.7717/
peerj.1576#supplemental-information.
REFERENCES
Addicott JF. 1974.Predation and prey community structure: an experimental study
of the effect of larvae on the protozoan communities of pitcher plants.Ecology
55:475–492DOI 10.2307/1935141.
Adlassnig W, Peroutka M, Lendl T. 2011.Traps of carnivorous pitcher plants as a
habitat: composition of the fluid, biodiversity and mutualistic activities.Annals of
Botany107:181–194 DOI 10.1093/aob/mcq238.
Avise JC, Arnold J, Ball RM, Bermingham E, Lamb T, Neigel JE, Reeb CA, Saunders NC. 1987.Intraspecific phylogeography: the mitochondrial DNA bridge between
population genetics and systematics.Annual Review of Ecology and Systematics
18:489–522DOI 10.1146/annurev.es.18.110187.002421.
Bell RC, MacKenzie JB, Hickerson MJ, Chavarria KL, Cunningham M, Williams S, Moritz C. 2012.Comparative multi-locus phylogeography confirms multiple vicariance events in co-distributed rainforest frogs.Proceedings of the Royal Society B: Biological Sciences279:991–999DOI 10.1038/rspb.2011.1229.
Bermingham E, Moritz C. 1998.Comparative phylogeography: concepts and
applica-tions.Molecular Ecology 7:367–369DOI 10.1046/j.1365-294x.1998.00424.x.
Bik HM, Porazinska DL, Creer S, Caporaso JG, Knight R, Thomas WK. 2012.
Sequenc-ing our way towards understandSequenc-ing global eukaryotic biodiversity.Trends in Ecology
& Evolution27:233–243DOI 10.1016/j.tree.2011.11.010.
Bradshaw WE, Creelman RA. 1984.Mutualism between the carnivorous purple
pitcher plant and its inhabitants.American Midland Naturalist 112:294–304
DOI 10.2307/2425436.
Brant SV, Orti G. 2003.Phylogeography of the Northern short-tailed shrew,Blarina bre-vicauda(Insectivora: Soricidae): past fragmentation and postglacial recolonization.
Molecular Ecology 12:1435–1449DOI 10.1046/j.1365-294X.2003.01789.x. Buckley HL, Miller TE, Ellison AM, Gotelli NJ. 2003.Reverse latitudinal trends
in species richness of pitcher-plant food webs.Ecology Letters6:825–829
DOI 10.1046/j.1461-0248.2003.00504.x.
Burbrink FT, Lawson R, Slowinski JS. 2000.Mitochondrial DNA phylogeography of the
polytypic North American rat snake (Elaphe obsoleta): a critique of the subspecies
concept.Evolution54:2107–2118DOI 10.1111/j.0014-3820.2000.tb01253.x.
Carstens BC, Satler JD. 2013.The carnivorous plant described asSarracenia alata
contains two cryptic species.Biological Journal of the Linnean Society 109:737–746
DOI 10.1111/bij.12093.
Cummings MP, Neel MC, Shaw KL. 2008.A genealogical approach to quantifying
lineage divergence.Evolution62:2411–2422DOI 10.1111/j.1558-5646.2008.00442.x.
Dellicour S, Mardulyn P. 2014.SPADS 1.0: a toolbox to perform spatial
anal-yses on DNA sequence data sets.Molecular Ecology Resources14:647–651
DOI 10.1111/1755-0998.12200.
Dyer RJ. 2012.The gstudio package. Richmond: Virginia Commonwealth University. Edgar RC. 2013.UPARSE: highly accurate OTU sequences from microbial amplicon
reads.Nature Methods10:996–998DOI 10.1038/nmeth.2604.
Ehrlich PR, Raven PH. 1964.Butterflies and plants: a study in coevolution.Evolution
18:586–608DOI 10.2307/2406212.
Ellison AM, Gotelli NJ. 2009.Energetics and the evolution of carnivorous plants—
Darwin’s ‘most wonderful plants in the world’.Journal of Experimental Botany
Espíndola A, Carstens BC, Alvarez N. 2014.Comparative phylogeography of mutualists and the effect of the host on the genetic structure of its partners.Biological Journal of the Linnean Society 113:1021–1035DOI 10.1111/blj.12393.
Excoffier L, Smouse PE, Quattro JM. 1992.Analysis of molecular variance inferred from metric distances among DNA haplotypes: application to human mitochondrial DNA
restriction data.Genetics131:479–491.
Farrell B, Mitter C. 1990.Phylogenesis of insect/plant interactions: havePhyllobrotica
leaf beetles (Chrysomelidae) and the Lamiales diversified in parallel? Evolution
44:1389–1403DOI 10.2307/2409325.
Fashing NJ, O’Connor BM. 1984.Sarraceniopus—a new genus for Histiostomatid mites inhabiting the pitchers of the Sarraceniaceae (astigmata: Histiostomatidae).
International Journal of Acarology10:217–227 DOI 10.1080/01647958408683380. Finlay BJ. 2002.Global dispersal of free-living microbial eukaryote species.Science
296:1061–1063DOI 10.1126/science.1070710.
Folkerts D. 1999. Pitcher plant wetlands of the southeastern United States. In: Batzer
DP, Rader RB, Wissinger SA, eds.Invertebrates in freshwater wetlands of North
America: ecology and management. New York: John Wiley and Sons, 247–275. Fouquet A, Noonan BP, Rodrigues MT, Pech N, Gilles A, Gemmell NJ. 2012.Multiple
Quaternary refugia in the eastern Guiana shield revealed by comparative
phylogeog-raphy of 12 frog species.Systematic Biology61:461–489DOI 10.1093/sysbio/syr130.
Gotelli NJ, Ellison AM. 2006.Food-web models predict species abundances in response
to habitat change.PLoS Biology4:e324DOI 10.1371/journal.pbio.0040324.
Hausner G, Reid J, Klassen GR. 1993.On the subdivision ofCeratocystiss.l., based
on partial ribosomal DNA sequences.Canadian Journal of Botany71:52–63
DOI 10.1139/b93-007.
Hewitt G. 2000.The genetic legacy of the Quaternary ice ages.Nature405:907–913
DOI 10.1038/35016000.
Hewitt GM. 2004.Genetic consequences of climatic oscillations in the Quaternary.
Philosophical Transactions of the Royal Society B: Biological Sciences359:183–195
DOI 10.1098/rstb.2003.1388.
Hope AG, Ho SYW, Malaney JL, Cook JA, Talbot SL. 2014.Accounting for rate variation
among lineages in comparative demographic analyses.Evolution68:2689–2700
DOI 10.1111/evo.12469.
Hunter PE, Hunter CA. 1964.A newAnoetusmite from pitcher plants.Proceedings of the Entomological Society of Washington66:39–46.
Jackson ND, Austin CC. 2010.The combined effects of rivers and refugia generate
extreme cryptic fragmentation within the common ground skink (Scincella lateralis).
Evolution64:409–428DOI 10.1111/j.1558-5646.2009.00840.x.
Jensen JL, Bohonak AJ, Kelley ST. 2005.Isolation by distance, web service.BMC Genetics
6:13DOI 10.1186/1471-2156-6-13.
Katoh K, Standley DM. 2013.MAFFT multiple sequence alignment software version
7: improvements in performance and usability.Molecular Biology and Evolution
Kitching RL. 2000.Food webs and container habitats: the natural history and ecology of phytotelmata. Cambridge: Cambridge University Press.
Koopman MM, Carstens BC. 2010.Conservation genetic inferences in the carnivorous
pitcher plantSarracenia alata(Sarraceniaceae).Conservation Genetics11:2027–2038
DOI 10.1007/s10592-010-0095-7.
Koopman MM, Carstens BC. 2011.The microbial phyllogeography of the carnivorous
plantSarracenia alata.Microbial Ecology61:750–758
DOI 10.1007/s00248-011-9832-9.
Koopman MM, Fuselier DM, Hird S, Carstens BC. 2010.The carnivorous pale pitcher
plant harbors diverse, distinct, and time-dependent bacterial communities.Applied
and Environmental Microbiology 76:1851–1860DOI 10.1128/AEM.02440-09. Koski LB, Golding GB. 2001.The closest BLAST hit is often not the nearest neighbor.
Journal of Molecular Evolution52:540–542DOI 10.1007/s002390010184.
Leaché AD, Fujita MK. 2010.Bayesian species delimitation in west African forest geckos (Hemidactylus fasciatus).Proceedings of the Royal Society B: Biological Sciences
277:3071–3077DOI 10.1098/rspb.2010.0662.
Mardis ER. 2008.Next-generation DNA sequencing methods.Annual Review of Ge-nomics and Human Genetics9:387–402 DOI 10.1146/annurev.genom.9.081307.164359. McCormack JE, Heled J, Delaney KS, Peterson AT, Knowles LL. 2011.Calibrating
diver-gence times on species trees versus gene trees: implications for speciation history of
Aphelocomajays.Evolution65:184–202DOI 10.1111/j.1558-5646.2010.01097.x. McKenna DD, Sequeira AS, Marvaldi AE, Farrell BD. 2009.Temporal lags and
overlap in the diversification of weevils and flowering plants.Proceedings of the National Academy of Sciences of the United States of America106:7083–7088
DOI 10.1073/pnas.0810618106.
Miller TE, Kneitel JM. 2005. Inquiline communities in pitcher plants as a prototypical
metacommunity. In: Holyoak M, Leibold MA, Holt R, eds.Metacommunities: spatial
dynamics and ecological communities. Chicago: University of Chicago Press, 122–145. Miller TE, TerHorst CP. 2012.Testing successional hypotheses of stability, heterogeneity,
and diversity in pitcher-plant inquiline communities.Oecologia170:243–251
DOI 10.1007/s00442-012-2292-1.
Nei M. 1973.Analysis of gene diversity in subdivided populations.Proceedings of the National Academy of Sciences of the United States of America70:3321–3323
DOI 10.1073/pnas.70.12.3321.
Newell SJ, Nastase AJ. 1998.Efficiency of insect capture bySarracenia purpurea
(Sar-raceniaceae), the northern pitcher plant.American Journal of Botany85:88–91
DOI 10.2307/2446558.
Newman CE, Rissler LJ. 2011.Phylogeographic analyses of the southern leopard frog: the impact of geography and climate on the distribution of genetic lineages vs.
subspecies.Molecular Ecology20:5295–5312DOI 10.1111/j.1365-294X.2011.05353.x.
Noss RF. 1989.Longleaf pine and wiregrass: keystone components of an endangered
O’Brien HE, Parrent JL, Jackson JA, Moncalvo JM, Vilgalys R. 2005.Fungal community
analysis by large-scale sequencing of environmental samples.Applied and
Environ-mental Microbiology71:5544–5550DOI 10.1128/AEM.71.9.5544-5550.2005. Oksanen J, Blanchet FG, Kindt R, Legendre P, Minchin PR, O’Hara RB, Simpson GL,
Solymos P, Stevens MHH, Wagner H. 2015.vegan: community ecology package. R
package version 2.2-1.Available athttp:// CRAN.R-project.org/ package=vegan.
Paradis E. 2010.pegas: an R package for population genetics with an integrated-modular
approach.Bioinformatics26:419–420DOI 10.1093/bioinformatics/btp696.
Peay KB, Kennedy PG, Bruns TD. 2008.Fungal community ecology: a hybrid beast with
a molecular master.Bioscience58:799–810 DOI 10.1641/B580907.
Peterson CN, Day S, Wolfe BE, Ellison AM, Kolter R, Pringle A. 2008.A keystone predator controls bacterial diversity in the pitcher-plant (Sarracenia purpurea)
microecosystem.Environmental Microbiology10:2257–2266
DOI 10.1111/j.1462-2920.2008.01648.x.
Porter SD, Savignano DA. 1990.Invasion of polygyne fire ants decimates native ants and
disrupts arthropod community.Ecology 71:2095–2106DOI 10.2307/1938623.
Pyron RA, Burbrink FT. 2009.Lineage diversification in a widespread species: roles for
niche divergence and conservatism in the common kingsnake,Lampropeltis getula.
Molecular Ecology 18:3443–3457DOI 10.1111/j.1365-294X.2009.04292.x.
R Core Team. 2015.R: a language and environment for statistical computing. Vienna: R
Foundation for Statistical Computing.Available athttp:// www.R-project.org/.
Rønsted N, Weiblen GD, Cook JM, Salamin N, Machado CA, Savolainen V. 2005.60
million years of co-divergence in the fig-wasp symbiosis.Proceedings of the Royal
Society B: Biological Sciences272:2593–2599DOI 10.1098/rspb.2005.3249. Schloss PD, Westcott SL, Ryabin T, Hall JR, Hartmann M, Hollister EB, Lesniewski
RA, Oakley BB, Parks DH, Robinson CJ, Sahl JW, Stres B, Thallinger GG, Van Horn DJ, Weber CF. 2009.Introducing mothur: open-source, platform-independent, community-supported software for describing and comparing
microbial communities.Applied and Environmental Microbiology 75:7537–7541
DOI 10.1128/AEM.01541-09.
Smith BT, Amei A, Klicka J. 2012.Evaluating the role of contracting and expanding
rain-forest in initiating cycles of speciation across the Isthmus of Panama.Proceedings of
the Royal Society B: Biological Sciences279:3520–3526DOI 10.1098/rspb.2012.0706. Smith CI, Tank S, Godsoe W, Levenick J, Strand E, Esque T, Pellmyr O. 2011.
Comparative phylogeography of a coevolved community: concerted
popula-tion expansions in Joshua trees and four yucca moths.PLoS ONE6:e25628
DOI 10.1371/journal.pone.0025628.
Soltis DE, Morris AB, McLachlan JS, Manos PS, Soltis PS. 2006.Comparative
phylo-geography of unglaciated eastern North America.Molecular Ecology15:4261–4293
DOI 10.1111/j.1365-294X.2006.03061.x.
Sota T, Kagata H, Ando Y, Utsumi S, Osono T. 2014. Metagenomic approach yields
insights into fungal diversity and functioning. In:Species diversity and community
Stamatakis A. 2006.RAxML-VI-HPC: maximum likelihood-based phylogenetic
analyses with thousands of taxa and mixed models.Bioinformatics22:2688–2690
DOI 10.1093/bioinformatics/btl446.
Stamatakis A, Hoover P, Rougemont J. 2008.A rapid bootstrap algorithm for the
RAxML web servers.Systematic Biology 57:758–771DOI 10.1080/10635150802429642.
Stuble KL, Kirkman LK, Carroll CR. 2009.Patterns of abundance of fire ants
and native ants in a native ecosystem.Ecological Entomology34:520–526
DOI 10.1111/j.1365-2311.2009.01098.x.
Tajima F. 1989.Statistical method for testing the neutral mutation hypothesis by DNA
polymorphism.Genetics123:585–595.
Taylor JT, Turner E, Townsend JP, Dettman JR, Jacobson D. 2006.Eukaryotic mi-crobes, species recognition and the geographic limits of species: examples from the
kingdom fungi.Philosophical Transactions of the Royal Society B: Biological Sciences
361:1947–1963DOI 10.1098/rstb.2006.1923.
TerHorst CP, Miller TE, Levitan DR. 2010.Evolution of prey in ecological time reduces
the effect size of predators in experimental microcosms.Ecology91:629–636
DOI 10.1890/09-1481.1.
Tringe SG, Rubin EM. 2005.Metagenomics: DNA sequencing of environmental samples.
Nature Reviews Genetics6:805–814 DOI 10.1038/nrg1709.
Weiblen GD, Bush GL. 2002.Speciation in fig pollinators and parasites.Molecular Ecology 11:1573–1578DOI 10.1046/j.1365-294X.2002.01529.x.
Weisrock DW, Janzen FJ. 2000.Comparative molecular phylogeography of North
American softshell turtles (Apalone): implications for regional and wide-scale
historical evolutionary forces.Molecular Phylogenetics and Evolution14:152–164
DOI 10.1006/mpev.1999.0689.
Wheat CW, Vogel H, Wittstock U, Braby MF, Underwood D, Mitchell-Olds T. 2007.
The genetic basis of a plant-insect coevolutionary key innovation.Proceedings of
the National Academy of Sciences of the United States of America104:20427–20431
DOI 10.1073/pnas.0706229104.
Zellmer AJ, Hanes MM, Hird SM, Carstens BC. 2012.Deep phylogeographic structure
and environmental differentiation in the carnivorous plantSarracenia alata.
Systematic Biology 61:763–777DOI 10.1093/sysbio/sys048.
Zimmerman NB, Vitousek PM. 2012.Fungal endophyte communities reflect
en-vironmental structuring across a Hawaiian landscape.Proceedings of the
Na-tional Academy of Sciences of the United States of America109:13022–13027