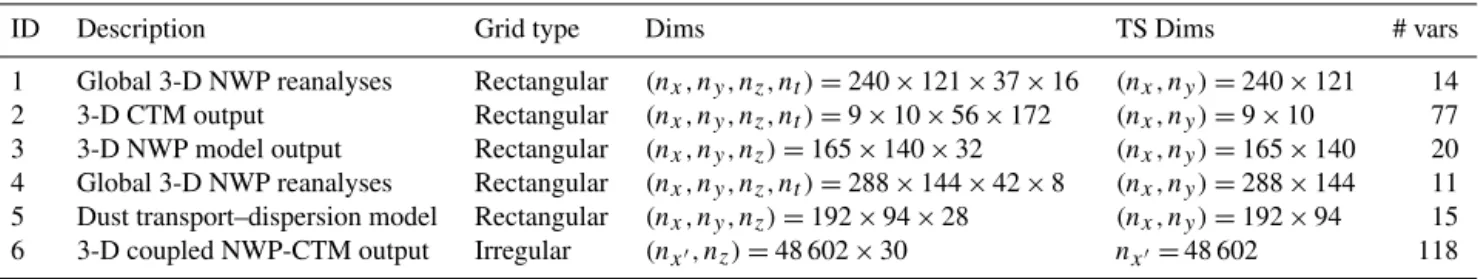
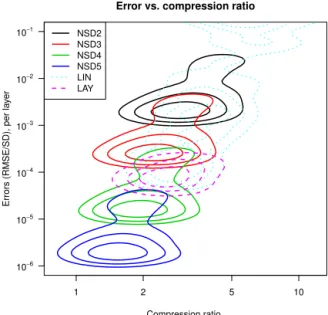
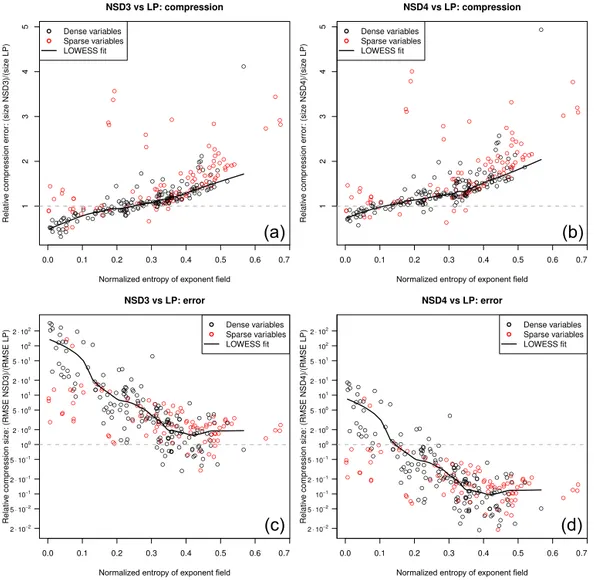
The compression–error trade-off for large gridded data sets
Texto
Imagem
Documentos relacionados
Spinal cord compression was observed more frequently in cases of bone metastasis with a tumor mass compared to cases without a tumor mass; when occurring in the latter, the
From the cylinder compression test and by performing a linear regression with the data of stress and deformation, the value of the real modulus of elasticity of
The an- titag regions are dominated by the multijet background, and have identical kinematic distributions to the multijet background events in the signal region, according to
CI = compression index; RBD = relative body depth; RPL = relative peduncle length; CPC = caudal peduncle compression index; IVF = index of ventral flattening; RAD = relative area
Para além do branqueamento da pasta no interior do pulper, também foram recolhidas amostras para determinação da brancura à entrada da torre de branqueamento 1 (ET1), para medir
Considerando então os principais desafios que se apresentam a estas cidades-metrópoles, nomeadamente, a globalização e as novas formas de organização produtiva –
Outras informações também estão disponíveis nesta folha, como sendo o nível de desempenho de cada aluno no cumprimento das metas/objetivos, as capacidades
a. The planning and management of our Enterprise Architecture must be unified through a central function. Reference Architecture Models shall be used to guide solution designs
